Complete Citation: Das Gupta, Jishu and Howard, Srecko and Howard, Angela (2006). Traffic behaviour of VoIP in a simulated access network. International Transactions on Engineering, Computing and Technology, 18, 189-194. ISSN 1305-5313.
Accessed from USQ ePrints http://eprints.usq.edu.au
Traffic Behaviour of VoIP in a Simulated Access
Network
Jishu Das Gupta, Srecko Howard, Angela Howard
University of Southern QLD
Toowoomba, QLD 4350, Australia
Abstract— Insufficient Quality of Service (QoS) of Voice over Internet Protocol (VoIP) is a growing concern that has lead the need for research and study. In this paper we investigate the performance of VoIP and the impact of resource limitations on the performance of Access Networks. The impact of VoIP performance in Access Networks is particularly important in regions where Internet resources are limited and the cost of improving these resources is prohibitive. It is clear that perceived VoIP performance, as measured by mean opinion score [2] in experiments, where subjects are asked to rate communication quality, is determined by end-to-end delay on the communication path, delay variation, packet loss, echo, the coding algorithm in use and noise. These performance indicators can be measured and the affect in the Access Network can be estimated. This paper investigates the congestion in the Access Network to the overall performance of VoIP services with the presence of other substantial uses of internet and ways in which Access Networks can be designed to improve VoIP performance. Methods for analyzing the impact of the Access Network on VoIP performance will be surveyed and reviewed. This paper also considers some approaches for improving performance of VoIP by carrying out experiments using Network Simulator version 2 (NS2) software with a view to gaining a better understanding of the design of Access Networks.
Keywords— codec, DiffServ, Droptail, RED, VOIP
I. INTRODUCTION
HE startling growth of Internet technology, coupled with the relatively low deployment cost of Interment Protocol (IP) networks, has created a push for an integrated “IP-based core” - a single network for data, video and voice access. However, the diverse service-requirements and novel traffic characteristics of the emerging Internet applications
have posed many technical challenges that the Internet community must address in the near future, as the emerging multimedia applications begin to constitute an ever-increasing fraction of Internet traffic. High quality interactive voice and video applications tolerate little delay variations and packet losses. The economic advantages of provisioning this range of service by means of a single infrastructure are considerable. Effective networking for this diverse range of multimedia applications requires in-depth research in various fields of the internet based application. The change to VoIP provides a more cost effective communication solution to the business and more and more businesses are developing IP based solutions for their day to day use. Firms that have upgraded their hub-and-spoke architecture to a mesh network architecture using Multi Protocol Label Switching (MPLS) Virtual Private Network (VPN)’s may gain even bigger savings from moving aggressively to VoIP [1]. All these business developments are depending on quality of service and the adoption of high bandwidth to ensure better performance. The existing Access Networks are not able to meet the needed services. While we like to think that everyone is connected there are still households and businesses around the world that do not have access to high bandwidth networks preventing them to take advantage of more cost-efficient options like VoIP.
This paper focuses on VoIP performance issues that mostly relate to the packet drops in the Access Network. The problems encountered with VoIP data in an Access Network connection are outlined and an investigation is undertaken to provide some solutions for these problems. Further research would benefit from focusing on specific performance problem as well as dynamic Differentiate Services (DiffServ) developments.
II. BACKGROUND
VoIP generates a lot of traffic, which also increases the traffic flow in the Access Networks. The end to end VoIP communication needs to navigate through the Public Switched Telephone Network (PSTN) causing an increase of traffic which has a detrimental affect on the PSTN and VoIP quality [2], [3], [4].
In today’s internet, the Core Network is sufficiently capable to handle voice traffic [2]. However, performance degradation in the Access Network requires further work. Although VoIP services have partially supplanted traditional toll telephone services, when users make a VoIP telephone call, they must, in most cases, still go through a local telephone network. Since the service was introduced to the public, VoIP toll telephone traffic has increased with astonishing speed. By the end of 2002, VoIP toll telephone traffic had surpassed traditional toll telephone traffic [1]. Four factors have been identified which have contributed to this phenomenon [5].
• Price advantage
• New and profitable area for ISPs’
• Potential value in the transition to next generation networks
• Benefits for the traditional telephone service provider
The main problem with VoIP at present is the lack of guaranteed QoS. There are different types of delay involved in the transmission of IP packets for VoIP. From [2] we can focus on the different types of delay that are involved in the VoIP QoS. End-to-end delay is due to codec processing as well as propagation delay. ITU-T Recommendation G.114 [6] recommends the following one-way transmission time limits for connections with adequately controlled echo mechanism (complying with G.131 [7]):
• 0 to 150ms: acceptable for most user applications; • 150 to 400ms: acceptable for international connections; • > 400ms: unacceptable for general network planning
purposes; however, it is recognized that in some exceptional cases this limit will need to be exceeded. As discussed previously the Core Network is capable of handling large amount of data packets. But when we consider the Access Network there remains a problem that occurs when large data chunks are introduces inside the Access Network as well as from Access Network to Internet. Losing packets in the Access Network may cause missing sentences, broken speech, and noise on the line which could cause a delay in the conversation as well as affect quality of the conversation. Handling the data effectively can eliminate the problem of quality of service. Managing the data flow to smoothly handle the extra load seems to be the best way to prevent packet loss and improving the QoS.
III. EXPERIMENT OUTLINE
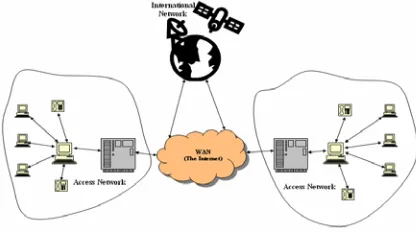
To investigate possible solutions for improving QoS, a number of simulations were undertaken using Transmission Control Protocol (TCP) flows as well as User Datagram Protocol (UDP) flows. TCP flows were used mostly for the shortest transmission and normal data flow whereas UDP was used for the VoIP data flow. TCP by design backs off when TCP packets get dropped and retransmits the packets again. UDP by design transmits the packets once and never retransmits the packets again. Voice communication does not require retransmission as the delay would lower the quality of service and in the case of VoIP to ensure quality service we need to ensure a smooth transmission of data (UDP flow). Fig. 1 shows a complex network of the telecommunication system (in outline). Thousands of such Access Networks shown here, together with the core network create an entire real world network. Studying an individual link in this network could lead us towards a solution for the entire network.
[image:2.612.339.547.325.446.2]Fig. 2 shows the model used in the simulations. In this network both VoIP and TCP/IP data traffic will be used to test the link and bottleneck condition.
Fig. 1: Real life picture of a typical network
Fig. 2: Basic Model for Simulation
In Fig. 2, n0, n1, n2, n3 are four IP routing nodes. In these four nodes n0 is a TCP/IP node and FTP service is the traffic generator for this node. The TCP/IP node has been attached to node n3 via n2 where a “sink” agent is attached. These are all duplex links. Again on the other side node n1 is linked via n2
[image:2.612.334.514.479.595.2]the network. The focus in this experiment is on one of these buffers, namely the one at the head of the link from n2 to n3.
Three different simulation experiments were executed using the NS2 software. These three simulations were based on the same basic model. The tests were performed by changing the traffic control methods in the network. In Experiment 1, a normal Droptail AQM was used. Minor variations of experiment 2 labelled 2B and experiment 3 labelled 3B were performed to fine tune the buffer size to achieve improved performance. In sequence, experiment 2 and experiment 3 have been implemented using RED and DiffServ respectively.
Fig. 3: Model for Simulation with DiffServ extensions For every experiment several different types of outputs were generated:
Graphical output using The Network Animator (NAM) Graphical output using xgraph, each graph showing queue and loss versus time. NAM and xgraph is widely used software for graphical representation of data collected from simulations
All tests were performed under specifically controlled circumstances to generate data that would lead to a clearer understanding of the problems and assist in further research. In Fig. 2, n0 and n1 could be in an Access Network for example. This could be a small business or a home premise. In the third experiment changes were made in the network to accommodate the DiffServ architecture.
The Access Network link was selected to represent the link capacity that most closely resembled the real scenario at the time the simulation was run.
IV. RESULTS
A. Experiment 1: Droptail
The first experiment was a simple network test with Droptail. In this experiment the network consisted of 4 nodes (n0, n1, n2, n3) as shown in Fig. 2. The duplex links between
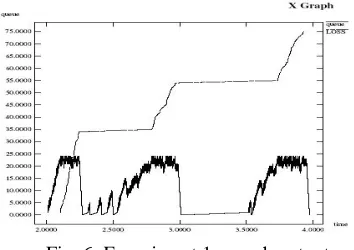
n0 and n2, and n1 and n2 have a 1.5Mbps bandwidth and 10ms delay. The duplex link between n2 and n3 has a 2Mbps bandwidth and 20ms delay. Each node uses a Droptail queue, of which the maximum size is 25 packets. A "TCP" agent is attached to n0, and a connection is established to a TCP "sink" agent attached to n3. As default, the maximum size of a packet that a "TCP" agent can generate is 1KByte. A TCP "sink" agent generates and sends ACK packets to the sender ("TCP" agent) and digests the received packets. A "UDP" agent is attached to n1 and n1 has a direct connection with n3 which is
[image:3.612.347.538.161.396.2]a "null" agent. A "null" agent just frees the packets received. An FTP and a CBR traffic generator are attached to "TCP" and "UDP" agents respectively. The "CBR" agent is configured to generate 128 Byte packets at the rate of 1Mbps. The CBR is set to start at 1.0 sec and stop at every 3.0 sec. The CBR is set to start at 3.5 sec and stop at 4.0 sec and the "FTP" agent is set to start at 0.1 sec and stop at 4.9 sec. For these experiments the time parameters will give a good indication of traffic flow in the simulated network.
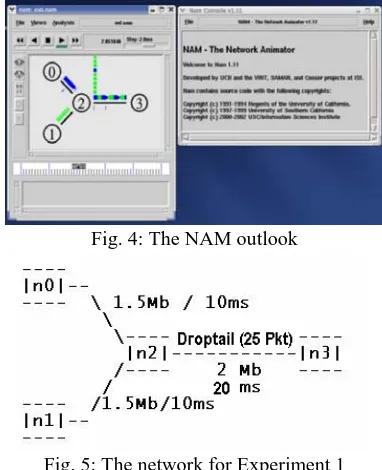
[image:3.612.95.259.189.273.2]Fig. 4: The NAM outlook
Fig. 5: The network for Experiment 1
NS2 provides an animation tool called NAM, which shows all significant events during a simulation by means of a graphical display. Fig. 4 is an example the screenshot of running NAM simulation.
In the simulation, using NAM output it will be noticed that when the queue limit is reached the TCP traffic backs off and this back off situation happens when the TCP packets are dropped and node n0 doesn’t receive the acknowledgements from the "sink" agent. On the other hand, the UDP traffic continues as it doesn’t have to wait for acknowledgements. Comparing Experiment 1 with Experiment 2, it is apparent that by using a standard queuing technique, the data traffic handling condition can be improved. Retransmission of lost voice packets would only degrade the quality that is why UDP has been used.
Fig. 6: Experiment 1 xgraph output
In Experiment 1 the CBR packet size was set to 128 bytes which is often used with the VoIP calls. The Droptail queue system was used to trace the queue and draw the xgraph from the acquired data. From the NAM output we have observed that large number of CBR packets are dropped. The size of the TCP packets in this experiment was 1000 bytes. TCP is expected to back off when data flow increases to the point that packets are dropped. As a consequence of the flow load TCP begins to send acknowledgement for the same packet more than once. The FIFO Droptail queue begins dropping more CBR packets than TCP as the CBR packets don’t back off due to congestion. The main goal was to transmit the CBR packets without excessive loss. The TCP lost packets are retransmitted with a delay which is acceptable for that service. However massive loss of UDP traffic will result in degraded performance in the voice transmission.
Fig. 6 is an xgraph plot of the queue and packet loss versus time. Here the queue limit is reached regularly resulting in packet loss. The loss displayed on the graph is accumulated loss. It is massive in this experiment. Modification of the Droptail AQM over the existing link is not feasible because increasing the buffer size will cause massive delay. This experiment will be further discussed when comparing it to Experiment 2 and 3.
In the presence of the Droptail, AQM Droptail drops substantial amount of packets. These are combinations of UDP and TCP packets. Using NAM it can be observed that the drop rates of UDP packets are higher than TCP packets.
B. Experiment 2: RED
Experiment 2A
The Second experiment uses the same network design with the RED AQM at the buffer at the head of the link from n2 to
n3. The network topology and traffic conditions are exactly the same as Experiment 1. Each buffer except for the one at the head of the link n2 to n3 uses a Droptail queue which has the maximum size of 25 packets.
Fig. 7: Experiment 2 diagram
In the Experiment 2 simulation, using NAM output, we also have noticed that when the queue limit is reached the TCP traffic backs off and this back off situation happens when the TCP packets are dropped and node n0 receive repeated acknowledgement or doesn’t receive the acknowledgements from "sink" agent. This is very similar to the scenario of the Experiment 1. We tried to keep all the node points to behave identically. The UDP traffic, as before, starts and continues as it doesn’t wait for the reply or acknowledgements. As a result in Experiment 2, using the RED AQM data traffic handling condition has been improved. Overall loss is similar but buffer level is reduced, especially in the second half of the experiment.
[image:4.612.84.261.53.178.2]Like previous experiments, this experiment can also be modified in multiple ways so that we can observe the real time picture of the data flow using NAM.
Fig. 8: Experiment 2 xgraph output
[image:4.612.351.536.393.511.2]Fig. 9: Experiment 2 xgraph output with tuning Experiment 2B
In Experiment 2B we have changed the bottle neck bandwidth from 2Mbps to 2.45Mbps. The delay time of 20ms is the same as in the original experiment. Introducing such a change we can see an enormous difference in the queue and packet loss versus time graph shown in Fig. 9.
The improvement we observe is a consequence of change changing the bandwidth to 2.45Mbps. Many other changes can be made. The factors that can be adjusted include delay, queue limit etc.
After more adjustments with bandwidth in the bottleneck we can see in Fig. 9, the queue length and the loss of packets has been substantially decreased. The NAM output shows us that we have a fewer UDP packets dropped which will still cause degradation on VoIP QoS.
C. Experiment 3:DiffServ
Experiment 3A
Our third experiment in ns2 is a network test with the DiffServ system implemented in node n2. In this experiment the network consists of 6 nodes (s1, s2, n0, n1, e2, dest) as shown in Fig. 10.
The core topology of Experiment 3 is the same as Experiments 1 and 2. The details of the additional links are as follows: All the Droptail, AQMs’ have 1.5Mbps bandwidth and 10ms delay. Another two simplex links n2 and e2 use dsRED/core, and e2 and n2 dsRED/edge have 2Mbps bandwidth and 20ms delay.
The full duplex links between s1 and n0, and s2 and n1, and
e2 and dest have 10Mbps bandwidth and 1ms delay and use Droptail. The AQM’s are in use as follows: The simplex link from n0 to n2 uses the dsRED/edge AQM, which marks the packets; the link from n2 and n0 uses dsRED/core which drops packets, in a manner similar to RED, except that voice and data packets are given different treatment, the link from n1 to n2 uses dsRED/edge; and the link from n2 to n1 uses dsRED/core. The link from n2 to e2 used dsRED/core.
[image:6.612.351.525.51.166.2]The traffic conditions are basically the same as in experiments 1 and 2 however, the agents are attached at different locations because the network topology has changed. The "TCP" agent is attached to s1, and a connection is established to a TCP "sink" agent attached to dest. As default, the maximum size of a packet that a "TCP" agent can generate is 1KByte. A TCP "sink" agent generates and sends ACK packets to the sender ("TCP" agent) and frees the received packets. A "UDP" agent that is attached to s2 is connected to a "null" agent attached to dest. A "null" agent just frees the packets received. A FTP and a CBR traffic generator are attached to "TCP" and "UDP" agents respectively. The CBR is configured to generate 1KByte packets at the rate of 1Mbps. The CBR is set to start at 1.0 sec and stop at every 3.0 sec, again CBR is set to start at 3.5 sec and stop at 4.0 sec and FTP is set to start at 0.1 sec and stop at 4.9 sec.
Fig. 10: Experiment 3 diagram
In the Experiment 3 simulation, using NAM output, we have noticed that when congestion occurs the TCP traffic backs off as expected.
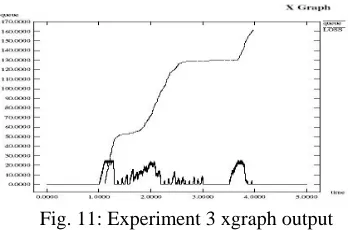
Fig. 11: Experiment 3 xgraph output
This experiment too has experienced high level of packet loss. However, using DiffServ successfully eliminated the CBR loss; the loss is reduced to zero packets. All lost packets are TCP. TCP backs off and retransmits the lost data so this will not seriously degrade the performance. Careful choice of parameters will produce better performance than has been shown in Fig. 11. Here it should be mentioned that congestion in the Access Network will normally occur for a modest proportion of the time. Once the CBR stops sending the packets, the TCP flow will transmit more rapidly. The performance of the DiffServ devices can be modified by adjusting the parameters further.
Fig. 12 Experiment 3B xgraph output with simple tuning Experiment 3B
An adjustment on the existing DiffServ code was made which has been represented on Fig. 12. From the NAM output it can be observed that not a single UDP packet has been dropped.
The main reason this experiment was conducted with DiffServ is to help explain the somewhat high loss rate in Experiment 3. In Experiment 3B this has improved considerably even though the only change has been increased buffer size (50 packets instead of 25). This was undertaken as the most cost effective solution to improve performance on an access network. Due to the specified buffer lengths (queue limit) in packets rather than lengths, and UDP packets being shorter than TCP packets, the effective buffer size in Experiment 3 was less than in Experiment 2. This is one probable explanation for the high packet loss rate in Experiment 3. Experiment 3B helps to strengthen the assumption.
[image:6.612.73.269.518.638.2]packet drops. DiffServ system has successfully mitigated the UDP packet drops which is important for VoIP QoS. During the running of the simulation software NAM for this experiment observations have been made that only packets marked TCP were dropped by the simulated network.
It appears from Experiment 3 that using adjustment of parameters in the DiffServ system the quality of service can be substantially increased in the Access Network.
V. CONCLUSION
Providing reliable, high-quality voice communications over a network designed for data communications is a complex engineering challenge. Factors involved in designing a high-quality VoIP system include the choice of codec and call signalling protocol. There are also engineering tradeoffs between delay and efficiency of bandwidth utilization. VoIP is a time-sensitive application and requires real-time support for its quality of service (QoS) requirements. The traditional Internet, which uses a best-effort mechanism, fails to support the QoS requirement of most multimedia application.
There are several other parameter options available in the DiffServ. Changing those parameters the performance of the network can also be further improved. The parameters and tuning with variable codec can be effective future study and research topics. The findings show that DiffServ implementation provide a better control in better performance in real time sensitive applications in Access Network.
These experiments provide a guideline for future studies implementing complex configurations to better understand and predict the performance of real time media in Access Networks.
It would be interesting to look at the performance of data traffic in the VoIP architecture. This would involve a study of TCP’s ability to utilize the residual bandwidth (bandwidth unused by voice traffic) in the link.
Research could be undertaken in areas of Adaptive variable codec, automated DiffServ design, and parameter reconfiguration. This could automatically be reconfigured implementing Policy based management to assure optimal use of specific service requirements, based on the variations in the traffic flow.
REFERENCES
[1] General Information on the Internet System Survey, ITU-T Publication, Jan 2000.
[2] Goode, B Sep 2002, 'Voice Over Internet Protocol', paper presented to Proceeding of The IEEE, IEEE, Sep 2002.
[3] Cisco System 2001, Quality of Service for Voice Over IP, pp 3-18, <http://www.cisco.com/univercd/cc/td/doc/cisintwk/qosVoIP.pdf>. [4] Moreno, C, Antolin, A, & Diaz, F Jun 2001, Recognizing Voice Over
IP: A Robust Front-End for Speech Recognition on the World Wide Web, IEEE Transactions On Multimedia.
[5] ITU-T Proceeding, 2003, ITU-T PUBLICATION, <http://www.itu.int/ITU-T/>.
[6] One way Transmission time, 1996, ITU-T Recommendation G114, <http://www.itu.int/ITU-T/>.