Rochester Institute of Technology
RIT Scholar Works
Theses
7-31-2018
Validation of an Innovation Mining Framework
Karthikeyan SubramaniFollow this and additional works at:https://scholarworks.rit.edu/theses
This Thesis is brought to you for free and open access by RIT Scholar Works. It has been accepted for inclusion in Theses by an authorized administrator of RIT Scholar Works. For more information, please [email protected].
Recommended Citation
ROCHESTER INSTITUTE OF TECHNOLOGY
VALIDATION OF AN INNOVATION MINING
FRAMEWORK
Karthikeyan Subramani
Thesis submitted to the faculty of the
Rochester Institute of Technology
In partial fulfilment of the requirements for the degree of
Master of Science in Industrial and Systems Engineering
Kate Gleason College of Engineering
Rochester, NY
DEPARTMENT OF INDUSTRIAL AND SYSTEMS ENGINEERING
KATE GLEASON COLLEGE OF ENGINEERING
ROCHESTER INSTITUTE OF TECHNOLOGY
ROCHESTER, NEW YORK
CERTIFICATE OF APPROVAL
M.S. DEGREE THESIS
The M.S. Degree Thesis of Karthikeyan Subramani has been examined and approved by the committee as satisfactory for the thesis requirement for the Master of Science Degree
Approved by:
________________________________________
Dr. Marcos Esterman, Thesis Advisor,
Associate Professor, Department of Industrial & Systems Engineering, RIT
________________________________________
Dr. Brian Thorn, Committee Member,
DEDICATION
I dedicate this respectful effort to My father (Dr. Subramani Jambulingam) and Mother
(Bhuvaneswari Subramani), for their love and teachings over the years have made me the
man I am today.
And
My Sister (Karthika Subramani), who made my Master’s journey possible.
And
My advisor (Dr. Marcos Esterman) and my friend (Srikanth Peyyeti), without whom this
work would not have been possible.
And
My mentor (Dr. Korhan Sevenler), for his support and motivation.
ACKNOWLEDGEMENTS
I thank Dr. Marcos Esterman for presenting me the honor and opportunity to work on this
thesis. I also thank him for his patience, guidance and most importantly for the time he invested
in making this thesis possible. I owe a lot to him for the knowledge he imparted through his
courses and research which helped leverage my understanding on concepts that constitute the
basis for this work and source of inspiration for my career.
I thank Srikanth Peyyeti for giving me the opportunity to further develop his idea and research.
I also thank him for relaying his knowledge on the subject and providing valuable inputs and
guidance. I thank Dr. Brian Thorn for being part of the thesis committee and providing his
valuable inputs and guidance for this thesis.
I take this opportunity to thank Dr. Korhan Sevenler, for his mentorship, support and most
importantly for the learning experience gained working as his Teaching Assistant for the
courses Engineering of Systems – I and Product Lifecycle Management.
I would like to thank Kim Eldridge, Jennifer Barretta and the other faculty and staff of
Industrial and Systems Engineering department for their timely help and support.
A special thanks to my comrades Syed Imran Shajahan, Sanjairaj Gnanasundaram, Sree
Gowrishankar Umamaheswaran, Sabari Girish and Ramprasad Tamilselvan for being a great
moral support. I would like to extend my gratitude to fellow Industrial and Systems
Engineering graduate students, my roommate Aravindh Kuppusamy and to all who helped me throughout my master’s journey.
Finally, I would like to thank my parents, sister, cousins, stalwarts, friends back in India who
ABSTRACT
The driving hypothesis of this thesis is that a quantitative approach linking business objectives
of an organization with technological limitations of the physical product would enable industry
to create more innovative products. The main goal of this research is to validate the
applicability and reliability of the innovation mining framework developed by Peyyeti (2016)
to identify innovation opportunities and components worth innovating in a product. In this
work, the innovation mining framework is applied with minor modifications to a mechanical
pencil, innovation scenarios were then compared to existing innovations in mechanical
pencils. Based on the success of the feasibility trial, the innovation mining framework was
applied to a Dirt-Devil vacuum and compared to innovations implemented in the Dyson-V6
vacuum to improve a set of chosen value-metrics. Based on this study, the following insights
were developed: (1) The model sufficiently identified several innovation opportunities to
improve each value-metric (2) Varying weighting schemes do not have significant effects on
filtered data (3) The top-half of the dendrogram contains the most relevant clusters that present
viable innovation opportunities (4) The relevant clusters must be viewed from a systems
thinking perspective as a single chain that must be innovated for the most benefit (5)
Implementing this model provokes systems thinking approach in the user. This gives a
substantial advantage over intuitive and qualitative approaches by providing insights on hidden
relationships and identifying innovation opportunities in a system that may otherwise be
ignored or unexplored. Opportunities for future-work include developing a transfer-function
system representing true relationships, performing SVD at every level of the coupling matrices
to gain insights into the nature of transformation and cluster formation, comparing clusters
obtained to failure-modes associated with the corresponding value-metric for systematic
prioritization and comparing dendrogram clusters with function-structure map to get detailed
Table of Contents
1.0 Introduction ...1
1.1 Motivation ...1
1.2 Background on Innovation Mining ...2
1.3 Opportunities ...7
1.4 Research Objectives ...9
2.0 Literature Review ... 10
2.1 Approach of Innovation Mining ... 11
2.2 Singular Value Decomposition ... 16
2.3 SVD in Product Development ... 19
2.4 Hierarchical Clustering ... 20
3.0 Research Methodology ... 23
4.0 Feasibility Case Study Results ... 28
4.1 Effect of varying the VOC weighting schemes in QFD – I matrix ... 30
4.2 Effect of filtered and unfiltered data sets ... 33
4.3 Effect of multiple weighting schemes and failure modes ... 37
4.4 Covariance – Correlation – Direction matrix... 40
5.0 Vacuum Case Study Results ... 41
6.0 Conclusion and Future Work ... 88
6.1 Inference and lessons learned... 88
6.2 Synopsis ... 89
6.3 Assessment ... 91
6.4 Future Work ... 94
List of Tables
Table 1 - General characteristics of a Mechanical Pencil ... 29
Table 2 - General characteristics of Dirt Devil Hand Vacuum ... 42
Table 3 - Portability & Reach summary of VOCs and EMs... 50
Table 4 - Portability & Reach Filtered Operating Matrix ... 51
Table 5 - Weighted ‘V’ matrix for Portability and Reach ... 51
Table 6 - Value contribution for Portability & Reach ... 53
Table 7 – Reduced hair wrap summary of VOCs and EMs ... 57
Table 8 - Reduced Hair Wrap Filtered Operating Matrix ... 58
Table 9 - Weighted ‘V’ matrix for Reduced Hair Wrap ... 58
Table 10 - Value contribution for Reduced hair wrap ... 60
Table 11 – Cleaner Exhaust summary of VOCs and EMs ... 63
Table 12 - Cleaner Exhaust Filtered Operating Matrix ... 63
Table 13 - Weighted ‘V’ matrix for Clean Exhaust ... 64
Table 14 - Value contribution for cleaner exhaust ... 65
Table 15 – Improved Runtime Experience summary of VOCs and EMs ... 68
Table 16 - Improved Runtime Experience Filtered Operating Matrix ... 69
Table 17 - Weighted ‘V’ matrix for Improved Runtime Experience ... 69
Table 18 - Value contribution for improved runtime experience ... 71
Table 19 – Consumable cost reduction summary of VOCs and EMs ... 73
Table 20 - Consumable cost reduction Filtered Operating Matrix ... 74
Table 21 - Weighted ‘V’ matrix for Consumable Cost Reduction ... 74
Table 22 - Value contribution for reduced consumable cost ... 76
Table 23 – Improved Cleaning Performance summary of VOCs and EMs... 79
Table 24 - Improved Cleaning Performance Filtered Operating Matrix ... 80
Table 25 - Weighted ‘V’ matrix for Improved Cleaning Performance ... 80
Table of Figures
Figure 1 - Innovation mining framework (adapted from Peyyeti,2016) ...3
Figure 2 - S-Curve for bicycle (adapted from Peyyeti, 2016) ...4
Figure 3 - Matrix links from VOCs to Components (adapted from Peyyeti, 2016) ...5
Figure 4 - Technological trade-off (adapted from Peyyeti, 2016) ... 15
Figure 5 - Single linkage ... 21
Figure 6 - Complete linkage ... 22
Figure 7 - Average linkage... 22
Figure 8 - Centroid linkage ... 22
Figure 9 - Research Methodology ... 23
Figure 10 - Product selection matrix... 25
Figure 11 - Parts of a Mechanical pencil ... 28
Figure 12 - Coupling matrix of VOCs and EMs ... 30
Figure 13 - Coupling matrix for EMs and Components ... 31
Figure 14 - Dendrograms for 139 & 1369 weighting schemes ... 32
Figure 15 - Coupling matrix for unfiltered & filtered data ... 33
Figure 16 - Dendrogram for filtered & unfiltered data set ... 34
Figure 17 - Comparison of model output & actual scenario ... 35
Figure 18 - Coupling matrices linking VOCs - EMs & EMs - Components ... 37
Figure 19 - Dendrogram for combination 1 (top) and 2 (bottom) ... 39
Figure 20 - Dendrogram for combination 3 (top) and 4 (bottom) ... 39
Figure 21 - Covariance-correlation-direction of preferred improvement matrix ... 40
Figure 22 - Dirt Devil Ultra Handheld Vacuum ... 42
Figure 23 - VOC vs EM Relationship matrix for Dirt Devil Hand Vacuum ... 45
Figure 24 - EM vs Components Relationship matrix for Dirt Devil Hand Vacuum ... 46
Figure 25 - Dirt Devil Parent Operating Matrix ... 49
Figure 26 - Hierarchical Clustering for Portability & Reach ... 52
Figure 27 – Innovation Opportunities for Portability & Reach ... 53
Figure 28 - Hierarchical Clustering for Reduced Hair Wrap ... 59
Figure 29 - Innovation Opportunities for Reduced Hair Wrap ... 60
Figure 30 - Hierarchical Clustering for Clean Exhaust ... 65
Figure 31 - Innovation Opportunities for Cleaner Exhaust ... 66
Figure 32 - Hierarchical Clustering for Improved Runtime Experience ... 70
Figure 33 - Innovation Opportunities for Improved Runtime Experience... 71
Figure 34 - Hierarchical Clustering for Reduced Cost of Consumable ... 75
Figure 35 - Innovation Opportunities for Consumable Cost Reduction ... 76
Figure 36 - Hierarchical Clustering for Improved Cleaning Performance... 81
1.0 Introduction
This first chapter provides the motivation for this research and summarizes the existing
quantitative approaches to model innovation. It begins by providing background information
regarding the Innovation Mining framework developed by Peyyeti (2016). This section also
identifies the problems and challenges with the current Innovation Mining framework. The
problem statement is then introduced along with a detailed research roadmap. Following the
problem statement, the concrete research objectives are presented as are the research questions
that will guide this thesis work. To conclude this chapter, an outline of the thesis is presented.
1.1 Motivation
The driving hypothesis of this work is that a quantitative approach that links the business
objectives of an organization with the technological limitations of the physical product would
enable industry to come up with more innovative products. The complex nature of innovation
and the fact that the existing models on innovation (Abernathy and Utterback, 1978;
Christensen, 2013) (despite providing useful insights in understanding the complex
phenomenon of innovation) did not provide a concrete framework or a set of tools to guide
designers in industry to make quick yet reliable decisions for innovation within products and
services prompted the development of the Innovation Mining framework (Peyyeti, 2016). An
understanding of the barriers and struggles faced by a product developer along with the
challenges in the development of a quantitative Innovation model to address the
1.2 Background on Innovation Mining
Given the unclear nature of innovation, Peyyeti (2016) aimed to answer the questions of “when
to innovate?” and “what to innovate?”. The answers to these questions will help to reduce
product development costs, product development time and the costs associated with missing
opportunities in the market. This can be beneficial to the organization in that it can significantly
reduce the time to market giving them a first mover advantage over its competitors.
Despite the fact that there is so much attention on the strategic value of innovation, very few
organizations know how to make it a reliable and a repeatable practice. Business history says
less than 4% of the innovation projects undertaken by businesses are proven successful and the
remaining 96% fail (Kumar, 2013). Innovation of existing products is attracting the interests
of many organizations from a wide range of industries that look to take advantage of the
opportunities in the market (Christensen, 1992, 2013; Chandy and Tellis, 2000). Coming up
with the next wave of innovative products before existing products fail in the market is crucial
for a company to maintain its position and competence in the market. Failing to innovate will
eventually be disastrous for the company as it will result in loss of market share and revenue.
The Innovation Mining framework was developed to identify components that are worth
innovating given an existing system (Peyyeti, 2016). The framework developed by Peyyeti
(2016) identifies and provides insights on clusters of subsystems rather than individual
components but it shows great promise in aligning the business objectives with the challenges
to innovation and provides guidance to innovate from both the customer perspective and the
technological constraints that exist within a system.
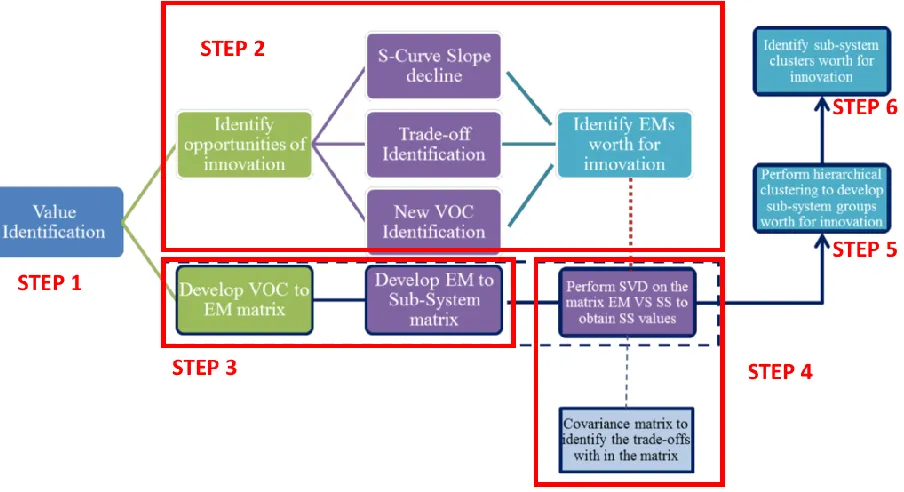
The Innovation mining methodology from Peyyeti (2016) is shown in figure 1 and it consists
Figure 1 - Innovation mining framework (adapted from Peyyeti,2016)
Step 1: Identifying the value metric as a benefit-to-cost ratio
The first step in Innovation Mining is value identification. Value or aspect of the product to be
improved is identified as a benefit-to-cost ratio. Value is defined by the benefit-cost metric that
is relevant to business objectives of the organization.
Step 2: Identifying Engineering Metrics1 (EMs) to focus on from the scenarios of
innovation
The next step is to identify the engineering metrics to focus on based on the three scenarios
that signal innovation, as postulated by Peyyeti (2016).
• S-Curve slope decline
The first innovation scenario occurs when the rate of increase of value of the
benefit-to-cost metric begins to diminish over time. The typical depiction of a benefit-benefit-to-cost as a
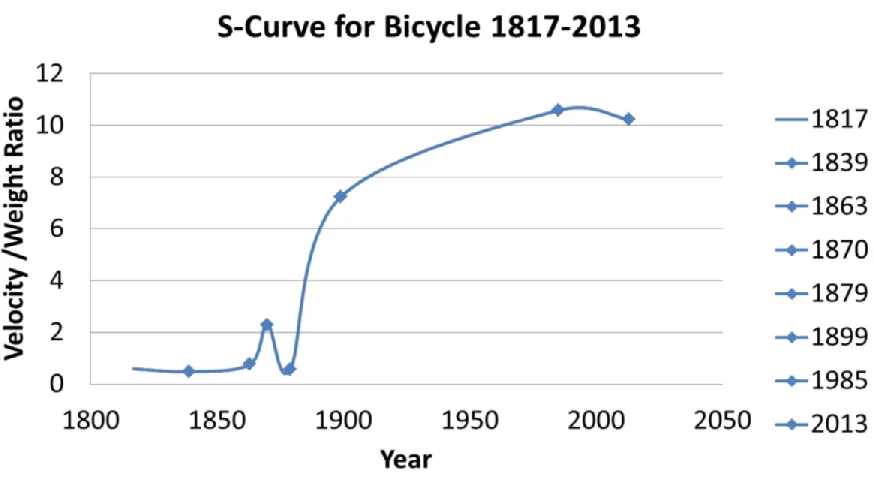
function of time results in an S-curve (Clausing, 1994). This is shown in figure 2 and any
decrease in the slope acts as the signal indicating the need for innovation. By focusing on the
timeline when the product benefit-to-cost metric starts to flatten, the engineering metrics that
directly affect this value metric can be identified.
1 Engineering Metric is a test or objective measure which can be used to determine how well the product meets
Figure 2 - S-Curve for bicycle (adapted from Peyyeti, 2016)
• Technological trade-off
The second innovation scenario occurs when there exist technological contradictions
between the EMs or product parameters that can no longer be resolved. This scenario results
because competing customer requirements continue to evolve until the conflict can no longer
be resolved. These tradeoffs can manifest themselves at the system, subsystem, component or
manufacturing requirement or parameter levels. An example of a tradeoff is wanting a longer
pencil without an increase in weight, here a trade-off between length of the pencil and weight
of the pencil exists.
• New VOC inclusion
The third innovation scenario simply consists of a new, never previously been satisfied
customer requirement. Thus, the inclusion of a new need (VOC) from the customer is
warranted. For example, the need for a camera in mobile phones.
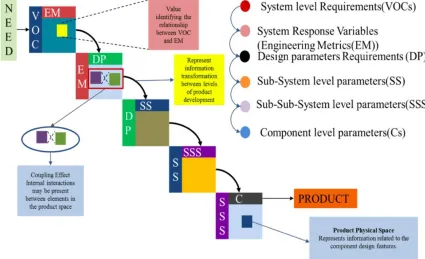
Step 3: Establishing links from VOCs to components
The existing product architecture is then connected in a top-down approach from system level
connections to subsystems were shown, but the full decomposition to components is shown in
figure 3. The following is an explanation of all the acronyms,
• VOC (Voice of the customer) – Subjective descriptions of the customer needs, E.g.
Drills holes
• EM (Engineering Metric) – A solution independent test or objective measure used to
determine how well the product meets customer requirements, E.g. size of the hole to
be drilled
• DP (Design Parameters) – A solution dependent variable that can be quantified and
measured, E.g. diameter of the drill bit, rake angle etc.
• SS (Subsystem) – A self-contained system within a larger system, E.g. camera
subsystem in a mobile phone
• SSS (Sub-subsystem) – A small self-contained system within a subsystem, E.g. zoom
module in the camera subsystem, flash module in the camera subsystem etc.
• Cs (Components) – The major components that make up the sub-subsystems and
[image:14.595.95.520.468.727.2]subsystems in a larger system, E.g. lens in a zoom module
Step 4: Perform Singular Value Decomposition (SVD) to identify the patterns
SVD provides a convenient way for breaking a matrix, which perhaps contains some
underlying structure that we are interested in, into simpler, meaningful pieces. It is a
widely-used technique to decompose a matrix into several component matrices, exposing many of the
useful and interesting properties of the original matrix. SVD is used to reveal the hidden
patterns that lie within the matrices generated above. These patterns connect to a specific set
of requirements and components which can be explored for innovation opportunities. SVD is
explained in greater detail in section 2.2 Singular Value Decomposition.
Another method can be used to identify trade-offs existing in the matrix. Developing
covariance matrix gives us a measure of how two engineering metrics change with respect to
each other. It is positive when the two corresponding engineering metrics show similar
behavior and negative otherwise. This can be used to identify and understand trade-offs in the
system.
Step 5: Perform Hierarchical clustering
Hierarchical clustering is used to represent the patterns of relationships generated from SVD
analysis. Hierarchical clustering is used to provide physical meaning to the links defined by
SVD and define patterns hidden in relationship matrices. Clustering methods like Dendrograms
along with Venn diagrams are used to help visually represent the results generated for better
interpretation.
Step 6: Prioritize
The final step in the framework is to interpret meaning from the resulting clusters and prioritize
the clusters to focus innovation efforts. The clusters will reveal all obvious and imperceptible
relationships and interactions within the system that influence the value metric chosen. The
product developer must make the decision to prioritize a specific cluster over others that present
1.3 Opportunities
The stated primary goal of the Innovation Mining framework (Peyyeti, 2016) is to enable
product developers to help realize the goals of the organization while addressing the challenges
to innovate. However, when reviewing the literature and similar works in the industry,
developing a reliable framework to help product developers systematically identify and
prioritize areas within the design to focus their innovation efforts is an extremely difficult task.
Although, the Innovation Mining framework addresses some aspects of these industry needs
such as aligning the business objectives with the challenges to innovation and providing useful
insights from the customer perspective and the technological trade-offs within the system, it
needs to be intensively validated for reliability and consistency. Some of the other gaps that
were identified in the innovation mining framework will be described below.
The Need for a Weighting System
Weighting system used in the matrix transformations will affect the results of the
framework as it plays a major role in scaling the transfer function used and in determining
the relative importance of the requirements. The current weighting system used is a 1, 3, 9
system similar to the transfer function described above but identifying a weighting system
that better reflects the true contribution of the requirements will improve the quality of the
results generated by the innovation mining framework. Hence, there is a need to identify
an appropriate weighting scheme that gives actual data.
The Need for Detailed method to Identify Critical System Parameters
Detailed Method to identify critical system parameters is vital to achieve the goals of the
framework as much of the innovation mining methodology depends on the identification
of critical system parameters also known as engineering metrics that are related to the value
metric chosen to be the focus of improvement. The framework depends on the scenarios of
innovation to assist in identifying the critical system parameters based on the chosen value
metric. These scenarios have shown promise in identifying critical system parameters but
a more detailed method for the selection of engineering metrics which are used in filtering
the matrix to reduce complexity will enhance the quality of the clusters of
The Need for Prioritized Clusters
Comparison and Prioritization of the subsystem clusters is another area to be focused upon
as there is much value in the way these resulting clusters from hierarchical agglomerative
clustering are interpreted and analyzed. In the existing framework methodology, there is
no consideration to prioritize between the clusters of subsystems obtained after performing
singular value decomposition and hierarchical clustering. Developing a means to
distinguish between the resulting clusters as relevant and irrelevant to the benefit-to-cost
metric and prioritize the relevant clusters in the order of the best alternative to be the focus
of innovation efforts by the organization.
The Need for Identifying Specific Components
Identifying specific components that should be the focus of innovation is one of the primary
goals of the innovation mining framework. The existing framework is successful in
deducing clusters of subsystems but it needs human interpretation (preferably by an expert
on the system being studied). But the framework does not explicitly indicate which out of
the many components in a product should be the focus of innovation to create the most
value. So, devising an advancement of the existing innovation mining framework that will
identify specific components of interest in a product will prove to be beneficial in adding
value to the product and the organization.
The Need for a Value Model
Development of a value model that aids in the analysis and selection of value metrics to
guide the innovation process. A complex product can have many customer requirements
each giving rise to a large number of system engineering metrics. However, to identify
components or subsystem clusters that contribute to a specific aspect of product
performance constituting the benefit-to-cost metric, there is a need to identify a set of
engineering metrics that contribute to that value metric. This is achieved by the application
of the innovation scenarios developed in the innovation mining framework. But the first
scenario occurs when the rate of increase of the value metric begins to decline, which means
a value metric must be identified as a benefit-to-cost ratio to begin with and so do the other
scenarios. Hence, there is a need for a value model that helps in systematically identifying
The Need for Actual Transfer Functions
Developing actual transfer functions that will help to carry true information about the
relationships between row and column elements at each level of the matrix transformations
is thought to be better than high-level approximations. The existing method uses a 1, 3, 9
rating which is the most widely used approximate transfer function in product design. The
output of clusters produced by the framework utilizes the information from the transfer
functions. Hence, there is thought to be a need for the development of actual transfer
functions that captures true relationships at each level of the transformation matrices but
developing an actual transfer function is a difficult task. This need will also not be
addressed in this work but exploring the value for this need is described in future work.
1.4 Research Objectives
The main goal of this research is to validate the applicability and the reliability of the
Innovation Mining framework in identifying Innovation opportunities and components worth
innovating in a product. Furthermore, this thesis will apply the Innovation Mining framework
to a set of products and provide a case study to evaluate the practical execution of the
innovation mining framework, with the final objective of suggesting modifications to improve
the Innovation Mining framework if deemed necessary.
The specific points to be fulfilled during this research along with the research questions that
will guide the process for testing and improving the Innovation Mining framework can be
defined as follows:
1. Apply the Innovation Mining framework to a concrete case study where innovation is
known to have taken place to assess whether the areas that the framework identifies are
the same as where the innovation happened.
2. Based on the insights developed from the case study, develop an appropriate weighting
i. Can a weighting scheme be developed for different levels that will aid in the
identification of components worth Innovating?
ii. How much does the weighting scheme affect the outputs?
3. Interpret meaning from the results of the case study analysis and prioritize the clusters
that are identified
i. Can the resulting pattern from the analysis be interpreted to identify relevant
clusters and irrelevant clusters?
ii. Do the patterns/clusters influence design decisions? What insights can be
obtained?
iii. How can the relevant clusters obtained be prioritized?
iv. Does the identified component match with the changes that have taken place?
4. Propose modifications to improve the framework.
i. What are the weak links in the Innovation Mining framework?
ii. Why are they important? What is causing them?
iii. How can they be solved or reduced?
5. Demonstrate the value created by the framework after modifications.
2.0 Literature Review
As discussed in the previous section identifying innovation opportunities within an existing
product is a challenging task. The efforts made to overcome these challenges are presented in
the literature review. The first section of the literature review concentrates on the approaches
to innovation, the generic nature of Qualitative models, Quantitative models and the Innovation
Mining framework. The second part describes SVD and the last part covers several views on
2.1 Approach of Innovation Mining
There are two major approaches to identify innovation opportunities in industry, the customer
driven approach and the technology driven approach. While most approaches (von Hippel,
1986; Chesbrough, 2004; Brabham, 2008; Witell et al., 2011)consider customer opinions early
in the product design phase, there are other approaches (Keathley et al., 2013) that have their
roots in technological advancements. These are approaches in which innovation is a result of a
technological advancement such as an invention or a new discovery.
von Hippel (1986) suggests that any product being developed should consider error-free
judgment from its informed users about their needs. These informed users are called lead users
and their input is critical to the regular product development process in identifying the real and
implicit needs of the market. By this approach, customers with their well-informed judgment
participate in shaping the needs of the product, however, their knowledge does not affect the
technical aspects and the system level parameters that go into designing the actual solution
which will satisfy the needs identified.
Chesbrough (2004) with his concept of open innovation describes the need to identify
opportunities in uncertain markets where the lead users are indecisive. In such uncertain
markets, companies should be receptive to ideas from both internal and external channels and
have the capacity to use the knowledge accumulated by partners to their benefit. Although open
innovation is widely adopted by many companies it does not provide a clear path to identify
innovation opportunities. The reasons for this may be attributed to the noise added to the
product data by the extensive sources that provide inputs. For example, the Boeing 787
‘Dreamliner’ project involved working with 100+ partners and was nearly two years behind
schedule spending lot more than the planned budget when structural problems were discovered
where the wing was attached to the fuselage (Silverthorne, Sean. “Boeing: The Wrong Way to
Manage Innovation” Money Watch, 23 Jul. 2009,
https://www.cbsnews.com/news/boeing-the-wrong-way-to-manage-innovation/).
Another interesting customer-driven approach to innovation is customer co-creation that
gathers inputs from both the customer’s preference and the firm’s technical experts
responsibility of creating value has shifted from just the firm to the interaction between the
firm and its informed, networked, empowered and active customers. It is a shift from the
traditional firm-centric models to unconventional methods of joint problem definition and
problem solving thus creating a dialogue between the firm and its customers by evaluating their
experiences to generate value for the product. O’hern and Rindfleisch (2010) describe this
perspective of an unconventional approach as the transition of customers from being passive
buyers to active co-creators where they play a big role from the identification of needs to the
development of extensive solutions to satisfy those needs. Customers participate in changing
or improving the new product’s underlying structure through processes like collaborating,
tinkering, co-designing etc. to create variants of the products available in the market. It is
mostly a time-consuming process and even though opportunities of innovation are identified
they may not always prove to be productive. Despite creating valuable inputs to the product
development process, it does not specify the conditions that prompt innovation and the right
time for innovation.
Yet another increasingly popular method to tackle the problems associated with identifying
innovation opportunities is crowdsourcing (Howe, 2006). In this method, the organization makes use of the contributions from individuals or groups. It is usually organized as an
innovation competition where the people that participate present their ideas as inputs.
According to Brabham (2008), crowdsourcing is an online, distributed problem solving
approach. Crowdsourcing is a mix of the top-down and bottom-up models that opens the door
to new ideas and to obtain knowledge that lies beyond the base knowledge of the employees in
an organization.
In summary, the customer driven approaches (von Hippel, 1986; Chesbrough, 2004; Brabham,
2008; Witell et al., 2011)to innovation is an innovation pull where the need for better products
with improved performance is influenced by the market through identification of the real needs
of its customers. Whereas the technology driven approaches (Keathley et al., 2013) to
innovation are innovation pushes from the organization into the markets where better products
with improved performance are introduced because of the advancement in technology or the
core competency of the organization. These methods are beneficial in improving costs, speed,
flexibility, quality, scalability and diversity associated with product development but it lacks
1. Attempting to quantify the interactions between technologies at a detailed level to make the
best out of the information that matters. A way to distinguish between relevant and irrelevant
interactions and take advantage of the information in relevant interactions.
2. A method to prioritize the opportunities identified by these customer-driven and
technology-driven approaches.
3. A method to systematically analyze if the range of possibilities for the solution is considered.
Because a problem can have more than one solution and all alternatives must be considered
and compared to arrive at the best solution.
Unfortunately, most of the innovation opportunities that are identified fail to make the
transformation into actual products that satisfy the customer requirements. The reasons for this
may be attributed to the technological constraints that are involved in identifying the
appropriate time for innovation and the technological trade-offs in the product innovation
process. There are many theories of innovation that aim to address the issue of identifying
innovation opportunities. Most of these theories (Abernathy and Utterback, 1978; Teece, 1986;
Utterback, 1996) are qualitative in nature while some others are quantitative in nature, but we
are concerned more with the quantitative theories and models since the Innovation Mining
framework falls within this category. While qualitative models are concerned with complete
and detailed descriptions of events and provide valuable data about the complex nature of
innovation including data about user needs, behavior patterns and use cases, quantitative
models help in measuring and analyzing the data in detail and provides more objective findings.
Since both qualitative and quantitative models play important roles in product development,
the key aspects of the qualitative models were studied and included when the innovation mining
framework was developed to benefit from the advantages of both the approaches.
The quantitative theories on innovation most commonly involve the tools used to assist in the
process of innovation. These tools are employed in the product development processes for
representing the product in the design space. Keathly (2013) describes some of the most
important tools commonly used in the industry such as the affinity diagram, benchmarking,
QFD, brainstorming, fish-bone diagram, mind-mapping, TRIZ, decision matrix, DFSS, FMEA,
5whys and 2H, flowcharts, kano model and forecasting methods to name a few. Among these
TRIZ is more intriguing as it addresses innovation in a logical manner. TRIZ is a
used to define challenging problems and reduce the complexity to develop inventive solutions.
This method systematically applies its strategies and tools to arrive at solutions that overcome
the trade-offs between two elements of interest. There is great potential for innovation if the
knowledge from a product history could be used to recognize patterns from the evolution of
the product. Such information could prove to be instrumental in predicting the next generation
of products.
The innovation mining framework combines the aspects of both qualitative and quantitative
theories to provide a method that places emphasis on both customer-driven and
technology-driven approaches to innovation in the following ways. The framework identifies three
scenarios of innovation as follows,
1. S-curve slope decline
2. Trade-off scenario
3. New needs inclusion
The first scenario employs s-curve, it is a graphical representation to plot the effects of
innovation with time on x-axis and the benefit to cost ratio on the y-axis. This plot is employed
to identify a decrease in the slope of this curve which indicates a decreased rate of value
delivery which needs to be addressed. The logic for this is that the market expects continued
increase in benefit to cost over time. If the rate is decreasing, eventually value increase will be
zero or negative resulting in a non-competitive product.
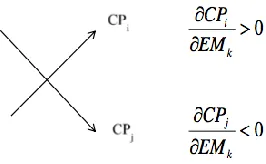
The trade-off scenario is when technological contradictions are identified in a product that can
no longer be resolved to meet customer requirements. For instance, two contradicting
requirements in a car can be that the door be easy to close and that the car interior be unaffected
by the external environment. This leads to the technological contradiction that a small peak
force is needed for requirement one and a large peak force is needed for requirement two. In
this case, a passive seal might be used to resolve the trade-off to a certain extent but after a
certain point of time the passive seal may not be able to meet the evolving requirement and a
more active solution is required to resolve the trade-off. These scenarios are identified by
employing correlation matrix of House I in Quality Function Deployment (QFD), through
TRIZ analysis or from the experience of engineers and subject matter experts (SME’s). For a
represents a trade off in which the critical parameter CPi is the required parameter to be
[image:24.595.231.364.162.244.2]improved and the CPj is the critical parameter to be decreased.
Figure 4 - Technological trade-off (adapted from Peyyeti, 2016)
The third scenario in identifying innovation opportunities is rather simple and includes the
identification and inclusion of a set of new customer needs from the market. Primary and
secondary market analysis tools are used to detect this scenario and the new needs identified
can be captured by employing tools like the House I of QFD. When a specific need arises
within the circle of internal and external stakeholders or in a market with a target value higher
than the current metrics, then that metric takes priority over the metric in use to be improved
for the next wave of product.
Each of the scenarios mentioned above are associated with either a customer requirement or a
technical requirement. So, it is important to establish the links from these requirements to the
components to identify where the innovation efforts should be focused. There are many
different approaches proposed by different authors to identify the links between physical
components and the system space. Nam Suh (1998) suggested the axiomatic design approach,
in which complex systems can be built using the top-down approach rather than the bottom-up
approach. This systems design methodology uses matrix methods to systematically analyze the
transformation of customer requirements (VOCs) into functional requirements (FR), design
parameters (DP) and process variables (PV). The complex relationships for fixed systems is
identified using a top-down approach by building from the functional requirement space to the
component space. This theory is guided by two axioms called the independence axiom and the
information axiom. The independence axiom states that the independence of the functional
requirements must be maintained and the information axiom states that the information content
(Suh, 1998). The innovation mining framework uses a matrix representation to connect the
system level metrics to the product level metrics using a top-down approach like axiomatic
design theory which preserves information across the different levels in the transformation of
customer needs to a product. The following expressions represent mathematically the definition
of the links and the design matrix used in the different levels of transformation from one space
to another,
FRs = [A] DPs
DPs = [B] Cs
Matrix [A] represents design matrix used for transformation from functional requirement (FR)
space to the design parameter (DP) space. Matrix [B] represents the design matrix used for
transformation from design parameter (DP) space to the component (C) space.
2.2 Singular Value Decomposition
Singular value decomposition (SVD) (Strang, 2007) is a method to perform linear
transformation and is one of the critical factorization techniques in linear algebra. Data can be
represented in a matrix form where the information is represented by the different rows and
columns of the matrix. SVD provides a convenient way for breaking a matrix, which perhaps
contains some data we are interested in, into simpler, meaningful pieces. It is a widely-used
technique to decompose a matrix into several component matrices, exposing many of the useful
and interesting properties of the original matrix. SVD can be used as an approach to identify
patterns in an existing matrix as follows.
Per the concept of SVD, any input data matrix A[mxn] can be taken and represented as a
product of three different matrices U, 𝛴 & V each with some constraints on them. Where ‘m’
indicates the number of rows and ‘n’ the number of columns in matrix A. The matrix U[mxr]
stores left singular vectors where r is rank of matrix A and indicates the total number of
concepts. The matrix 𝛴[rxr] is a diagonal matrix with elements only in its diagonal which
indicate the strength of each concept. Every element in this matrix are zeroes except the
diagonal elements and these non-zero elements are called singular values. It is assumed that
these singular values are sorted in the decreasing order, the largest singular value comes first,
serves as the conceptual basis for representing the given input data matrix into three different
matrices with matrix 𝛴 having a special structure being the diagonal matrix.
The SVD theorem states that: It is always possible to decompose a real matrix A into A =
U𝛴VT, a matrix ‘A’ can get decomposed into only a unique set of matrices U, 𝛴, V, i.e. no
other matrix can decompose into the same set of matrices U, 𝛴, V as matrix ‘A’. where, the
matrices U and V are column orthonormal which means that columns of U and V have
Euclidean length = 1, so the sum of the squared values in each column of these two matrices
equals one. Also, these columns are orthogonal which means that when we take two columns
of U or V and multiply or dot product them with each other the result is zero. Another feature
of the diagonal matrix 𝛴 is that its singular values are positive, they are sorted in decreasing
order and they are all greater than zero,
𝜎1≥𝜎2≥𝜎3≥…... ≥ 0
An example provided by (Leskovec, Rajaraman and Ullman, 2014) uses SVD approach to
identify hidden patterns in the matrices. In the example, rows are represented by various names
of people like Joe, Jim, John, Jack, Jill, Jenny, Jane and the column vectors is represented by
names of movies like Matrix, Alien, Star-wars, Casablanca and Titanic. The values in the
matrix represent the scores that they provided based on the level of their fondness of the
corresponding movies in the column vectors on a scale of 0 to 5. The rows have names of males
and females and the columns indicate the movies of different genres, in this case, romantic and
sci-fi genres only. This matrix does not explicitly provide information regarding the patterns
that lie hidden in the matrix. After performing SVD on the movie ranking matrix, new and
interesting patterns could be identified which were not clear with the original matrix.
The Goal here is to discover a set of concepts from the patterns hidden in the matrix.
Now we can think of matrix
U – as user to concepts similarity matrix
V – as movie to concept similarity matrix
SVD gives the best low rank approximation of a matrix i.e. ithelps represent matrix A into a
matrix B of lower dimensionality by neglecting some columns, concepts and rows respectively
from the matrices U, 𝛴 and V. Where matrix B is the best approximation of Matrix A which
means that the difference between matrices A and B is as small as possible. So, in a case, A
and B are as close to each other as possible given that the data points should be represented
with a small number of coordinate scale. To be precise, the theorem states that:
If A = U𝛴VT, where 𝛴: 𝜎
1≥𝜎2≥𝜎3≥…... ≥ 0 and rank(A) = r then B = USVT is the best
k-rank approximation to A where,
S = diagonal matrix nxn where si = 𝜎i (i = 1, 2, …k) else si = 0
The important thing to notice is that the matrix S is a diagonal matrix where the first k entries
of S are the corresponding singular values from matrix 𝛴 and the rest is zero. When matrix 𝛴
is replaced by matrix S we obtain the new matrix B, the main idea is that, matrix B is the best
reconstruction of matrix A. Because the singular values 𝜎i are ordered 𝜎1≥𝜎2≥ 𝜎3≥…... ≥
0, however, significant compression of the data is possible if the spectrum of singular values
has only a very few strong entries. When attempting to reduce the dimensionality,zeroing out
the lowest s values is the best thing to do because the vectors Ui and Vi are of unit length
because they are column orthonormal and basically when the product of U and V is multiplied
with s, the value of s scales them. To have the least possible error, the vectors with small
importance should be dropped i.e. the vectors that have small s must be dropped. Hence,
zeroing out the lowest s values introduces the least possible error because large singular values
point to important features in a matrix. It is best to reduce the dimensionality and at the same
time preserve as much data as possible. Hence, a good thumb rule would be to preserve at least
80-90% of the energy. The total energy can be defined as the sum of the squares of the singular
values (= 𝛴𝜎i2). To preserve 90% of the energy the following ratio must be maintained,
𝛴ik𝜎i2 / 𝛴ir𝜎i2 = 0.9
Any real matrix A can be taken and be represented as the product of three special matrices U,
𝛴, VT. This decomposition is unique. This transformation also reduces the dimensionality of
1. 80-90% of the energy is preserved
2. SVD picks up linear correlations and identifies dimensions along which data is
spread out the most
3. SVD discovers redundancy in a matrix and provides a format for eliminating it.
2.3 SVD in Product Development
SVD is used everywhere form physics to machine learning for dimensionality reduction; the
algorithm commonly known as Principle Component Analysis (PCA), for instance, is just a
simple application of the singular value decomposition. In computer vision, the first face
recognition algorithms developed in the 1970’s and 1980’s used PCA and SVD to represent
human faces as a linear combination of “eigenfaces”, perform dimensionality reduction, and
then match faces with identities via simpler methods. Although modern methods are much
more sophisticated, many still depend on similar techniques. With such strong presence in
modern technology SVD has also penetrated the product development industry. The potential
of SVD in product development can be seen in the works done by Hölttä, Eun Suk and de Weck
(2005) and Holtta-Otto and de Weck (2007).
Holtta and de Weck (2007) show that there is an inherent trade-off between modularity of
product architecture and some technical constraints such as weight, size or other performance
constraints. In contrast, when the design of the product is driven by business goals, the degree
of modularity is higher. They point out that there appears to be a potential trade-off between
the desire for modularity from a business standpoint and the desire for high performance and
efficiency in the technical domain. Resolving this trade-off could open the door to new
possibilities and provide new directions for identifying opportunities for innovation and
maintain a balance between the business objectives and the technological constraints.
Holtta-Otto and de Weck (2007) have developed the SMI (Singular value Modularity Index)
based on the decay pattern of the singular values of the binary DSM describing the
interconnections between components. They used DSM to map the interconnections between
elements of form. They perform SVD on the binary DSM matrix which reveals its singular
corresponding orthogonal eigenvectors. With the help of these singular values a modularity
index is therefore postulated that reflects the degree to which the important information for
describing system connectivity is concentrated in a few components that are highly connected
across the system. A change to the single highly connected component has the potential for
affecting all other components in the system. This suggests that deliberately architected
products, especially those that are very integral or very modular do not emerge randomly but
are either driven by technical or business considerations. The advantages of their approach are
that (1) it does not depend on subjective definition of module boundaries and (2) always returns
the same value regardless of the ordering of rows and columns of the DSM.
2.4 Hierarchical Clustering
Hierarchical clustering is method widely used in data mining and statistics. It is a method for
cluster analysis that groups data by creating cluster tree or dendrogram over a variety of scales.
The dendrogram is not a single set of clusters but rather a multilevel hierarchy. There are two
strategies widely adopted in hierarchical clustering namely (Rokach and Maimon, 2005),
• Agglomerative: This is a bottom-up approach, each observation or data point starts in
its own cluster and pairs of clusters are merged as one moves up the hierarchy.
• Divisive: This is a top-down approach, all observations or data points start in one cluster
and splits are performed recursively as one moves down the hierarchy.
The hierarchical clustering analysis groups together clusters based on proximity/similarity of
the observations and the clusters to each other. The proximity or similarity between clusters is
determined by measuring a distance between them. There are many different distance metrics
that can be used namely Euclidean distance, Squared Euclidean distance, Manhattan distance,
Maximum distance, Mahalanobis distance etc. with Euclidean distance being the most
commonly used distance metric ("The DISTANCE Procedure: Proximity
Linkage Method:
The linkage method used in the hierarchical clustering analysis determines how the distance
measured between two clusters is defined. At each level two cluster closest to each other are
joined. In the initial stage, each observation constitutes a cluster, the distance between clusters
is the inter-observation distance. After the first level of joining the observations together, a
linkage rule is necessary to compute inter-cluster distances when there are multiple
observations in a cluster. There are several linkage methods that can be adopted based on the
characteristics of the data (Szekely and Rizzo, 2005). The commonly used linkage methods are
discussed below.
Single Linkage
It is based on the shortest distance and is also referred to as the nearest – neighbor approach as
shown in figure (5). First it identifies two observations separated by the shortest distance and
places them in the first cluster. Then the next shortest distance is found and either a third
individual joins the first two to form a cluster or a new two – object cluster is formed. It produces long chains of clusters: a → b → c →….→ z
Figure 5 - Single linkage
Complete Linkage
It is based on the longest distance between the objects and is referred to as the farthest –
neighbor approach as shown in figure (6). First, two objects at the longest distances are
assigned to two separate clusters. Then the next longest distance is found and either a third
individual joins the first two to form a cluster or a new two – object cluster is formed. Produces
Figure 6 - Complete linkage
Average Linkage
The clustering criterion used in this linkage method is the average distance from objects in one
cluster to objects in another as shown in figure (7). It is based on all members of the clusters
rather than on a single pair of extreme members. This method uses average of all pairwise
distances and is least affected by outliers.
Figure 7 - Average linkage
Centroid Linkage
This linkage method measures the distance between cluster centroids as shown in the figure
(8). The process continues by combining the clusters according to the distance between their
centroids, the clusters with the shortest distance being combined first and so on.
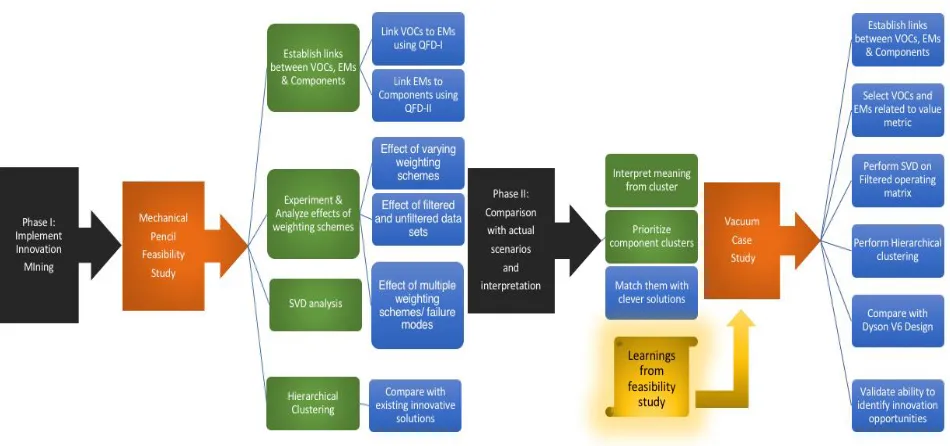
3.0 Research Methodology
In this chapter, the methodology utilized for conducting this research is detailed. As mentioned
earlier the basic theories of innovation, principles of systems engineering and fundamental
mathematical formulations employed in the development of the Innovation Mining framework
and their limitations are of prime concern in the validation and improvement of the framework
under study. Considering a thorough understanding and an extensive experimentation on the
framework is required to propose modifications to improve the framework, an iterative process
is envisioned to proceed with the validation of the framework. The work to be done can be
[image:32.595.61.536.378.601.2]organized into two phases shown below in figure 9.
Figure 9 - Research Methodology
The final phase of the research deals with the application of the demonstrated methodology to
a product with medium level complexity. The main objective of the proposed methodology is
to study the disparities that arise upon the application of the methodology, if any, to a more
Framework, a comparison will be made to existing innovative solutions to validate the ability
of the framework in achieving its objective to identify opportunities for innovation. The
comparison results are studied to identify areas for future research and recommending
improvements to the framework. For instance, say the existing innovative solutions do not
match with the results obtained after the application of the framework, it means that there are
two possibilities. Firstly, it may be indicating that there are other component sets which upon
innovating could have given the most benefits to the organization and the end users. Secondly,
it could have been a result of the unreliability of the input data or the inadequacy of the
framework itself, pointing out that the framework needs to be refined further to make it as
reliable as possible. The following are the objectives for the proposed methodology,
• Application of the demonstrated framework methodology to complex products with
more number of components.
• If the framework is successfully applied in a practical setting, the comparability of case
study results and actual scenarios is a feasible objective.
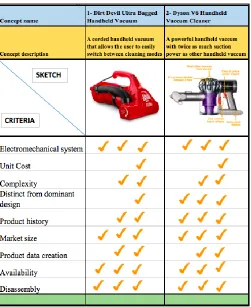
• The following products have been chosen for the case study application
1. Dirt Devil Ultra bagged hand-held vacuum
2. Dyson V6 Hand-held vacuum cleaner
Several products are available to be used in the case study but the products are chosen
considering the selection criteria, the rating for each criterion and the scope. The Product
Selection Matrix displaying the criteria chosen and the rating metric used for selecting the
products is shown in figure 10.
The following features of the products influenced their choice for the case study:
1. The products are simple electromechanical systems.
2. The products have a long history and line of predecessor products.
3. The design of the products is distinct from the dominant design in the industry (The
dominant traditional design included a bag that acted as the pathway for both suction
and dust collection).
4. The product system and subsystem complexities vary from low to medium but have
5. The unit cost of the products is low and they are easily available.
6. Since they are common products, product data can be created with measurements by
the author and do not require knowledge of SMEs.
7. Disassembly of the products are simple and easy.
8. The market size of the products is significant enough to be considered high value
[image:34.595.174.425.235.542.2]products.
Figure 10 - Product selection matrix
If the framework can be successfully applied to products in a practical setting, then validation
of the framework will be a feasible objective. This part of the methodology will help us
Phase – I: Implementing Innovation Mining framework
First part of the methodology is concerned with the application of the ‘Innovation Mining’
framework to a set of products with varying levels of complexity selected based on some
research criteria. Assuming a value metric is identified as a benefit-to-cost ratio that is relevant
to the business objectives of the organization, the following steps are involved in the
application of the framework to the set of products selected for the case study.
a. Linking Innovation scenarios to the set of products
The links from the innovation scenarios to the components is established through engineering
matrices like the I that link stakeholder requirements to system requirements and
QFD-II that link system requirements, design parameters, subsystem requirements, subsystems and
components as depicted in figure (3). The relationships are established based on the number of
levels considered for the analysis. The number of levels is chosen depending on the complexity
of the product and the degree of detail needed. This is done to establish the existing product
architecture and understand the interactions happening at the different interfaces within the
product. This will enable us to make changes to the existing VOCs or include new VOCs and
perceive the significance of a set of EMs and their role in fulfilling a VOC.
b. Experimenting and Analyzing the effect of Weighting schemes
The weighting scheme at the different levels of the engineering matrices along with the transfer
function links the VOCs to EMs, EMs to subsystems etc. The weights populated may indicate
the importance of each requirement relative to the other requirements. This weight will then be
used to scale the transfer function populated in the matrices carrying information regarding the
degree of fulfilment of the attributes from the system level to the component space. The
manipulation of the weighting scheme and the application of the framework is iterated with the
different possibilities of combinations to obtain a set of relationships between the components
for each weighting scheme used. The results are then examined to study the effects of changing
the weighting schemes on the relationships generated. The experimentation methodology is
explained in greater detail in chapter 4.0 Feasibility Case Study Results.
c. SVD Analysis using Matlab
Singular value decomposition is used on the relationships established above to identify the
underlying pattern and arrive at a set of components from the existing design that should be
the focus for innovation. This analysis does not delineate the underlying pattern directly rather
it defines the links from the system level to the component level. SVD along with the concept
of SVD is explained in greater detail in section 2.2 Singular Value Decomposition.
d. Grouping Using Hierarchical agglomerative clustering
Hierarchical clustering is used to provide physical meaning to the links defined by SVD and
define patterns hidden in relationship matrices. Clustering methods like Dendrograms along
with Venn diagrams are used to help visually represent the results generated for better
interpretation.
Phase – II: Comparison with Actual Scenario
The set of results from the application of the Innovation Mining framework gives us a
non-prioritized list of components where the innovation efforts must be focused for the most
benefit. At this stage, we look for clever solutions existing in the market that solve these
problems/failure modes. A question may arise as to why cannot these components be picked
by inspection? but in this case, we are picking them based on actual available data by using a
quantitative methodology whereas picking from inspection would be entirely based on human
intuition. Our goal is to provide a quantitative method that is dependent on actual available
product data. These components are then compared with the actual change/innovation that has
occurred in a similar system, as these innovations could have been made to resolve a certain
problem in the product. Ideally, the components highlighted by the framework to solve a
specific problem should match with the components that have been innovated to solve the same
problem in a similar improved system.
These results of comparison between the output and actual scenarios will be represented
using an image displaying the components that make up the product. The image shows the
results of the innovation mining framework by highlighting the components to be the focus of
the innovation efforts. The image highlights those components of the product that has been
use of this image to represent the comparison analysis makes interpretation easier for any
person. After analysis, conclusions can be made and insights can be generated to help
innovation efforts in an organization. Based on the ease of interpretation of the results
generated to identify meaningful clusters of components that correspond with the actual
scenarios, the ability of the framework in identifying innovation opportunities can be validated
and further areas for improvement can be identified.
4.0 Feasibility Case Study Results
In this case example, a sample application of the innovation mining framework is done on a
simple system with less than fifteen parts to demonstrate the feasibility of the effects of making
changes to the framework in identifying components worth innovating. The case study is based
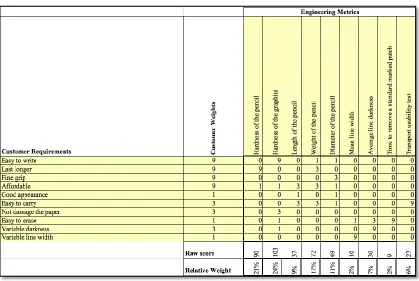
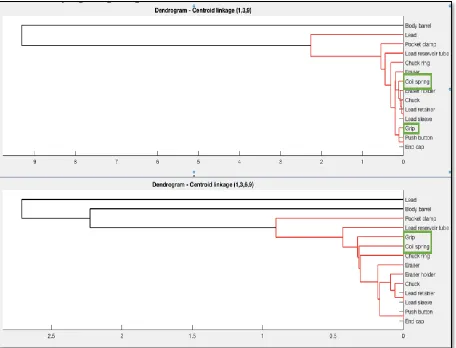
on a mechanical/ drafting pencil shown in figure 11 and the general characteristics of the
system are listed below:
Table 1 - General characteristics of a Mechanical Pencil
Number of components 14
Product cost <$8
VOC Easy to write, Last longer, Fine grip, Affordable,
Good appearance, Easy to carry, Not damage paper,
Easy to erase, Variable darkness, Variable line width
Engineering Metrics Rigidity of the pencil, Hardness of the graphite,
Length of the pencil, Weight of the pencil, Diameter
of the pencil, Mean line width, Average line darkness,
Time to remove a standard marked patch, Transport
usability test
Parts Lead, Lead sleeve, Lead retainer, Lead reservoir tube,
Chuck, Chuck ring, Coil spring, Eraser, Eraser holder,
Pocket clamp, Grip, End cap, Push button, Body
barrel
This product for the feasibility study is represented with information that links VOCs to EMs
and EMs to components. This information is represented in a matrix format by making use of
the house of quality QFD matrices to establish the links from a system level to the component
level as shown in figure 12. In this case example, we study the effects of varying the weighting
schemes, effects of using filtered and non-filtered data sets and the effects of multiple
weighting schemes. The results from the above scenarios are analyzed to check if their
interpretation leads to successfully establishing a link between the resulting clusters and the
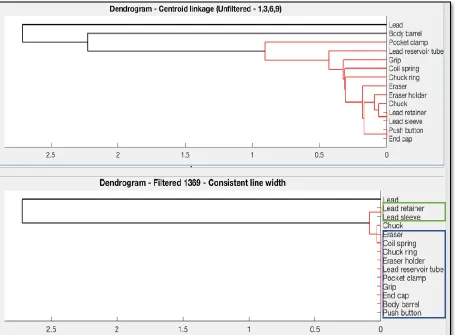
4.1 Effect of varying the VOC weighting schemes in QFD – I matrix
In this phase of the study, the innovation mining framework is applied to the mechanical
pencil with the use of two different weighting schemes. The different weighting schemes used
are 1-3-9 system and the 1-3-6-9 system with the corresponding values acting as the scaling
factor for the transfer function depicting to what extent the VOCs are fulfilled by the EMs in
the house of quality QFD – I matrix as shown in figure 12. The weights represent the
importance of the voice of the customer relative to each other. The weights are categorized as
follows,
1-3-9 System
• 1 – This value means that the VOC is the least important in the perception of the customer
• 3 – This value means that the VOC is important in the perception of the customer
• 9 – This value means that the VOC is the most important in the perception of the customer
1-3-6-9 System
• 1 – This value means that the VOC is the least important in the perception of the customer
• 3 – This value means that the VOC is moderately important in the perception of the
customer
• 6 – This value means that the VOC is important in the perception of the customer
[image:39.595.87.506.441.722.2]• 9 – This value means that the VOC is the most important in the perception of the customer