University of Southern Queensland
Faculty of Engineering and Surveying
Optimisation of biodiesel stationary engine
performance by modelling and simulating the
running conditions.
A dissertation submitted by
Mr Daniel Bichel
In fulfilment of the requirements of
Courses ENG4111 and 4112 Research Project
towards the degree of
Bachelor of Mechanical Engineering
Page | ii
ABSTRACT
University of Southern Queensland
Faculty of Engineering and Surveying
ENG4111 Research Project Part 1 &
ENG4112 Research project Part 2
Limitations of Use
The Council of the University of Southern Queensland, its Faculty of Engineering and Surveying, and the staff of the University of Southern Queensland, do not accept any responsibility for the truth, accuracy or completeness of material contained within or associated with this dissertation.
Persons using all or any of this material do so at their own risk, and not at the risk of the Council of the University of Southern Queensland, its Faculty of Engineering and Surveying or the staff of the University of Southern Queensland.
This dissertation reports an educational exercise and has no purpose or validity beyond this exercise. The sole purpose of the course “Project and Dissertation” is to contribute to the overall education within the student‟s chosen degree program. This document, the associated hardware, software, drawings, and other material set out in the associated appendices should not be used for any other purpose: if they are so used, it is entirely at the risk of the user.
Professor Frank Bullen
Dean
Page | iv
CERTIFICATION
I certify that the ideas, designs and experimental work, results, analysis and conclusions set out in this dissertation are entirely my own efforts except where otherwise indicated and acknowledged.
I further certify that the work is original and has not been previously submitted for assessment in any other course or institution, except where specifically stated.
Daniel Gavin Bichel
Student Number: 0050026810
_________________
ACKNOWLEDGEMENTS
Page | vi
Table of Contents
ABSTRACT ... ii
Limitations of Use... iii
CERTIFICATION ... iv
ACKNOWLEDGEMENTS ... v
List of Figures: ... viii
List of Tables: ... ix
Nomenclature ... x
Chapter 1: Introduction ... 1
1.1 Project Background ... 1
1.2 Advantages and Disadvantages of Biodiesel ... 3
1.3 Making Biodiesel ... 4
1.4 Agricultural advantage ... 6
1.5 Biodiesel: Things to Know ... 8
1.6 Biodiesel Production ... 9
1.7 Topics of Concentration ... 9
Chapter 2: Literature Review: ... 11
2.1 Biodiesel in Australia ... 11
2.2 Biodiesel Feedstock‟s ... 11
2.3 Classification and Production... 13
2.4 Oxides of Nitrogen ... 14
2.5 Transient heat flux ... 18
Chapter 3: Methodology ... 21
3.1 Oxides of Nitrogen Formulation ... 21
3.2 Characteristic Time Formulation ... 25
3.3 Equilibrium Combustion Products Formulation ... 26
3.4 Transient Heat Flux ... 33
3.5 MATLAB Programmes ... 34
Chapter 4: Results and Discussion ... 36
4.1 Results of Oxides of Nitrogen Analysis ... 36
4.2 Results of Characteristic Time Analysis ... 39
4.4 Findings from Simulation... 41
4.5 External Experimental Results: Emissions ... 41
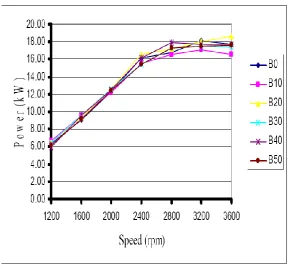
4.6 External Experimental Results: Physical Performance ... 45
Chapter 5: Conclusions ... 49
Conclusions from this dissertation ... 49
Further work ... 51
List of References ... 52
Appendix A: ... 54
Project Specification ... 54
Appendix B: ... 56
Factoring change in speed for table 4.1... 56
Converting units to (L/kWh) for table 4.1... 56
Appendix C ... 57
Matlab Program scripts ... 57
M-file for airdata.m ... 57
M-file for Biodiesel.m ... 59
M-file for ecp1.m ... 64
M-file for farg1.m ... 68
M-file for fueldata1.m ... 70
Page | viii
List of Figures:
(Figure 1.1: cold screw press manufactured by Bio King) ... 7
(Figure 2.1: Concept map of NO emission and combustion characteristics, Van Gerpen, Tat and Wang, 2004) ... 16
(Figure 3.1: Correlation between experimental and theoretical data (Heywood, 1988)) ... 26
(Figure 3.2: Graphical User Interface developed for this simulation) ... 35
(Figure 4.1: Formation rate of NO, Diesel Vs Biodiesel) ... 36
(Figure 4.2: Effect of gas residual fraction - Biodiesel fuel) ... 37
(Figure 4.3: effect of change in equivalence ratio on formation rate) ... 37
(Figure 4.4: Comparison between diesel and biodiesel with different equivalence ratio) ... 38
(Figure 4.5: Characteristic time Vs Temperature with varying compression ratio) ... 39
(Figure 4.6: Equivalence ratio Vs Adiabatic flame temperature) ... 40
(Figure 4.7: Effect of torque on NOx emissions using diesel and waste cooking oil biodiesel blend (Yusaf et al)) ... 43
(Figure 4.8: Carbon Monoxide and Carbon dioxide production levels (Yusaf et al.)) ... 44
(Figure 4.9: Carbon monoxide emissions for biodiesel blends (Najafi et al, 2007)) ... 45
List of Tables:
(Table 2.1: Oil seeds studied by Department of Agriculture and Food, 2001) ... 12
(Table 2.2: Recommended candidates for oilseed production by Department of Agriculture and Food, Western Australia, 2001.) ... 12
(Table 3.1: rate constants for NO formation (Heywood, 1988)) ... 22
(Table 3.2: Typical values for and (Heywood, 1988)) ... 24
(Table 3.3: Variable values for equation (3.29) (Ferguson, 1988)) ... 28
(Table 3.4: Low Temperature Combustion Products, vi (moles/mole of air) (Ferguson, (1988))... 30
(Table 4.1: Stationary diesel engine generator results (Pereira et al, (2007))) ... 47
Page | x
Nomenclature
NOx Oxides of Nitrogen
NO Nitric oxide
NO2 Nitrogen Dioxide
CO Carbon Monoxide
Characteristic Time
Initial Formation rate of Nitric oxide
Molar fuel to air ratio
Fuel to air equivalence ratio
Carbon atom concentration (in the fuel)
Hydrogen atom concentration (in the fuel)
Oxygen atom concentration (in the fuel)
Nitrogen atom concentration (in the fuel)
Moles of particular combustion product (i = 1 to 10)
Mole fraction of particular combustion product (i = 1 to 10)
P Pressure in atmospheres
Chapter 1: Introduction
1.1 Project Background
Chapter 1: Introduction November 2007
Page | 2 change in the way we can generate power, many of these changes are currently in the form of blending renewable fuels with their fossil fuel based, non-renewable counterparts, such as ethanol and methanol. Other inclusions include the use of solar and wind energies where they are most beneficial, and the adaption of hydro electricity in convenient locations such as dam walls and river systems. Another addition that is slowly becoming better known is the commercial production of biodiesel. This is the area that the dissertation will focus on, as the fuel can become more economical viable than that of other alternative renewable energies. In this dissertation the key points that will be focused on are:
Analyse current literature on the use of biodiesel in internal combustion engines. Determine the current effectiveness of biodiesel use in the agricultural industry. Model and simulate the running conditions of biodiesel in an internal combustion engine.
Alter specific engine parameters and determine the effect of this change in the performance of the engine, while comparing biodiesel to traditional diesel, and relating them to the affect on production of oxides of nitrogen and transient heat flux. Compare the modelled results with available data to determine the effectiveness of the model.
Analyse the effectiveness due to modelled data and existing data, in using biodiesel in the agricultural industry for use in stationary engines and other engines.
These key points will be discussed in detail throughout this dissertation. But first it is important to understand where biodiesel comes from.
Biodiesel is a renewable replacement for the fossil fuel bases petro diesel. Biodiesel has three main components in its production, these are:
1. Oil or fat, produced from a renewable feedstock, these include palm, vegetable, canola oil and many others.
2. An alcohol, either methanol or ethanol
the world, ready for an interesting and challenging task, for this reason there are many people that currently make their own fuel for personal use.
1.2 Advantages and Disadvantages of Biodiesel
It is not only the cost that is the main advantage of the fuel, there is many other associated advantages in using biodiesel:
Renewable energy source
Many sources of feedstock‟s available for use in production Recycling of oils normally resorted to as “waste”
Proven reduction in the production of most greenhouse gasses Biodegradable
Can be used in existing compression ignition engines Can be made at home
Can be blended with petro-diesel
Utilises re-release of carbon emissions rather than new release of stored carbon
These are a few of the most well known advantages of the fuel, but as anything it is also suspect to disadvantages as well:
Can cause an increase in the production of oxides of Nitrogen
Produces slightly less power and torque when used in an unmodified compression ignition engine
Commercially produced biodiesel can be more expensive than normal diesel Production of waste product, glycerine
Can void warranty with some vehicle and machinery manufactures
Chapter 1: Introduction November 2007
Page | 4 Therefore some of these advantages and disadvantages can be subjected to questioning, depending on the view and perception of the individual.
1.3 Making Biodiesel
As mentioned before, there are various ways of making your own biodiesel, with this option; it has opened up a new industry supplying these markets. There are many companies and organisations that are out there willing to share their knowledge in order to help expand their ideals. Companies such as Bio King, offer a range of products, „recopies‟ and helpful hints to help make your own high quality fuel. In creating your own biodiesel there is quite a few different methods, a basic guide is explained below.
Making biodiesel:
1. The first step is to obtain you ingredients, for this example waste cooking oil, caustic soda, methanol, Isopropyl alcohol and Phenolphthalein-solution (ph indicator) will be used.
3. After titration is completed the next step is to produce a test batch. A test batch usually comprises of one litre of oil, as it is easy to produce. The test batch is produced by heating the oil (one litre) to forty-five degrees Celsius; separately the 220 ml of methanol is mixed with the amount of catalyst determined in the titration (five grams plus one gram for every extra millilitre of catalyst solution added). This mixture called meth oxide is then mixed with the oil and is stirred for approximately fifteen minutes (It should be noted that meth oxide is an extremely dangerous substance and proper precautions should be taken for the safety of all). The mixture is then allowed to rest, after one hour a layer of glycerine should be present on the bottom of the container. The mixture is good if there is a clear dividing line between the glycerine and the diesel, and if the amount of glycerine is approximately ten percent that of the total mixture. If there is less glycerine, more catalyst is probably needed, but if there is a clear layer of soap too much glycerine was probably used and action should be taken to resolve this with a new test batch.
Chapter 1: Introduction November 2007
Page | 6 evaporate, which should happen over one to two days. The biodiesel should now be fairly clear and have the odour of vegetable oil or the original oil that you have used, and should not smell like an alcohol. Another good test is to test the fuels miscibility with water, by adding five hundred millilitres with one cup of water and shaking the mixture, the water and biodiesel should separate, with no layer of soap between the two layers. If soap does form it is a good indication that the fuel has not been washed properly and should be washed again. Also if the fuel does not separate easily it is an indication of a poor quality fuel. If the fuel passes all of these tests, it quite assumable that a high quality fuel has been produced and your biodiesel is now ready for use. 5. Important points to note. When introducing the fuel into an existing fuel system that
has been running on diesel, the fuel should not be used as a straight replacement and should be blended in. One of the good qualities of biodiesel is that it is a good solvent for deposits in the fuel system, which means that it will clean the fuel system as it is being used. This means that the fuel filter will need replacing as the fuel is blended in and the system is purged of these particles. It is also important to know that biodiesel will thicken easier due to lower temperatures compared to diesel. So in colder weather it is advisable to mix biodiesel with diesel to counteract this problem or engine complications such as not starting can result.
The procedure explained above is one of many ways of producing a high quality biodiesel at home, this information was obtained from the Bio King website (www.bioking.nl), but there are many more ways that a high quality fuel can be produced. One of the many differences that can occur in the production of biodiesel is the use of different oils, as many renewable oils can be used.
1.4 Agricultural advantage
approximately fifty percent, allowing oil to be obtained from the grain and used directly for the production of the renewable fuel. This opens an avenue for farmers to not only produce cheaper fuel, but also do it more economically by utilising their own produce to do so. The oil is normally extracted from the grain by means of pressing. This essentially squeezes the oil from the grain, leaving behind the highly nutritious solid material.
There are now machinery specially catered for this very purpose, for example Bio King in the Netherlands sell equipment for pressing and separating the oil from the seed. These units can range from a small capacity of twenty kilograms of seed an hour (Picture shown below):
(Figure 1.1: cold scre w press manufactured by Bio King)
Chapter 1: Introduction November 2007
Page | 8 The other product that is created from the pressing of oilseeds is the solid cake material left from the grain. This product is not a waste product; in fact it adds further value to the use of self produced grain for the production of biodiesel. This cake as it is called is, in many cases, more valuable than that of the original seed. The cake makes an excellent food substitute for animal consumption and some human consumption, as depending on the grain used, it is usually high in nutrients such as protein. This opens an extra avenue for the sale of this cake material to different markets, adding additional income for the process, or used in house, reducing expenditures in other departments. It should be noted that with the extra processing of these materials that there is a higher safety risk associated, and appropriate rules and regulations should be followed in these areas to ensure the health and well being of all affected by the process.
1.5Biodiesel: Things to Know
This overall process shows the attractiveness of adapting the industry from its current dependency on fossil fuels to the self producible biodiesel. There are many benefits listed earlier that can be obtained by each business willing to expand to this process. As one of the large benefits of moving from traditional diesel to biodiesel is the fact that it is a renewable fuel, the effects that the fuel will have on things such as the environment and the equipment that it will be used in should also be investigated and noted.
It is also known that not all new car and machinery manufacturers will cover damage on equipment when the car is run on biodiesel. In Australia most manufacturers will allow (with respect to warranty) a blend of five percent or twenty percent biodiesel, but in places such as Europe where stricter standards exist the situation is different. Quite a lot of vehicle manufacturers offer warranty for their product running on one hundred percent biodiesel as long as the fuel meets the EN 14214 which is the proposed European standard (Department of Agriculture and Food). These companies include Audi, BMW, Case-IH, John Deere and Volvo just to name a few. This shows that the leading countries in this newly revived industry are in Europe, probably due to the concentrations of people and the lack of mainland supply of fossil fuels, making the renewable fuels more cost competitive and the realisation of the dim future if the technology is not invested in early enough.
1.6 Biodiesel Production
The absolute leader of commercial biodiesel production is Germany, with a production of 2,262 thousand tonnes, following behind is France with seven hundred and forty three thousand tonnes and Italy with four hundred and forty seven thousand tonnes out of a total four 4,890 thousand tonnes. This figure shows that the three leading countries produce seventy percent of Europe‟s biodiesel, with Germany itself producing forty six percent (European Biodiesel Board, 2006 figures). These figures show an increase of fifty four percent compared to the production of 2005, and have projected production of just over 10,000 thousand tonnes for the year of 2007. The United States of America is a little behind with an estimated 840 thousand tonnes produced in 2006 (Future Fuels, 2007). The difference between the production of Europe and the United States of America shows that both countries are heading in the same direction, but Europe has more dedication and a fair head start compared to the United States of America.
1.7 Topics of Concentration
Chapter 1: Introduction November 2007
Page | 10 photochemical ozone, known more commonly as smog, which is apparent in many cities every day. This gas also leads to increased effects of respiratory problems such as asthma and forms into acid rain due to its formation into nitric acid when present with moisture in the air. This is why it is important to understand the affect that the fuel will have on this particular matter, especially with the increasing problem of global warming. The other specific parameter that will be focused on will be the affect of using biodiesel in an engine and the related change in transient heat flux generated by the fuel. The change in heat flux is important in an engine due the affects that it will have on its components and combustion process. As the heat flux is increased or decreased, the auxiliary systems such as its cooling system will have more or less to do, which will affect the overall performance of the engine. The formation of combustion emissions is also heavily related to temperature, giving higher reason to predict the transient heat flux accurately.
Through this dissertation it is planned to develop a model in order to simulate the formation of the oxides of nitrogen dependent on the type of fuel. With this model the change in engine parameters such as the compression ratio and injection timing and investigate the predicted effects from the change in these parameters. Is also planned to develop a model to simulate the amount of transient heat flux, and investigate the affect when the mentioned engine parameters are altered and investigate the optimum combinations.
Chapter 2: Literature Review:
2.1
Biodiesel in AustraliaThis dissertation is going to analyse the use of biodiesel in the agricultural industry, focusing on its benefits in singular applications, rather than the broader affects. This will be done by focusing on its compatibility when used in stationary diesel engines. Focusing on singular applications means that analysis will be carried out based on typical stationary engine applications and evaluating the expected theoretical performance. The evaluation of performance will be carried out by comparing the engine running on biodiesel as to conventional fossil fuel based diesel. The specific performance parameters that will be evaluated will be the transient heat flux during combustion, as well as the formation of NOx
for each fuel.
As Australia has a large agricultural industry and approximately sixty percent of Australia‟s land mass is devoted to agriculture (ABARE, 2006), so if there is an advantage of using biodiesel, large benefits stand to be gained from moving from the conventional diesel to the alternative biodiesel. Every agricultural company in Australia that uses internal combustion engines would have at least a small amount of these consisting of diesel engines, either be it for machinery, pumping or generating electricity. With the evermore arising problem of global warming, it seems sensible to be trying to converge from more pollutant fossil fuels to greener, more renewable fuels. This means attacking every avenue of usage, to determine the most feasible areas to implement effectively. The agricultural industry is a prime example of these areas.
2.2
Biodiesel Feedstock’sChapter 2: Literature Review November 2007
Page | 12 is important to determine an appropriate grain which has a high oil content, and can be successfully grown in that specific area of Australia. The following figure (Figure 2.1) shows oilseeds that were part of research program carried out by the Department of Agriculture and Food in Western Australia do determine the effectiveness of such species for the use in biodiesel production.
(Table 2.1: Oil seeds studied by Department of Agriculture and Food, 2001)
There was also further research recommended for the oilseeds listed in Figure 2.2, which were identified as possible candidates for oil production, after the preliminary research had been completed on the oilseeds mentioned above, to determine their effectiveness in the dry environment of Western Australia.
(Table 2.2: Recommended candidates for oilseed production by Department of Agriculture and Food, Western Australia, 2001.)
canola plant also fixes nitrogen into the soil, giving the wheat crop an advantage as it relies heavily on nitrogen to grow (Martin, P, Biodiesel Association of Australia Inc).
As biodiesel is made from organic oil that is able to be extracted from a grain, this also poses an advantage to the singular farmer to recoup costs, making the farm more viable. By this, it is realised that the farmer has the opportunity to make their own fuel for their private use. In this day and age, it is well proven that making your own fuel is a viable and a cost-effective option, one only has to Google the term “Make your own biodiesel” and there are many companies and organisations willing to send you in the right direction and set you up with the equipment required, or give you plans to create what you need to produce your own high quality fuel. Also, with the correct process of extracting the oil, the value of the grain may also be conserved. By extracting the oil using a screw press or similar machine, a good amount of the oil can be extracted. Once the oil is extracted from the grain, the meal that is left over can be made into a cake. This cake is a small pellet shape piece of compressed grain; with the nutritional value extremely high for feed. This cake can then be sold for feed for animals, with the value of the cake being higher than that of the original grain itself. This then means that there is little or no profit lost for a farmer using their own grain for producing their own fuel.
2.3
Classification and ProductionChapter 2: Literature Review November 2007
Page | 14 suitable for the reaction; however both catalysts can be used for methanol (ESRU, Biodiesel production).
There are many reasons that biodiesel is becoming more popular and understood throughout the world. One that hits closest to home for many people is the ever rising cost of fossil fuels. In the recent years fuel prices have been on the rise, with no indication that this trend is not going to continue. This is mainly due to the slowly declining production of oil from our natural reserves. This means two things, first is that the problem of fuel cost from fossil fuels is only going to increase, and secondly that we are running out of supplies, giving reason to develop new technologies into the production of fuel sources that can replace our dependency on fossil fuels. In Europe, the total biodiesel production for 2006 was 4.89 million tonnes with Germany producing 2.662 million tonnes and France producing 743 thousand tonnes (EBB, 2007). These quantities are an increase of 54 % over the previous year‟s production, showing an increasing trend from previous years in Europe. This shows that there is a large industry in place in Europe and still growing. Another reason that biodiesel is becoming more popular is the environmental benefits. This day and age, society is heavily concentrated on the effects to our environment due to the increasing affects of global warming.
2.4
Oxides of NitrogenThere is a high magnitude of information available on the affects of running biodiesel instead of conventional diesel with regards to emissions. Some of this information states conflicting results if unread carefully, as it is clear that each different test condition gives different results, which would be expected for most experimentation. In this dissertation, it is hopeful to gain a better understanding of results with variance to these conditions. As mentioned above, the two main parameters that will be focused on are the transient heat flux and the NOx production from the two different fuels. The first parameter that will be discussed is the
NOx. NOx is a molecule containing one atom of Nitrogen and multiple atoms of oxygen.
NOx is classed as a pollutant due to the effect it causes when in the atmosphere. The main
problems with this pollutant is that it contributes to the formation of photochemical ozone, more commonly known as smog, it also impairs visibility and causes respiratory problems due to its formation into nitric acid when in contact with ammonia and moisture. NOx is also
the ph of the water, making it dangerous for the organisms that grow in and use this supply. NOx also contributes to global warming by changing into the gas nitrous oxide (N2O) which
is a well known greenhouse gas known for getting trapped in the upper atmosphere, contributing to global warming (U.S.EPA 2007).
NOx is formation is dependent on many factors. The most prominent factors to affect the
NOx formation is the combustion temperature and injection timing, which in turn are both
related together. There are many factors which affect the temperature of the combustion gases, which in turn affect the formation NOx. The main factors that will be focused on are
the chemical composition of the fuel, fuel to air ratio, compression ratio and the injection timing. These are important factors to consider due to the variation between different engines that are in use in the real world. As biodiesel is made from an alternative base oil, there is an expected and proven difference in the chemical composition of the fuel. A key indicator for the temperature of combustion is the adiabatic flame temperature. The adiabatic flame temperature is “the temperature of the products in the absence of heat transfer from the flow” (Energy Technology study book, 2007). Where the products described are the combustion products from the chemical reaction. In the determination of the adiabatic flame temperature of any fuel, the enthalpy of the reactants has to be equivalent to the enthalpy of the combustion products. Due to conservation of mass, the amount of atoms in the reactants has to be equal to that of the products; this therefore means that the composition of the fuel is a major determinant of the composition of the exhaust gases (products). This means that each fuel will have a different adiabatic flame temperature, hence affecting the formation of NOx.
The fuel to air ratio is also important for much the same reason described above. As the fuel to air ratio is altered, the amount of atoms in the fuel compared to that of the air is changed, this then causes a change in the enthalpy of the reactants and hence also the products, altering the adiabatic flame temperature and therefore the NOx formation. Compression ratio is also
another important factor that affects the formation of NOx.
Chapter 2: Literature Review November 2007
Page | 16 ignition engine where fuel is mixed with air, prior to being inducted into the cylinder for compression. This means that the engine can have a higher compression as there is no risk of pre-ignition (also known as engine knock) like in the spark ignition engine. In a compression ignition engine, during the very late stages of compression, fuel is injected into the cylinder to create combustion. This is due to the very high temperature of the air in the cylinder, the fuel hits this hot air and combusts, increasing the temperature to create a chain reaction to burn all the fuel. This means that as the compression ratio is altered the temperature of the contents prior to combustion varies, changing the combustion temperature throughout the cycle, which will in turn affect the formation of NOx. Van Gerpen, Tat and Wang developed
a concept map to show the effects of various factors that affect the formation of NOx and are
shown below.
(Figure 2.1: Concept map of NO emission and combustion characteristics, Van Gerpen, Tat and Wang, 2004)
This figure shows the general effect of various fuel Injection parameters and fuel properties on the formation of NOx. As seen it is evident that the above assumptions are correlated with
NOx. It is shown by Ya-fen, Yo-ping and Chang-Tang the affects of engine speed are
specific to mainly high to low engine speed. In this particular case engine speeds from 1400 to 2000 produce relatively consistent values, with traditional diesel having lower concentrations than all biodiesel blends, with a blend of B100 having the highest and B50 the lowest concentrations. At engine speeds of 1200 and 1000, traditional diesel again produced the lowest concentrations, while B20 produced the highest and B50 had the lowest concentrations. These tests were undertaken on a 4 cylinder water cooled diesel with a displacement of 2164cc (torque data unavailable) and a compression ratio of 21.6:1. The oil that was used for these tests were made from waste cooking oil, methanol, sodium hydroxide and was washed with water.
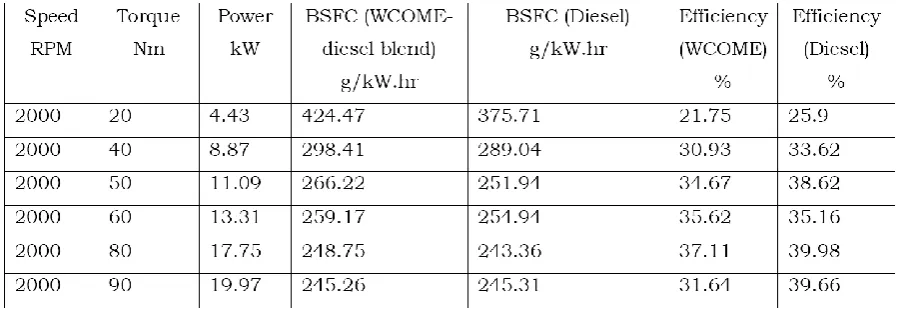
The affects of torque on the formation of NOx has been investigated by comparing a fifty
percent biodiesel blend made from waste cooking oil (palm oil), methanol and sodium hydroxide (Yusaf et al). This experiment was undertaken using a four cylinder direct injection Ford engine with a displacement of 2184cc. The engine was water cooled with a compression ratio of 22.9:1. The test for the exhaust emissions were carried out at a constant engine speed of 2000 rpm and torque gradually increased in increments of 20 from 20Nm to 80Nm and a final reading taken at 90Nm. The results showed that the brake specific fuel consumption of the biodiesel blend was higher from the lower torque settings but evened out for the last reading of 90Nm. The efficiency of the biodiesel was less than that of the traditional diesel from the lower torque settings but evened out at 60Nm and continued to improve on the diesels efficiency up to 90Nm. The emissions were also tested, from a torque of 0 to 120Nm. The fifty percent biodiesel blend showed an improvement in NOx emissions
from 0 to approximately 100Nm, after which the traditional diesel showed a lower emission level of NOx. But in the case of this dissertation, stationary engines are the main focus of this
research therefore the constant speed data will be of more importance to evaluate the effectiveness of the mathematical model being developed to predict the formation of NOx.
It is commonly understood that when using biodiesel rather than traditional diesel, there will be an increase in NOx emissions, but as Van Gerpen, Tat and Wang discovered, engines that
have used a chassis dynamometer for testing have been observed to produce lower NOx
emission levels. In their research they discovered that when the two fuels were compared against their specific start of combustion timing, it was shown that biodiesel NOx emissions
Chapter 2: Literature Review November 2007
Page | 18 pump settings. This advance was then attributed to the difference in the fuels‟ physical properties. This effect seems reasonable as if the fuel is injected earlier, the combustion will start earlier and therefore give a higher in cylinder temperature due to the compression phase still in progress. This is stated in Heywood (1988), where it is explained that
…almost all of the NO is formed during the first 20o
following combustion. As injection
timing is retarded, so the combustion process is retarded; NO formation occurs later, and
concentrations are lower since peak temperatures are lower.
Van Gerpen, Tat and Wang contributed the decrease in NOx emission for the chassis
dynamometer tests to the difference in average engine torque level, as the chassis dynamometer tests tend to have a much lower torque level compared with that of engine dynamometer testing procedures.
In agriculture, there are many different uses for diesel engines, mainly being for machinery, water movement and electricity generation. Two of these require steady speed engine operation, being water movement and electricity generation; the other requires variable speed as well as steady speed engine operation. As this dissertation is based on the performance of stationary engines which in turn correlate to steady speed operation, the parameters that affect a steady speed engine performance will take priority of focus. In summary the key factors that will affect the formation of NOx in stationary engines are the physical properties of the
fuel, the injection timing and the combustion temperature, all of which will be investigated to determine the performance of biodiesel compared to traditional diesel in reference to the formation of NOx.
2.5
Transient heat fluximportant in the design characteristics in an engine. For example, an engine with a high compression ratio and larger cylinder capacity will create greater amounts of heat compared to an engine with a lower compression ratio and smaller cylinder capacity. This means that the cooling system of the larger engine will have to be able to exchange more heat between the surroundings and the engine.
Generation of heat in an engine is the key to maximising and optimising power and efficiency out of the product. It is ideal to predict the heat that an engine will create in order to create auxiliary systems to optimise its performance. By this it is meant that systems such as the cooling system for example should be designed to exchange the optimum amount of heat from the engine in order to keep its components at a desirable level to optimise the performance. For example, if the cooling system is designed so that it removes more heat than the ideal amount, the components of the engine will run cooler, meaning that more heat will be lost out of combustion to warm the cylinder walls and head, also meaning that the water pump has to pump more water, meaning that it will absorb more energy to function, energy that is usually created by the engine, decreasing the amount of power usable out of the engine. This shows that not only the thermal efficiency of the engine will decrease but also the overall power as well. On the other hand if the cooling system is under designed, the temperature of the engine will increase, which may lead to oxidation of the oil lubricant, increasing wear and friction, as well as an increase in engine component temperature leading to increased thermal stresses and component failure. This information is supported in Heywood (1988) where it is explained
…higher heat transfer to the combustion chamber walls will lower the average combustion
gas temperature and pressure, and reduce the work per cycle transferred. Thus specific
power and efficiency are affected by the magnitude of engine heat transfer.
Another factor that is affected by heat flux is emissions. As emission formation is highly dependent on temperature, increasing the temperature of the engine cylinder and exhaust system can cause afterburning of unburnt hydrocarbons and afterburning of CO and higher formation rates and concentrations of NOx.
Chapter 2: Literature Review November 2007
Page | 20 assumption that gas velocities scale with mean piston speed (Heywood, 1988). There are three modes of heat transfer that are important, conduction, convection and radiation. Conduction is the transfer of heat through solids due to molecular motion where a temperature gradient exists. Heat transfer by conduction in an internal combustion engine is through the engine walls, block, cylinder head, piston and from the piston rings to the walls. Convection is important as it transfers heat through fluids to solid surfaces. The predominant heat transfer via convection is from the combustion gasses and the objects it comes in contact with. As the combustion gasses are the source of heat in an internal combustion engine, everything they come in contact will gain large amounts of heat due to the turbulence of the flow and temperature difference. The main components being, the cylinder walls, piston, cylinder head and valve(s), and the exhaust system. Convection is also important on the cooling side of the engine. The heat that is transferred between the engine block to the coolant medium is very important as discussed earlier. Radiation is also an important mode of heat transfer in compression ignition engines. In spark ignition engines, radiation is small in comparison with convective heat transfer, but for compression ignition engines, it can contribute twenty to thirty-five percent of the total heat flux (Heywood, 1988). The source of this radiation is from the highly luminous flame regions and soot particles. In a compression ignition engine, there are many flame regions due to the nature of the design. The flame regions tend to take the shape of the fuel spray then is dispersed by air motion. However, the majority of the irradiative component of the heat transfer is from the soot particles. These soot particles in the engine flame is approximately five times that of the flame regions. Soot particles mainly consist of carbon molecules.
Chapter 3: Methodology
3.1 Oxides of Nitrogen Formulation
The first main technical objective is to understand and model the formation of the greenhouse gases, oxides of nitrogen. This gas has been studied for many years and is well documented for the kinetics of formation. Oxides of nitrogen ( is formed of two predominant species, nitric oxide ( ) and nitrogen dioxide ( ). It is stated in Heywood 1988 that he predominant factor in the oxides of nitrogen is nitric oxide, this therefore means that the study and model will be focused on the formation of that particular species. The source of the nitrogen in this formation is mainly from atmospheric nitrogen, as the fuels produced these days contain insufficient nitrogen contents to warrant consideration, as shown in the chemical compositions where diesels are stated with only carbon and hydrogen atoms and biodiesels with carbon, hydrogen and oxygen. These assumptions then lead to following the general rule, that when combustion of near stoichiometric fuel air mixtures is considered, the principal reactions that govern the formation and destruction of nitric oxide from the molecular (atmospheric) nitrogen are as below:
Chapter 3: Methodology November 2007
Page | 22
Reaction Rate constant cm³/mol.s
Temperature range, K
Uncertainty factor of or %
(1) O + N₂ → NO + N 7.6 x 10¹³ exp [-38,000/T] 2000-5000 2
(-1) N + NO → N₂ + O 1.6 x 10¹³ 300-5000 ± 20% at 300K
2 at 2000-5000K
(2) N + O₂ → NO + O 6.4 x 10⁹ T exp *-3150/T] 300-3000 ± 30% 300-1500K
2 at 3000K
(-2) O + NO → O₂ + N 1.5 x 10⁹ T exp *-19,500/T] 1000-3000 ± 30% at 1000K
2 at 3000K
(3) N + OH → NO + H 4.1 x 10¹³ 300-2500 ± 80%
(-3) H + NO → OH + N 2.0 x 10¹³ exp [-23,650/T] 2200-4500 2
(Table 3.1: rate constants for NO formation (Heywood, 1988))
Where the and are the forward and reverse for their specific reactions. These constants have been developed from numerous experimental studies and the relevant constants taken by Heywood are given in table 3.1. The species enclosed in the [ ] denote concentrations is moles per centimetre cubic when related the given rate constants. By following the process in which (3.4) was developed, the formation of nitrogen can be shown as:
From this it is known that the concentrations of [N] is much less than that of other species of interest, so we can apply the steady state approximation that is set to zero and is used to eliminate [N] in (3.4), therefore giving:
Where:
rise throughout most of the combustion process; this means that contents burned at the start of combustion are compressed to a higher temperature compared to that of when they were combusted. This leads to the conclusion that the NO formation almost always dominates in the post flame regions, compared to the flame front production. From these assumptions it is stated in Heywood 1988
It is, therefore, appropriate to assume that the combustion and NO formation processes are decoupled
and to approximate the concentrations of O, O2, OH, H and N2 by their equilibrium values at the local
pressure and equilibrium temperature.
With these approximations, it is now valid to introduce a new set of variables to aid in the introduction of the equilibrium assumption into the formation equation:
In the above equations denotes equilibrium concentrations, now substituting , , , and for , , , and into (3.6) we obtain:
Chapter 3: Methodology November 2007
Page | 24
Typical values of R₁, R₁/R₂, and R₁/(R₂ + R₃)* Equivalence
ratio R₁** R₁/R₂ R₁/(R₂ + R₃)
0.8 5.8 x 10⁻⁵ 1.2 0.33
1 2.8 x 10⁻⁵ 2.5 0.26
1.2 7.6 x 10⁻⁶ 9.1 0.14
* At 10 atm pressure and 2600K
** Units gmol/cm³.s
(Table 3.2: Typical values for and (Heywood, 1988))
By considering the initial value of when <<1, the strong temperature dependence of the NO formation rate is demonstrated, then from (3.10):
The equilibrium oxygen atom concentration is given by:
Where T is the temperature in Kelvin, is the gas constant and is the equilibrium constant for the reaction,
and is given by
Now by combining equations (3.11) (3.12) and (3.13) with from Table 3.1, we get the following expression for the initial formation rate of NO:
temperature situations result, high nitric oxide formation rates will exist. Also if there are high oxygen concentrations, or a combination of the two, there will be high initial formation rates of NO.
3.2 Characteristic Time Formulation
Also it is important to develop a relationship for the characteristic time for the reaction. This characteristic time is denoted by the symbol , and can be defined for the NO formation process by:
By using the definition for the equilibrium constant for of:
For the reaction of:
By making use of the fact that and combining Equations (3.14)
and 3.15 we obtain:
Where is in seconds and is in atmospheres, also in this equation, use has been made of the fact that . It is stated in Heywood 1988 that “For engine combustion conditions, is usually comparable to or longer than the times characteristic of changes in engine conditions so the process is kinetically controlled.” This meaning that the time it takes for engine conditions to change are typical of the values of . However the characteristic time becomes of the same order of typical combustion times for close to stoichiometric conditions at maximum burned gas temperatures and temperatures, giving the results of equilibrium NO concentrations.
Chapter 3: Methodology November 2007
Page | 26 behind hydrogen-air and propane-air planar flames with axial propagation in a cylindrical bomb. The graph below shows some of the results that were compared from these experiments and predictions made with the kinetic scheme.
(Figure 3.1: Correlation between experimental and theoretical data (Heywood, 1988))
As shown in this figure the correlation between the experimental data and the predictions are excellent. This gives grounds for the analysis to be employed in the analysis of this work with confidence in the accuracy.
3.3 Equilibrium Combustion Products Formulation
The first step to determine the equilibrium combustion products of a combustion process is to determine the species that will be considered. This is done by considering all the species involved and eliminating the irrelevant ones. This process based on the work of Ferguson 1986, where the following equation represents the chemical reaction with the relevant species involved.
By utilising atom balancing we can obtain the following equations:
Where N is the total number moles , now by definition and conservation of mass:
Chapter 3: Methodology November 2007
Page | 28 This method is simpler when considering limited species lists such as the present case as the use of equilibrium constants is the same as maximising the entropy of the gas. The solution of these equations is based on a method developed by Olikara and Borman, as noted in Ferguson 1986. Olikara and Borman have curve fitted the equilibrium constants and derived a formula for their relationship of:
Where T is in Kelvin, and is valid for K, the table below denotes values for their determination and use in the following set of equations:
A B C D E
K₁ 0.432168E + 00 -0.112464E + 05 0.267269E + 01 -0.745744E - 04 0.242484E - 08
K₂ 0.310805E + 00 -0.129540E + 05 0.321779E + 01 -0.738336E - 04 0.344645E - 08
K₃ -0.141784E + 00 -0.213308E + 04 0.853461E + 00 0.355015E - 04 -0.310227E - 08
K₄ 0.150879E - 01 -0.470959E + 04 0.646096E + 00 0.272805E - 05 -0.154444E - 08
K₅ -0.752364E + 00 0.124210E + 05 -0.260286E + 01 0.259556E -03 -0.162687E - 07
K₆ -0.415302E - 02 0.148627E + 05 -0.475746E + 01 0.124699E - 03 -0.900227E - 08
Now by re-evaluating equations (3.18) to (3.21), N can be eliminated by dividing (3.19), (3.20) and (3.21) by (3.18) to give the following equations:
To simplify these equations three ratios were determined, they are:
By substituting equations (3.30) to (3.35) into equations (3.37) to (3.39) we obtain three equations and four unknowns, also using equation (3.22) and substituting equations (3.30) to (3.35), we obtain one more equation, making the system solvable. These four equations ((3.22) and (3.37) to (3.39)) can be represented in the form:
Chapter 3: Methodology November 2007
Page | 30
i Species φ ≤ 1 φ > 1
1 CO2 αεφ αφε - v5
2 H2O βφε/2 0.42 - φε(2α-γ) + v5
3 N2 0.79 + δφε/2 0.79 + δφε/2
4 O2 0.21(1 - φ) 0
5 CO 0 v5
6 H2 0 0.42(φ - 1) - v5
(Table 3.4: Low Temperature Combustion Products, vi (moles/mole of air) (Ferguson, (1988))
Which should result in an estimation close to the solution vector:
By using Taylor series expansion on equation (3.41), we let:
And neglecting second order or higher derivatives we have:
Which solving this set of linear equations will give approximations to . This is done by employing matrix algebra and Gaussian elimination, which then means the second approximation is then:
This second approximation then replaces the first approximation, and the process is repeated until the changes are very small, according to the set tolerance
Where is some specified tolerance. The next step is to define the following partial derivatives:
Chapter 3: Methodology November 2007
Page | 32
Using Gaussian elimination on the matrix equation:
The solution for can be determined for use in equation (3.46). The solution of equations (3.46) through (3.49) is evaluated until the specified tolerance is met. With the mole fractions now known for the individual situation, the mole concentrations can then be determined by using equation (3.18):
Giving:
The concentrations and are then determined by:
Where and are the molecular weights Oxygen and Nitrogen.
With these variables now known, it is possible to evaluate equation (3.14) across a range of temperatures to determine the initial formation rates of nitric oxide. It will then be possible to alter the fuels chemical composition, simulating the change in fuel type and compare the affects of these changes in the equilibrium combustion products and the formation rate of nitric oxide. This will help analyse the first main objective of this project. The second however still needs to be discussed.
3.4 Transient Heat Flux
Chapter 3: Methodology November 2007
Page | 34
3.5 MATLAB Programmes
The model uses five main programmes for the solution of the problem. The model that was donated also comprised of a program to determine the equilibrium combustion products that was the same as the one developed from the theory above, but had an alternate format for synchronising between the four other programmes, this lead to the decision to use this program in order to speed up the formulation of the model. The first program called “airdata” was used to specify the thermodynamic properties of the air and combustion products. The second program “fueldata1” was used to specify the specific properties for the fuel, such as the chemical composition, that was being evaluated in the model. The third program “farg1” is used to determine the enthalpy of the of the combustion reactants incorporating fuel-air residual gas as specified by the user.
The fourth program “ecp1” is used to determine the equilibrium state of combustion products. This program follows the solution of equations (3.46) through (3.49) and yields the solution of the mole fractions of all the species in the combustion products as shown in equation (3.17). The fifth program “Tadiabatic1” ties the above four programmes together in order to gain a solution for the adiabatic flame temperature. It does this by first specifying the user defined properties, these are the fuel type, the compression ratio, fuel to air ratio, and gas residual fraction (fraction of production gasses remaining in the cylinder from the previous engine cycle). The thermodynamic properties of the air and the combustion products are then specified by running “airdata”. The properties such as the enthalpy of the combustion reactants are then determined by running the program “farg1”. With the enthalpy of the recreants known the enthalpy of the products have to be determined iteratively. The program “ecp1” is then run, determining the enthalpy of the products at the specified temperature. If the enthalpies don‟t match, the program will alter the temperature that the combustion products are evaluated and the “ecp1” is run again with this new temperate.
For ease of use, a graphical user interface (GUI) was developed to ease the control the specified inputs for the simulation. All the variable inputs were set to windows for variables to be typed in except the fuel type, as only diesel and biodiesel were to be considered into the simulation. Three graph areas were set up to display the results from the simulation, firstly the initial rate of formation of nitric oxide versus the temperature it was to be evaluated over. The second was the characteristic time for the formation displayed over the evaluated temperature range. Lastly the adiabatic flame temperature was shown against the equivalence ratio that is set by the user. This interface makes it easier for analysis when the user is unfamiliar with the programming logic of MATLAB, and simplifies the process to change the variable in the simulation. The figure below shows the layout of the graphical user interface.
(Figure 3.2: Graphical User Interface developed for this simulation)
Chapter 4: Results and Discussion November 2007
Page | 36
Chapter 4: Results and Discussion
4.1 Results of Oxides of Nitrogen Analysis
The first set of results that will be analysed will be the formation rates of oxides of nitrogen.
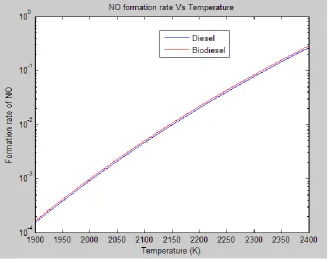
(Figure 4.1: Formation rate of NO, Diesel Vs Biodiesel)
[image:46.595.135.464.198.461.2](Figure 4.2: Effect of gas residual fraction - Biodiesel fuel)
By evaluating the formation rate of NO of biodiesel with varying gas residual fractions (f), it is visible that the change in the formation rate is negligible. As visible in the left hand graph of figure 4.2, there is no possible distinction between the formation rate and the different residual fraction. By zooming in on one section (shown in right hand graph in figure 4.2) the higher residual gas fraction, the higher formation rate of nitric oxide, but this increase can be ignored due to the minuscule difference. As this effect is neglected, the next characteristic that can alter the combustion products is equivalence ratio. By varying the equivalence ratio, the amount of fuel to air is altered, altering the chemical composition of the combustion reactants. The following figure displays the change in formation rate of nitric oxide with the change in equivalence ratio.
Chapter 4: Results and Discussion November 2007
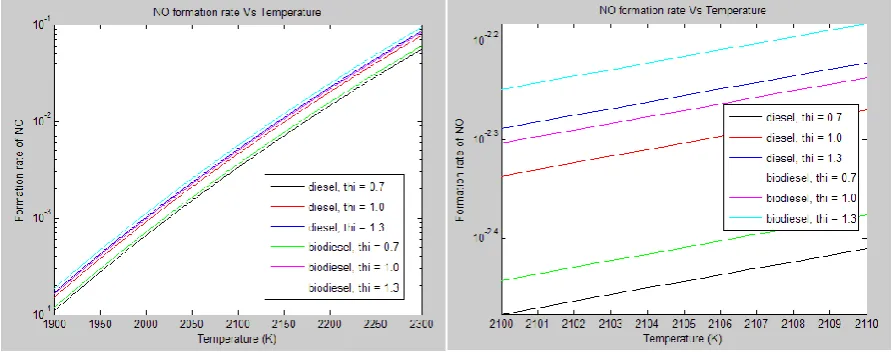
Page | 38 This figure is generated with a compression ratio of twenty, gas residual fraction of .05 (5%) and biodiesel as the fuel type. The graph has been concentrated over a temperature range of fifty Kelvin. The graph shows that with a with lean mixtures (thi less than one), the initial formation rates of nitric oxide are lower for values further from the stoichiometric value (thi equal to one). With mixtures that are rich (thi greater than one) the greater the richness, the greater the formation rate of nitric oxide. It also shows that for leaner mixtures, the change in formation rate over the change in equivalence ratio is greater than that for richer mixtures; this is visible by the distance between the lines. The rich mixtures are closer together, especially for mixtures equal to 1.3 and 1.2 which has negligible difference, but the lean mixtures have a very visible difference (thi = 0.7, 0.8, 0.9). Comparing the two fuels together with a different equivalence ratio gives the relationship shown below.
[image:48.595.75.522.310.486.2](Figure 4.4: Comparison between diesel and biodiesel with different equivalence ratio)
4.2 Results of Characteristic Time Analysis
From the results that have been obtained and discussed above, it is clear that from the solution of equation (3.14), there are clear differences between diesel and biodiesel. The first is that keeping all the engine parameters that are variable in this model the same, biodiesel will result in a high initial formation rate of nitric oxide compared to diesel. The second is that if the gas residual fraction is increased the model shows an increase in the formation rates, but it is so small so it could be neglected. The third is that a higher equivalence ration gives a high initial formation rate of nitric oxide for both biodiesel and diesel. But keeping in mind the first outcome, biodiesel will result in a higher formation rate across the range. The fourth is that when increasing the equivalence ratio by the same increment for rich mixtures and lean mixtures, the lean mixtures will give a greater increase (or decrease depending on the direction of the change) in formation rate of nitric oxide. The next parameter that will be analysed will be the characteristic time. The characteristic time will change as the pressure will change. As the model for the transient heat flux was unable to be completed, the modelled pressure could not be incorporated into this equation. With this limitation, the isentropic compression pressure was used to estimate the cylinder pressure and therefore the characteristic time. The graph below represents the solution of equation (3.16).
Chapter 4: Results and Discussion November 2007
[image:50.595.133.464.481.740.2]Page | 40 Figure 4.5 shows the effect of varying the compression ratio for the characteristic time. As the characteristic time is a good representation of the time it takes for engine conditions to change, it is important to understand how the cylinder temperature will affect this parameter. This graph shows that as the compression ratio is increased the characteristic time increases proportionally, as the equation is an exponential equation the higher the input variable, the greater the output variable will be. As shown in this figure, the higher temperatures result in much higher characteristic times, therefore meaning that as the cylinder temperatures increase, it will take longer for the engine conditions to change, giving longer amounts of time for the formation of nitric oxide to take place. This therefore means that the fuel that generates higher in cylinder as well as exhaust temperatures will generate higher amounts of nitric oxide. As mentioned above, as the compression ratio is increased, the pressure in the cylinder will increase, giving higher characteristic times, and longer for the reactions to occur, creating more nitric oxide emissions.
4.3 Results of Adiabatic Time Analysis
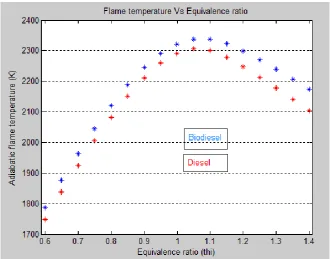
This also means that it is important to determine the parameters that will affect the temperature of the cylinder contents, one such parameter is the equivalence ratio, which can be related to the adiabatic flame temperature for each mixture as shown in the figure (4.6) below.
Figure 4.6 was produced with a residual gas fraction of .05, and by altering the equivalence ratio for both diesel and biodiesel fuels. From this graph, it is easily noticeable that biodiesel results in a higher adiabatic flame temperature for all equivalence ratios considered. As a stoichiometric fuel-air mixture has an equivalence ratio of one, it is seen that fuel-air mixtures greater than stoichiometric (rich mixtures) tend to have greater flame temperatures compared to their counterparts that have mixtures lower than stoichiometric (lean mixtures). This indicates that mixtures that are rich will have higher formation rates of oxides of nitrogen. This graph also shows that the adiabatic flame temperatures for the same equivalence ratios are closer to together for leaner mixtures, and are further apart for richer mixtures. This indicates that that the difference between the formation rates of oxides of nitrogen will be greater for richer mixtures than in leaner mixtures.
4.4 Findings from Simulation
From the results that have been obtained from the simulation, quite a few relationships can be determined for both fuels.
1. With the same conditions such as equivalence ratio and residual gas fraction, the initial formation rate for nitric oxide will be greater for biodiesel compared to diesel. 2. There is negligible change in nitric oxide formation rates as the residual gas fraction is
changed.
3. Higher equivalence ratios give slightly higher formation rates of nitric oxide.
4. As the compression ratio is increased, the characteristic time also increases, giving lengthier times for the oxides of nitrogen to form.
5. Adiabatic flame temperatures are higher across all equivalence ratios investigated. 6. Adiabatic flame temperatures are greater for rich mixtures compared to lean mixtures. One factor that was planned to investigate was the injection timing, unfortunately as the transient heat flux model was not completed; this factor could not be investigated using the simulation. It is important however to link the results that have been found to evidence to support these findings.
4.5 External Experimental Results: Emissions
Chapter 4: Results and Discussion November 2007
Page | 42 Heywood, 1988, that “As injection timing is retarded, so the combustion process is retarded; NO formation occurs later, and concentrations are lower since peak temperatures are lower.” This leads to conclusion that if the reverse were to occur, as to say the injection timing is advanced, the combustion process will also advance, causing higher peak temperatures and pressures which will lead to increased nitric oxide concentrations. As found in experimental work, with the natural advance in injection, there is a high possibility in increasing oxides of nitrogen concentrations with a change in fuel. It is also known that biodiesel has a higher cetane number compared to conventional diesel. As stated in Van Gerpen, Tat and Wang “Shorter ignition delay advances the start of combustion and the ignition delay time is mostly affected by the fuel‟s cetane number.” This also leads to the conclusion that the use of biodiesel will result in an advance in combustion timing due to the higher cetane number. This means that biodiesel has two factors that will advance the combustion timing, leading to a much higher probability of an increase in oxides of nitrogen. It is also stated in Heywood, 1988, that “The 20 degrees after the start of combustion is the critical time period…almost all of the NO forms within the 20o following the start of combustion.” This draws the conclusion that the injection timing and combustion timing are critical in controlling the formation of oxides of nitrogen. Retarding the injection timing to counteract the effects of decreased ignition delay and advanced injection timing is a key step in correcting the ignition timing back to its designed value in every engine. Doing this will result in an equal ignition timing, decreasing the in cylinder temperatures and pressures, therefore decreasing the formation of oxides of nitrogen, making it possible for biodiesel to produce similar, if not lower values of oxides of nitrogen emissions.
As shown in figure 4.1, the simulation shows an increase in the formation rates of nitric oxide, there was no relevant data available to support the increase in formation rates in the same has been evaluated here. The only supporting evidence is that it was based on equation 3.14, also derived in Heywood, 1988, for the initial formation rate of nitric oxide. Comparison between the simulated results for the effect of increasing residual gas fraction and the theoretical relationship can also be made from making reference to Heywood. It is noted that an increase in diluents (such as exhaust gas residue) can effectively reduce the nitric oxide formation rate and hence the production of oxides of nitrogen. This is achieved by reducing the burnt gas temperatures in the combustion mixture. It should be noted that other diluents can be used to achieve this effect (such as N2 and CO2). The use of exhaust gas
the cylinder from the previous engine cycle. Figure 4.2 shows that for the same temperature, a higher residual gas fraction will result in a higher formation rate of nitric oxide, but as the temperature will decrease from the increase in diluents, the formation rate will be less for the equivalent situation. Figure 4.2 shows that with a drop in temperature of only one degree Kelvin or less for a concentration of five percent residual gas, the formation rate will be at worst equal, and will decrease from there, showing promising support to the evidence provided by Heywood.
From the work presented in this chapter, there has been moderate experimental work carried out on the performance of biodiesel compared to the traditional diesel. Firstly, the experimental data for emissions will be concentrated. Figure 4.7 shows the relationship between engine torque and the production of oxides of nitrogen in parts per million, as carried out by Yusaf et al.
This experiment was carried out on a 2.2 litre ford diesel engine running two fuels, conventional diesel and fifty percent blend of conventional diesel with fifty percent biodiesel made from waste cooking oil (palm oil) methyl ester. In this experiment, the engine torque level was varied to determine the corresponding effects on different parameters.
(Figure 4.7: Effect of torque on NOx emissions using diesel and waste cooking oil biodiesel blend (Yusaf et al))
Chapter 4: Results and Discussion November 2007
Page | 44 at a load just under one hundred Newton-metres, after which the biodiesel blend has increased oxides of nitrogen emissions. This information does not directly support the results that have been discussed so far, as it has been generally understood and modelled that formation rates of oxides of nitrogen will be higher or biodiesel blends. The higher torque loading values, where the biodiesel blend has higher emission levels, do support the results that have been found. It should be noted that the model that was used to simulate the production of oxides of nitrogen did not utilise the affect of engine load, so this model does not necessarily contradict experimental results, as the model is relatively simple and should be improved to include such factors. This improvement is not possible however in the length of time that was available for the production of this dissertation. It should also be noted that production of oxides of nitrogen is also present in the exhaust system of the engine, so therefore the overall production of the oxides of nitrogen are heavily dependent on the design of the particular engine and exhaust system.
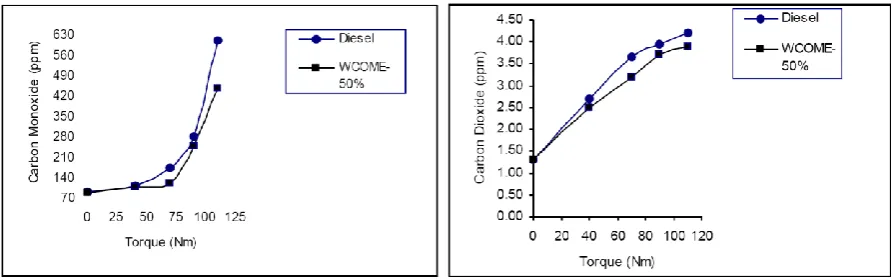
For the purpose of this dissertation to optimise the performance of a biodiesel stationary engine, other pollutants produced by internal combustion engines should also be analysed. The figure below (figure 4.8) shows the results of varying torque on the production of carbon monoxide and carbon dioxide.
[image:54.595.75.523.443.583.2](Figure 4.8: Carbon Monoxide and Carbon dioxide production levels (Yusaf et al.))