Tidal Inlet Function: Field Evidence and Numerical Simulation in the India Project
Author(s): J. J. Williams, B. A. O'Connor, S. M. Arens, S. Abadie, P. Bell, Y. Balouin, J. H. Van
Boxel, A. J. Do Carmo, M. Davidson, O. Ferreira, M. Heron, H. Howa, Z. Hughes, L. M.
Kaczmarek, H. Kim, B. Morris, J. Nicholson, S. Pan, P. Salles, A. Silva, J. Smith, C. Soares, A.
Vila-Concejo
Source: Journal of Coastal Research, Vol. 19, No. 1 (Winter, 2003), pp. 189-211
Published by: Allen Press
Stable URL:
http://www.jstor.org/stable/4299157
Accessed: 16/06/2009 22:24
Your use of the JSTOR archive indicates your acceptance of JSTOR's Terms and Conditions of Use, available at
http://www.jstor.org/page/info/about/policies/terms.jsp
. JSTOR's Terms and Conditions of Use provides, in part, that unless
you have obtained prior permission, you may not download an entire issue of a journal or multiple copies of articles, and you
may use content in the JSTOR archive only for your personal, non-commercial use.
Please contact the publisher regarding any further use of this work. Publisher contact information may be obtained at
http://www.jstor.org/action/showPublisher?publisherCode=acg
.
Each copy of any part of a JSTOR transmission must contain the same copyright notice that appears on the screen or printed
page of such transmission.
JSTOR is a not-for-profit organization founded in 1995 to build trusted digital archives for scholarship. We work with the
scholarly community to preserve their work and the materials they rely upon, and to build a common research platform that
promotes the discovery and use of these resources. For more information about JSTOR, please contact [email protected].
Allen Press is collaborating with JSTOR to digitize, preserve and extend access to Journal of Coastal
Research.
I
Journal
of
Coastal
Research 19 1 1 1 189-211 West
Palm
Beach,
Florida Winter
2003
Tidal Inlet Function: Field Evidence and Numerical
Simulation in the INDIA Project
J.J.
Williams1, B.A.
O'Connor2,S.M.
Arens3,S. Abadie4, P. Bell1, Y.
Balouin5,J.H. Van Boxel3, A.J. Do Carmo6,
M. Davidson7, O.
Ferreira8,M. Heron9, H. Howa5, Z. Hughes10, L.M. Kaczmarek11, H.
Kim12,B. Morris7, J.
Nicholson2, S. Pan2,
P.
Salles13,
A.
Silva14,
J.
Smith15, C. Soares16 and A. Vila-Concejo8
,p p www ww w w
~ij.
ABSTRACTI
WILLIAMS, J.J.; O'CONNOR, B.A.; ARENS, S.M.; ABADIE, S.; BELL, P.; BALOUIN, Y.; VAN BOXEL, J.H.; DO CARMO, A.J.; DAVIDSON, M.; FERREIRA, O.; HERON, M.; HOWA, H.; HUGHES, Z.; KACZMAREK, L.M.; KIM, H.; MORRIS, B.; NICHOLSON, J.; PAN, S.; SALLES, P.; SILVA, A.; SMITH, J.; SOARES, C., and VILA-CONCEJO, A., 2003. Tidal inlet function: field evidence and numerical simulation in the INDIA project. Journal of Coastal Re- search, 19(1), 189-211. West Palm Beach (Florida), ISSN 0749-0208.
In recognition of the environmentally sensitive nature of inlets and of a requirement to improve present knowledge of their function, the INDIA project has studied a small natural tidal inlet located in the Rifa Formosa, Algarve, Portugal. The project has used state-of-the-art field equipment to study present day processes, and a range of nu- merical models to extend the spatial and temporal range of the measurements. Underpinned by knowledge of inlet evolution over several years, and by knowledge of other inlet systems, a conceptual model describing the medium- to long-term evolution of the inlet is presented. Key elements of the model are then examined with reference to field observations and to numerical simulations of tides, waves, sediments and morphology. Supported by historical evi- dence of inlet evolution in the Ria Formosa, the picture that emerges of inlet dynamics is essentially one of relative simplicity and predictability in the short- to medium-term.
ADDITIONAL INDEX WORDS: Inlet dynamics, Ria Formosa, Algarve, Portugal, inlet evolution, erosion, migration.
INTRODUCTION
Tidal inlets and barrier islands occupying some 12% of the world's coastlines are amongst the most dynamic coastal fea-
00158 received 9 June 2001; accepted in revision 12 June 2002. 1 Proudman Oceanographic Laboratory, Bidston Hill, Prenton, CH43 7RA, UK.
2
Department of Civil Engineering, Liverpool University, Brown- low Street, Liverpool, L69 3BX, UK.
31Landscape and Environmental Research Group, University of
Amsterdam, Nienw Prinsengracht 130, Amsterdam, Netherlands.
4 Laboratoire de Sciences Appliqu6es au Genie Civil, 1, All6e du
Parc Montory, 64600 Anglet, France. S
Universite Bordeaux, Department de Geologie et Oceanographie, Avenue des Facultes, 33 405 Talence CEDEX, France.
6 Instituto do Mar, Department of Civil Engineering, University of
Coimbra, Largo D Dinez, Coimbra, Portugal.
7Institute of Marine Studies, University of Plymouth, Drake Cir-
cus, Plymouth, P14 8AA, UK.
8 Universidade do Algarve, Campus de Gambelas, Faro, Algarve,
Portugal.
9 Department of Physics, James Cook University of North Queens- land, Townsville 4810, Queensland, Australia.
1o School of Ocean and Earth Science, Southampton Oceanography Centre, European Way, Southampton, SO14 3ZH, UK.
11 Institute of Hydroengineering of the Polish Academy of Sciences (IHE) 7 Koicierska, 80-953 Gdansk, Poland.
12 Department of Civil and Environmental Engineering, Kookmin
University, 861-1, Chungung-Dong, Sungbook-Goo, Seoul, Korea.
13 Department of Geology & Geophysics, Woods Hole Oceano-
graphic Institution, 360 Woods Hole Rd., MS39, USA.
14 Hidromod, Lda. Taguspark, Nuicleo Central, 349, 2780-920 Oeir-
as, Portugal.
15 Department of Electrical Engineering and Electronics, Univer-
sity of Liverpool, Liverpool, L69 3GJ, UK.
16 Instituto Hidrogrifico, Divisdo de Oceanografia, Rua de Trinas
49, 1200 Lisboa, Portugal.
tures and have been the subject of many investigations (e.g.
KEULEGAN, 1951; BRUUN, 1978; NUMMEDAL, 1983; SPEER and AUBREY, 1985; PILKEY et al., 1989; STEIJN, 1991; DAVIS,
1994; KOMAR, 1996; MEHTA, 1996 and the US Army Corps of Engineers Inlets Research Programme17, CIRPS). Coastal
erosion in and around tidal inlets due to natural migration, tidal flooding and to storm events is commonly observed and
frequently threatens adjacent communities and industry. Furthermore, inlets frequently connect the sea to sites of In- ternational ecological stature and/or areas of importance to tourism and therefore require careful management to main- tain environmental quality. In total Europe spends around ?150 million annually to offset the coastal erosion problems around inlets and in some European countries, as much as 50% of the total annual budget for sea defences may be al- located to nourishment schemes at inlets (e.g. The Nether- lands). In the USA over $100 million is spent annually simply to dredge some 75 million m3 of sediment from inlet channels. To help prevent erosion and migration, inlets are frequent- ly stabilised artificially using structures, and sediment-by-
passing intervention is often used to restrict the growth of
the ebb shoal and to nourish the downdrift coast and thus
prevent erosion (e.g. WALKER and DUNHAM, 1977). In the
case of a single discharge source, management, although cost- ly, is relatively simple. In multiply inlet systems, changes in the hydrodynamic properties brought about by engineering works at a given inlet may give rise to instability in the sys- tem and may promote morphological change to adjacent in-
17 Further information can be found on the CERP web site at http:
190 Williams et al.
4-5-N,
FranceFormoa No 40 N
1
---
S-
Ria Formos
BFarra ,Novaai
t
L 5to
Figure 1. Location of the Barra Nova, Algarve, Portugal.
lets. In more extreme cases, intervention may lead directly to the opening and/or closure of further inlets. Management strategies for such systems are far more complex and detailed understanding of inlet dynamics is required in order to de- velop effective strategies within prescribed costs.
With these points in mind, the primary goal of the INDIA1s Project (INlet Dynamic Initiative-Algarve) has been to un- derstand the fundamental physical drivers of change at a nat- ural tidal inlet and to develop and assess methodologies to predict the medium- to long-term morphodynamic behaviour. Fieldwork encompassed detailed process studies and wide- area measurements of wave conditions and surface currents. In addition numerical models have examined small-scale hy- drodynamics, sediment transport and bed features and wide- area temporal changes in morphology. Following a descrip- tion of the field site, this overview paper outlines a conceptual model of the inlet which aims to explain key features of inlet behaviour based upon evidence from the present site and from other inlets. The measurement campaigns and numer- ical models are then described before examining the validity of this model using the new information from the INDIA pro- ject.
Field Site
The field site, encompassing the Barra Nova and adjacent beaches is located, in the Ria Formosa, in the Algarve region of southern Portugal (Figure 1). Whilst the origin of the Ria Formosa is still unclear, it is known that the historical land- ward migration of the system conforms to the classical shor- eface transgression model. The barrier islands are main- tained by a supply of sediment derived from erosion of cliffs
to the west and are probably part of a much larger coastal cell extending eastwards along the Spanish coast towards Gi- braltar. Its unusual arcuate shape is attributed primarily to the local morphology of the Algarve shelf which sustains the required pattern of wave refraction to maintain the system. In total, the barrier islands span approximately 50 km of the coastline and extend up to 6 km offshore from the mainland at the widest point. The beaches are reflective to intermedi- ate at the western end of the system and predominately dis- sipative at the eastern end (DIAs et al., 2000). The barrier islands are subject to a meso-tidal regime in the range 2 m to 3.5 m (Granja, 1984) and are characterised by rapid along- shore changes in morphology attributable principally to cy- cles of inlet opening, migration and closure. Bathymetric charts and topographic maps from circa 1700 to the present day indicate that the number of inlets in the Ria Formosa may be increasing over time and inlets themselves are sub- ject to cyclical changes associated with opening, migration and closure. More rapid morphological change in the western part of the system suggests a west to east gradient in hydro- dynamic forcing conditions. Further details of the Ria For- mosa are given by PILKEY et al., (1989) and ANDRADE (1990).
Following examination of several possible field sites in the Ria Formosa, the present research consortium originally chose in 1996 to study the Barra de Sao Luis, the western- most inlet separating the Peninsula do Ancdo and the Ilha da Barreta (Figure 1). Historical evidence indicated strongly that migration of this inlet and accompanying changes in morphology could be reasonably expected within the time- frame of a fieldwork programme lasting two to three months. However, partial closure by natural sedimentation of this in- let required the creation of a new artificial inlet some 3.5 km to the west of the old inlet through the Peninsula do Ancao and thus the new inlet or Barra Nova was created by dredg-
18 See http://pol.ac.uk/India.html
[image:3.612.70.541.72.303.2]Tidal Inlet Function 191
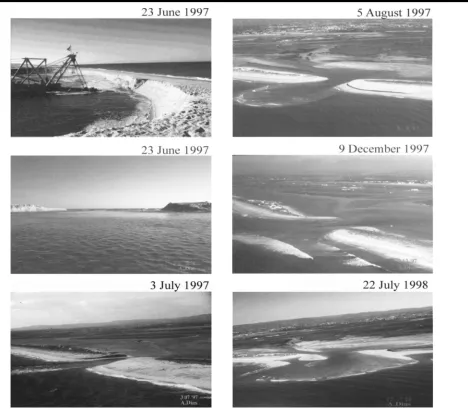
ing in June 1997. Since opening, the evolution of the Barra Nova has been monitored and as anticipated, it was found to quickly naturalise and resemble the old Barra de Sdo Luis both in terms of its hydrodynamic characteristics and its mor- phology by the time the field campaign got underway some 18 months after initial dredging work. The post-dredging de- velopment of the Barra Nova during the period June 1997 to July 1998 is illustrated by a series of photographs in Figure 2. These images show morphological changes occurring in the first year after opening. It is noted that the morphology of the Barra Nova shown in the last photograph in the sequence obtained on 22 July 1998 is very similar in character to the morphology of the inlet in July 2000 and typifies the mor- phology of past inlets at this particular location in the Ria Formosa system.
CONCEPTUAL MODEL OF THE BARRA NOVA
Building upon the pioneering work of BRUUN and GERRIT- SEN (1959) and BRUUN (1966) various authors have proposed conceptual or semi-empirical models that explain inlet func- tion and morphological evolution in terms of wave or tidal flow dominance (e.g. HAYES et al., 1970; OERTEL, 1972;
HAYES, 1980; BOOTHROYD, 1985; GIBEAUT and DAVIES,
1993; FITZGERALD, 1996; FITZGERALD et al., 2000). In other approaches (e.g. KANA and STEVENS, 1992; KANA et al., 1998; ROSATI et al., 1999; ROSATI and KRAUS, 1999), a qualitative conceptual sediment budget model is advocated in order to give a regional perspective on interactions with beach pro- cesses and with offshore bathymetry. In most cases, the mod- els draw upon techniques that evaluate evolution of the ebb shoal and the inlet channel and assimilate evidence of his- torical changes in inlet morphology. Whilst numerical simu- lation of waves and tidal currents in and around inlets is now possible, at present no model is able to predict evolution of inlet morphology in the medium- to long-term in any more than a broad qualitative way and thus a need to consider inlet evolution in conceptual terms remains.
The dynamics of the Barra Nova cannot be considered in isolation from other inlets in the Ria Formosa system. Flood tide inflows through the larger inlets to the east (Figure 1) result in an elevation of water levels inside the lagoon to a height known to be much greater that could be achieve by flow through the Barra Nova alone. As a result, the discharge of water during the ebb tide is both stronger and of greater duration than the proceeding flood tide leading to an asym- metry in discharge. The balance between flood and ebb tide dominance in the Barra Nova and other inlets also depends critically upon the drainage supply and thus the location of the inlet is a critical factor in determining functionality and must be accounted for in the present conceptual model.
The inlet is also known to exhibit the physical character- istics indicative of wave dominance following storm events. Principal among these are a channel depth 0(6 m), an inlet width 0(300 m) and an arcuate ebb shoal located close to the shore (FITZGERALD et al., 2000). The Peninsula do Ancio is a prograding feature owing to the net easterly alongshore sediment transport. Its easterly limit has a smaller cross sec- tional area than the adjacent Ilha de Barreta owing to the
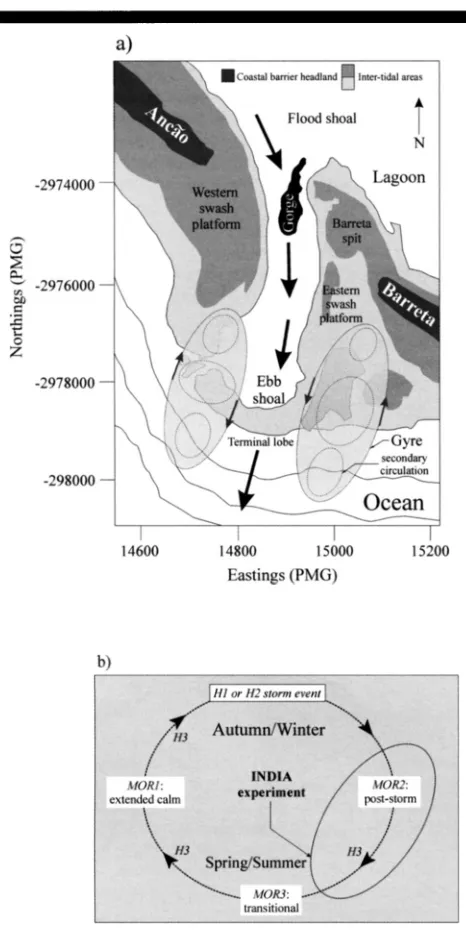
accumulation of aeolian dunes in the past. However, it has been observed that under erosive attack the dry, unconsoli- dated dune deposits of Ilha de Barreta are rapidly under-cut causing an imbalance in the amount of sediment released into the system between the eastern and western sides of the inlet. Taking these characteristics into account the concep- tual model proposed for the Barra Nova considers the status of the inlet as a tidally-dominated or wave-dominated system and encompasses relationships between inlet morphology and the present and/or antecedent hydrodynamic conditions. In the model, reference is made to a number of morphological features defined in Figure 3a.
Using historical meteorological and offshore wave data, and defining wave direction as
4w
and significant wave height and peak wave period offshore as H, and T, respectively, it is possible to identify three hydrodynamic regimes for the Barra Nova. These are: H1, ebb-dominated, fair-weather con- ditions (90' <
w
< 2700, H,. < 1 m, 4s <
Tp
< 10 s); H2, Atlantic storm, flood-dominated conditions (2450 <4w
<2750, H. > 3 m, 8 s <
Tp
< 18 s); and H3, Levante19 storm, flood-dominated conditions (1200 < < 1400,Hs > 3 m, 6 s < Tp < 14 s). It is known that in a normal year20, regime H1 dominates for at least 99% of time with regimes H2 and H3 occurring with varying degrees of severity for 0.6% and 0.4% of the time, respectively (PIRES, 1998). It should be noted also that whilst the low energy, fair-weather regime H1 persists for most of the time, and is characterised by a south-west wave approach, infrequent, weak Levante conditions also oc- cur with rather different consequences for inlet evolution and migration discussed below. Thus here it is necessary to sub- divide H1 conditions between the south-westerly, Atlantic conditions, HIA, occurring approximately 85% of the time in a typical year and the easterly, Levante conditions, H1L oc-
curring for only 15% of the time during a typical year. It is known that in common with other tidal inlet systems, the underlying, first order driver of Barra Nova evolution is related to storm events. In simple terms, a storm forces mor- phological changes so that the inlet moves from an essentially ebb-tidally-dominated condition to a wave-dominated condi- tion. Following passage of the storm, the inlet must then ad- just its morphology back to a configuration determined by the fair-weather hydrodynamics. In responding to storms and subsequently reverting to an ebb-tidally-dominated state, the present model considers that the inlet may widen and/or mi- grate, the channel may realign and the ebb and flood shoals may accrete or erode. These irregular, cyclical changes in morphology form the basis of the present conceptual model.
Following on from the simple outline above, the three hy- drodynamic regimes are proposed to give rise to, and modify, three possible morphological states (MORRIS et al., 2001):
MOR1, an ebb-tidally dominated period characterised by low waves and slow morphological change during an extended pe- riod of calm weather; MOR2, a post-storm, wave-produced
19 Levante is the term used for the strong easterly wind emanating
from the Gibraltar area and affecting the Gulf of Cidiz.
20 Here we refer to average annual wind speed, precipitation, sea
state and storm frequency and intensity observed over a period of 30 years.
192 Williams et al.
23 June 1997
5 Auust 1997
23 June 1997
9 December 1997
3 July 1997
22 July 1998
Figure 2. Aerial photographs showing evolution of the Barra Nova from 23 June 1997 to 22 July 1998.
morphological state following an H2 or H3 event; and MOR3, a transitional state when the inlet morphology adjusts back to the MOR1 condition over a period of time. There is field evidence demonstrating that the length of time this takes is governed by the extent to which inlet morphology was per- turbed from the initial condition by the storm. Present video evidence (see below), and historical meteorological evidence indicate strongly that MOR1 is the dominant morphological state of the Barra Nova under the H1 regime. State MOR2 occurs after one or more storm events with south-west storms having the greatest effect owing to their duration and to the wave approach angle. Whilst the start of the MOR2 state can be clearly defined, identifying unambiguously the end of the MOR2 adjustment period back to the MOR1 state is rather more problematic since the equilibrium condition is never met. Figure 3b shows schematically an annual scenario of hydrodynamic events the corresponding morphological re- sponse. As will be demonstrated later the INDIA fieldwork
occurred whilst the inlet was undergoing transition following a storm event in December 1998. The figure shows also, that during a typical year, each of the hydrodynamic regimes may have a seasonal element, with storms generally occurring during the autumn and winter months, and calm periods oc- curring during the spring and summer.
MORI: EXTENDED CALM
Assuming the Barra Nova has progressed through the transitional state MOR3 to the extended calm state MOR1, in the normally occurring tidally-dominated regime H1A, mor-
phology of the inlet is assumed to be dominated by accretion of sediments in the spits comprising the swash platform and extending from the west shore of the inlet (Figure 3a). It is proposed here that these sediments, originating along the Peninsula do Ancio and transported by wave-induced along- shore currents, are intercepted by the Barra Nova. Following
[image:5.612.82.550.70.480.2]Tidal Inlet Function 193
a)
1
Coastal barrier headland Inter-tidalarea
Flood shoal
N
-2974000-- Lagoon
pspi
-2976000 - m
efon
o
z
-2978000 -Ebb
.... shoal
Terminal
lobe
Gyresecondary
... circulation
-298000 -
..1.c.Ocean.
14600 14800 15000 15200
Eastings (PMG)
b)
HI or H2 storm event
Autumn/Winter
!:H3
INDIA
MORI :MOR2
extended calm experiment post storm
Spring/Summer H3
0R3n .a -.
transitional
Figure 3. Schematic diagrams showing: a) morphological units in the Barra Nova (after BALOUIN and HOWA, 2000b); and b) cyclical changes in the Barra Nova referred to in the conceptual model.
FITZGERALD et al. (2000) it is further assumed that the slow
stacking and coalescence of swash bars in the downdrift di- rection constricts the inlet throat causing an increase in inlet flow velocity. This in turn leads to greater scour and to the establishment of a'new channel cross-sectional area in accord with inlet development described by ESCOFFIER (1940) and SKOU and FREDSOE (1990). Over time, in situations where the channel is not fixed by scour into semi-indurated sedi- ments (historical evidence from Peninsula do Ancdo confirms this assumption), the addition of sand at the updrift side of the inlet will cause the inlet channel to migrate and the en- suing erosion of the eastern shore will then drive inlet mi-
gration in an easterly direction and thereby force a corre- sponding migration of the ebb shoal. As the inlet migrates to the east, the lagoon drainage channels feeding the inlet also shift eastward and, it is postulated, will consume the flood shoal. In some cases the resulting deflection of the channel may reduce hydraulic efficiency, and may cause it to breach the ebb shoal and establish a more direct path to the sea (c.f
FITZGERALD et al. (2000). The old channel position will then
be abandoned as the new channel claims the tidal prism and sediment downdrift of the new channel will be transported shoreward to join the littoral drift on the adjacent beach, thus facilitating bypassing. In regime HIL the eastward migration of the inlet and downdrift accretion of sediment at the end of Peninsula do Ancfo ceases, and the Barra Nova may be forced westward if H1L persist.
A further consequence of flows into and out of the Barra Nova to be encompassed by the conceptual model is the for- mation of gyres by the tidal jet. In particular, the strong ebb tidal flows out of the Barra Nova are deflected to the west by Coriolis force as they travel southwards into the ocean pos- sibly leading to the generation of a large gyre circulating in a clockwise fashion offshore to the west, and to a lesser extent to the east of the thalweg (Figure 3a). In the model it is con- sidered that the resulting circulation has a capacity during spring tides to transport sediment from the inlet channel back towards the shore to be trapped in the ebb shoal and at times on the bars systems of Peninsula do Ancfo, thus con- tributing to processes building the swash platform. During flood tides, the jet is less-well developed. However, there is a sufficiently well-defined inflow to produce a clockwise circu- lating gyre, in this case located to the east of the thalweg (Figure 3a). Smaller gyres will be also generated at locations in the lagoon close to the flood shoal as flood and ebb flow accelerate into and out of the Barra Nova, respectively.
In the absence of storms, the morphological state MOR1, maintained by the low-energy hydrodynamic regime H1 is likely to change only slowly through time. In severe storms it has been observed historically that the inlet has a potential to widen and to migrate rapidly and occupy subsequently a new position some tens or hundreds of metres to the east in the case of regime H2. In the case of regime H3 historical data show that the inlet can widen significantly in a westerly direction. In extreme cases (i.e. the 1 in 100 year event or less frequent), there is even historical evidence from Peninsula do Ancdo showing the formation of a new inlet at a new location to leave two functioning inlets along a relatively short stretch of coastline. Thus in the model it is necessary that waves and currents during storm regimes H2 and H3 act in such a way as to result in significant disturbance to inlet morphology. Thus the extent of the resulting morphological change de- pends primarily upon the magnitude and duration of a storm event, the state of the tide (spring or neap), and upon the sequence of events impacting at the inlet.
MOR2: SOUTH-WEST STORM AND TRANSITION Assuming that the Barra Nova is in morphological state MOR1, the first major effect of a regime H2 storm will be severe erosion to the berm and spits to the west of the thal-
[image:6.612.61.294.61.527.2]194 Williams et al.
weg and to the ebb shoal by westerly storm waves. Enhanced by surge currents and waves, the direction of net sediment transport through the Barra Nova may reverse as sediment derived from strong alongshore transport and from erosion of the berm, spits and ebb shoal is forced through the inlet by wave action. It is assumed that some of this sediment will be accreted onto the flood shoal and some will be transported out of the inlet on the next ebb tide to be accreted on the ebb shoal and on the eastern shore. There is also evidence from aerial photographs that some sediment may also be displaced further into the lagoon by the tidal channels (DIAS et al., 2000). The erosion by storm waves lowers bathymetry and will thereby allow larger and larger waves to penetrate into the inlet causing massive erosion of the eastern side of the channel and the formation of a spit extending into the lagoon. There is evidence also that overwash can make a major con- tribution to sediment transport and to the morphological de- velopment of the inlet. The changes to inlet morphology may be slight or major depending upon the severity and/or dura- tion of the H2 event before the inlet reverts to the post-storm, MOR2 state (Figure 3b).
As the storm abates, fair-weather conditions once again prevail and the inlet enters the transitional state MOR3. Dur- ing this transitional period the western berm and spits once again begin to form. Modifications to the bathymetry in the vicinity of the enlarged flood shoal result in stronger tidal flows and the ensuing erosion of flood shoal supplies sedi- ment to the ebb delta and spit structures on the eastern shore of the inlet. The feed of sediment seawards following the storm will join the alongshore flux on the eastern side of the inlet and thus contribute in part to post-storm beach resto- ration. Following a period of adjustment, the Barra Nova will again approach the original extended calm state MOR1. It also noted that the H2 event also impacts upon the beach of Peninsula do Ancdo causing changes in the beach profile. The adjustment of the beach post-storm will occur at the same time as the inlet enters the MOR2 condition and result in a supply of sediment alongshore greater than would normally be present for a fair-weather beach profile.
MOR2: SOUTH-EAST STORM AND TRANSITION
Again assuming that the Barra Nova is in morphological state MOR1, the storm regime H3 will give rise to wave at- tack from the east and quickly erode the less well developed eastern-most part of the ebb delta thus allowing waves to penetrate quickly into the inlet and to erode the western shore and the associated berm and spit structures. Owing to the low beach profile known to result from inadequate sup- plies of sediment prior to the storm, the end of Ilha de Bar- reta will be subjected to wave attack causing severe erosion. Eroded sediments will then be transported through the inlet by wave action and will be deposited inside the lagoon. Waves penetrating into the inlet across the eroding ebb shoal will then in turn attack the western shore causing erosion and widening of the inlet. However, owing to the short-lived na- ture of Levante storms and the oblique wave incident direc- tion, there is evidence from historical data to indicate that the Levante storms do not have the severe impact on the
Barra Nova morphology of the south-westerly Atlantic storms
(MORRIS et al., 2001). Following a Levante storm, the inlet
morphology will be displaced to the post-storm MOR3 state. Thereafter it will enter the transitional regime MOR2 as slowly the berm and bar systems on the western shore build and erode spits inside the lagoon on the eastern shore. After a period of time, the Barra Nova will once again approaches the MOR1 state as regime H1 conditions re-establish. Again, storm modifications to the updrift beaches will provide a post-storm feed of sediments alongshore towards the inlet at a greater rate than normal.
MEDIUM- TO LONG-TERM EVOLUTION
Present evidence indicates that the morphologic evolution of the Ria Formosa inlets and barrier islands result from pro- cesses operating at three temporal scales: 1) evolution in re- sponse to relative sea-level rise, on a geological time-scale
O(103 years); 2) exposure to different wave and current con- ditions at different locations in the system, on time-scales
O(100 to 102 years), and; 3) the effects of storms and the sub-
sequent adaptation processes, on time scales O(10-1 years). Here we do not consider the geological time-scale since the life-cycle of an inlet on Peninsula do Ancdo is at least one order of magnitude less. Here we consider the present posi- tion of the Barra Nova on Peninsula do Ancdo and the chang- es brought about in the future as the inlet migrates in the normal easterly direction. Firstly, migration of the inlet will lengthen the lagoon drainage pathways and thereby reduce hydraulic efficiency. This will lead directly to a reduction in both tidal flow velocity and volume leaving the inlet on ebb tides. Secondly, owing to the natural curvature of the coast- line toward the east of Peninsula do Ancdo, the wave inci- dence angle will become progressively more acute and lead to an increase in alongshore transport of sediment. Thirdly, the migration and corresponding elongation of the Peninsula do Ancdo will result in a low spit which under storm and/or spring tidal conditions is overwashed. The length of the spit is determined by the migration rate of the inlet and by the rate at which aeolian dunes form on the newly deposited sed- iments. Together, these processes will act to eventually close the inlet at some critical position to the east of the present location.
METHODS
Fieldwork
Following breaching of a coastal barrier, either by natural or artificial means, there are few examples of studies moni- toring inlet development. Dredging to create the Barra Nova thus presented a unique opportunity to investigate in the field the interplay between tidal currents, waves and sedi- ments as the system evolved. The post-dredging development the Barra Nova covering areas of the inlet exposed at low water was monitored by repeated surveys from June 1997 to March 1999. Design of the main field campaign was guided by the questions raised by the conceptual model regarding inlet function and evolution and followed many of the tech- niques used in the past to study tidal inlets (e.g. MANN, 1993;
Tidal Inlet Function 195
a)Bathymetric survey, January 1999
-296500 -(water depths in metres)
Flood shoal
-_-29700() Thalweg
North
0
_Q
to297500
-
Ehb shoal -298000
-298500-
-298500 @ '
9, \ "-
14500 15000 15500
Eastings (PMG)
Water depth (nm)
-296500
0.75 4
-297000 ....
-297500 *0
-2_
-298000
-298500
-8
*
4500 15000 15500
Eastings (PMG)
c) 30 Ancdo and Barreta Barra Nova
20
'10g :
- - - - - -- - -
---- - - - - - - - - - - - - - -
0 1 2 3 4 0 1 2 3 4 Dso (mm)
Figure 4. a) Measured bathymetry at the field site; b) median grain size, Do, for location inside and outside the Barra Nova; and c) spatial vari- ation in and adjacent to the Barra Nova of D5o obtained from analysis of grab samples.
HOWELL, 1996; HICKS and HUME, 1997; STAUBLE, 1998;
PRATT et al., 2000). Detailed bathymetric surveys were ob- tained in January and March, 1999 and in January 2000. Bathymetric data for offshore areas outside the prescribed limits of these surveys were obtained from Portuguese hy- drographic charts. Grab samples of surficial sediments were obtained at 150 locations in the study area and were analysed to determine the -grain size distribution, settling velocity and
CaCO3 content (HUGHES and HUGHES, 2000). These data
were augmented with surficial sediment information derived from published surveys. Figure 4 shows: a) bathymetry in and adjacent to the Barra Nova (January, 1999); b) the me- dian grain size of sediment offshore of Peninsula do Ancao and Ilha da Barreta and inside the Barra Nova; and c) spatial variation in and adjacent to the Barra Nova of median grain
BLISS 37O 10N- PMP
Directional wave buoy
gRCM7/8
x2
37o 00N -
36r59N oofh
>-70
36' 58N
'"_'"___ _...
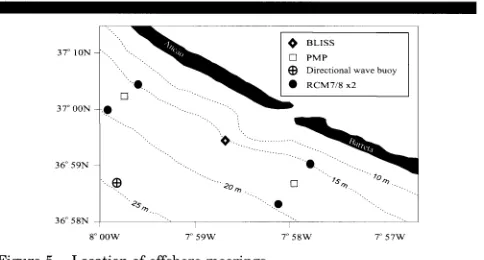
8-0O0W 7 59W 7 58W 7 57W Figure 5. Location of offshore moorings.
size, Do, values. These plots use the Portuguese Melriga Grid based upon a rectilinear UTM co-ordinate system.
Pressure-temperature, PT, sensors were deployed and ver- tical flow profiles were measured over the spring-neap cycle using an ADCP in each inlet of the Ria Formosa. Offshore, measurements of tides, tidal currents, waves, turbulence and suspended sediments were obtained using moored oceano- graphic instruments, HUMPHERY et al. (1999), (Figure 5). Me-
teorological data were measured at locations close to the Bar- ra Nova (ARENS and VAN BOXEL, 2000) and at Faro airport. Wide-area measurements of surface currents and waves a regular grid of points up to 2.0 km offshore from the Barra
Nova were obtained using a VHF radar (HERON and PRYTZ,
2000) and x-band radar (BELL, 1995). Changes in inlet mor- phology were monitored using snapshot, time-lapse and time- stacked video images from a four camera video system in- stalled on the 30 m tower on Ilha da Barreta (MORRIS et al., 2001). In the inlet, a jack-up barge was used to deploy the PIP, a multi-sensor instrument to measure in detail at sev- eral locations hydrodynamic conditions, sediment transport and bed morphology (WILLIAMS et al., 2000). Surveys of the ebb delta and swash platform were undertaken at low water using a small boat equipped with an echo sounder and DGPS and total station survey methods were used to survey, the berm, beach profiles and dunes (BALOUIN and HowA, 2000a). Hydrodynamic measurements were obtained close to the shore using moored instruments and a specially designed in- strumented beach crawler (EVANS et al., 2000). Cross-shore and alongshore sediment transport was measured using fluo- rescent tracer techniques, (HowA and DE RESSEGUIER,
1994). Meteorological towers, sand traps, saltiphones, topo- graphic surveys and erosion pins were used to measure me- teorological conditions (especially vertical wind profiles) and aeolian transport of sand (ARENS and VAN BOXEL, 2000). Further detailed description of the fieldwork may be found in reviews by WILLIAMS et al. (1999). The INDIA field data
set is now available on CD-ROM from BODC21 subject to user restrictions.
21 British Oceanographic Data Centre, Bidston Observatory, Bir-
kenhead, UK: [email protected]
[image:8.612.56.295.62.483.2] [image:8.612.323.565.65.195.2]196 Williams et al.
Numerical Modelling
Physical models of coastal inlets (e.g. HUGHES, 1993; SEA- BERGH, 1999) are unable to simulate accurately sediment transport processes owing to scaling problems and remain of limited use for the study of natural inlet processes or for ex- amining the medium- to long-term morphological change. Here the only viable approach to prediction of inlet evolution is through the use of numerical models (e.g. TANAKA et al., 1995; VAN DER KREEKE, 1996; KRAUS and MILLTELLO, 1999; KRAUs, 1999) to extend the spatial and temporal range of the field observations and thereby allow more general conclu- sions to be drawn regarding inlet function and evolution. Us- ing the measured bathymetry numerical modelling focussed upon hydrodynamics, sediment transport and morphological behaviour. The various models considered tide, wind and wave driven currents; tide, wave and storm surge propaga- tion (esp. asymmetry and over-tides); wave propagation, in- cluding reflection, refraction, shoaling, damping, steepness and depth-limited wave breaking and blocking; secondary flow effects due to wave-current interaction, Coriolis, curva- ture and jets; macro-scale and micro-scale turbulence; cur- rent-related and wave-related sand transport; and the spatial variations in bed sediment properties.
As no single model yet has a capacity to simulate all phys- ical processes, the approach adopted links a number of mod- els, each addressing different features of inlet function and morphology and parameterised with field data. At the largest spatial scale, the US Army Corps of Engineers RMA-2V mod- el was used by SALLES (2000a) to examine multiple inlet
function and stability for the entire Ria Formosa. This model examined: existing non-linear hydrodynamic characteristics (tidal distortion, ebb/flood dominance, residual flow pat- terns); the potential existence of sub-embayments in a coastal lagoon; and the effect of physical disturbances (change in in- let cross-sectional area, inlet migration, inlet closure/open- ing). At a smaller spatial scale spanning the inlet a quasi-3D model (3D-INLET, O'CONNOR et al., 2000b) was used to sim- ulate in detail waves, currents, sediments and morphology (4 km alongshore, 3.5 km cross-shore). Inshore of the Barra Nova, the 3D-INLET model interfaced with a large-area tidal model of the whole Ria Formosa system (LAGOON). At the offshore boundary, 3D-INLET used field measurements of tides and tidal currents. Waves were simulated using the spectral WAM model (e.g. KOMEN et al., 1994; MONBALIU et al., 2000) and input at the outer boundary of 3D-INLET, and thereafter propagated shoreward towards and into the Barra Nova using the spectral SWAN model (BooIJ et al., 1999).
A range of 1DV/2DV hydrodynamic and sediment micro- models were used together with field data to aid understand- ing of processes and to assist with estimation of sediment transport (e.g. JACOB and EQA, 1999; HARRIS and O'CONNOR, 2001, and O'CONNOR et al., 2000a). These provided detailed
inter-wave period views of water column and bed interac- tions, (1D-W/C/S and 1D-SHEET, O'CONNOR, 1992;
O'CONNOR et al., 1992; KACZMAREK and OSTROWSKI, 1999), of water and sediment movement around individual bed- forms, (2D-BED, KIM et al., 1995; JACOB and EQA, 1999), and
of dynamic conditions during the wave breaking process, (2D-
SURF, O'CONNOR et al., 1998c; ABADE et al., 1998). The mod- el 2DH WIBATH was used to study wave, current and bed morphology changes at "frozen tidal states" during typical tides, and SHORECIRC was used to study wave-driven cir- culations (SANCHO et al., 2000). A Boussinesq model (WAC-
UP) was to study intra-wave-period processes in the presence of tidal currents close to the inlet (Do CARMO and SEABRA- SANTOS, 1998). A model of wind flow and aeolian sand trans- port, (2D-AEOLIAN, BOXEL et al., 1999; DIJK et al., 1999),
was used to simulate the effect of sand interchanges by wind action between the beach and dune system and the lagoon using different meteorological scenarios. The Q3D model was run to simulate medium term morphological changes over the period of the field campaign. The other 1D, 2D and 3D nu- merical models were run in order to simulate field conditions and to allow intercomparison between wave-period-average and intra-wave-period results on two standard days: 2 Feb- ruary (a typical spring tide) and 24 February (a typical neap tide), 1999. Micro-modelling of processes has been undertak- en both for these days and for other times during the exper- iment.
RESULTS AND SUPPORTING EVIDENCE FOR THE
CONCEPTUAL MODEL
At the largest spatial scale field measurements and nu- merical modelling examined the functional relationship be- tween the Barra Nova and other inlets in the Ria Formosa
(SALLES, 2000a, 2000b). Initial runs of the model showed the system to be divided in three quasi-independent hydrody- namic cells. Here we briefly summarise some results from simulations focussed upon the western cell of the Ria For- mosa encompassing the inlets Barra Nova, Faro, and Armona in which the inlet cross-sectional areas and forcing conditions were varied. The Faro, Armona and Barra Nova inlets were found to carry 60%, 31% and 9% of the total tidal prism of the western cell of the lagoon, respectively. The closure curve of the Barra Nova showed that the maximum velocity under present conditions was approximately 1.35 m/s. This is ap- proximately in accord with the field measurements and if compared to the widely used equilibrium velocity of 1 m/s
(ESCOFFIER, 1940; BRUUN, 1968; SKOU and FREDSOE, 1990),
indicates that the Barra Nova may still be in a phase of growth. However, according to VILA-CONCEJO et al. (1999) the width of the Barra Nova has now reached a state of rel- ative stability and thus it is suggested that the 'excess' ve- locity may either increase the depth of the inlet, or trigger other processes known to occur in natural inlets, such as en- largement of the ebb tidal delta or inlet migration. In terms of the flow volume the RMA-2V model showed that the re- sponse of the Barra Nova to either an increase or a decrease in cross-sectional area was the same, namely an increase in the seaward residual discharge. On one hand, the tendency to flush more effectively sediment seaward is enhanced as the Barra Nova cross-sectional area decreases from its present value, which can beregarded as a response against closure. On the other hand, as the Barra Nova cross-sectional area increases, the residual discharge increases seaward, but the residual current and maximum velocity (which are also di-
Tidal Inlet Function 197
a) b)
2000 - 2000
-
1750 - 1750-
1500- 1500-
1250
-
1.0m/s1250 -
1000- 100U0-
750-
750o-
500- 500 -
250- " '
i 250- - ""
0 0
0 250 500 750 1000 1250 1500 1750 0 250 500 750 1000 1250 1500 1750
x (m) x (m)
c)d)
2000 -
225.0
200.0 measured,
measured,
z
z= 30cm=
60
cm
1750- - model,
depth-mean
150.0 ____s
125.0
jtoo~o
__
1500 - • 100.0 .
750.0
1250
- ,50.0] ,,E~25.0
00- 06h00 09h00 12ho00 15h00
18hOO 21h00 00h00
125.0 Time, 02/02/99 (GMT)
750- f
1.measuredz=
30cm
100.0 measured, z= 60cm
model, depth-meeA
f 70.0
0, 00 ,•
..,
'
00,2500
E
"•I\- . .,,•vso0
250
-2, 0
0 250 500 750 1000 1250 1500 1750
OhOOO
03h00 O6hO0 09hOO 12hO0 lShO0 18hO0 21bOO OOhO0
x (m) Time, 24/02/99 (GMT)
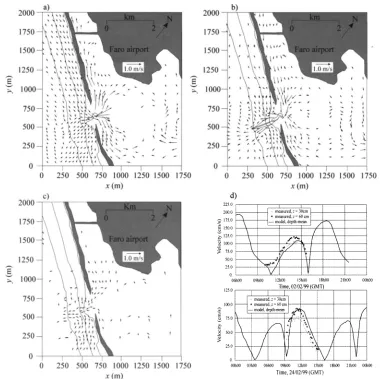
Figure 6. Results from LAGOON model at the Barra Nova: a) flood tide currents, 2/2/99; b) ebb tide currents, 2/2/99; c) residual tidal currents; and d) comparison between LAGOON results and measurements in the Barra Nova channel.
rected seaward) decrease, thus reducing the ebb transport dominance. Therefore, from a tidal hydrodynamic point of view, the RMA-2V model indicates that present width of the Barra Nova appears to sustain an approximately 'stable' con- dition.
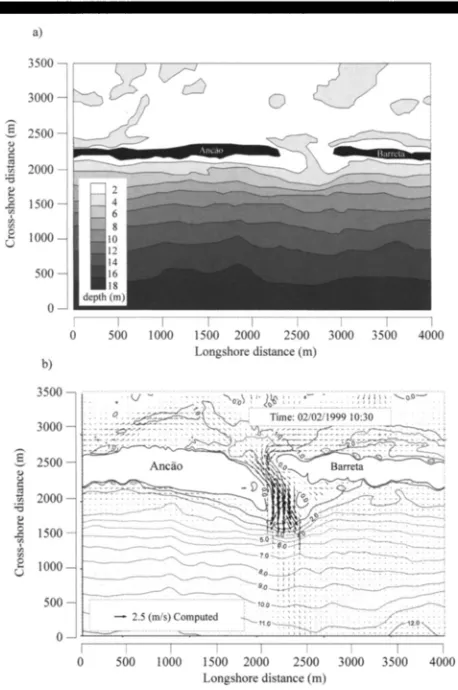
The LAGOON model allowed finer-scale simulation of hy- drodynamic conditions in the Barra Nova. Drawing upon the most recent bathymetric data, historical data sets and field data pertaining to water levels and currents, a fine grid ver- sion of LAGOON (25 m) was used to simulate tidal flows. Selected model output for the flood and ebb tides on 2 Feb- ruary 1999 showing depth-average velocities, U, is presented in Figure 6a and Figure 6b, respectively. Residual water movements are shown in Figure 6c and comparisons between computed U values and U values measured by the PIP are shown in Figure 6d. Figure 6a and Figure 6b show that max- imum U values during flood and ebb tides are in the range 1.0-1.25 m/s and 1.75 to 2.0 m/s, respectively, and demon- strates the ebb dominant nature of the inlet under spring tide
conditions. During neap tides, less tidal distortion is evident (not illustrated) due to reduced phase speeds between high and low water, as well as reduced bed friction. In this case maximum flood velocities are 0(0.6 to 0.7 m/s) whilst ebb velocities are 0(0.85 to 0.9 m/s). The ebb dominant nature of the Barra Nova is further shown by the pattern of residual currents in Figure 6c. Lagoon waters appear to be drawn mainly from the north west with less than 30% coming from the south east. Although Coriolis force will tend to straighten the channel to a more shore-normal orientation as it travels seaward, the strong pull of water from the north western part of the lagoon explains in part why the inlet axis is inclined. This figure also shows the generation of two gyres either side of the main outflow jet. The gyre circulation to the west of the thalweg is enhanced by Coriolis force; thereby reinforcing further hydrodynamics driving swash bar construction at the eastern end of Peninsula do Ancto. The use of the 3D wave- induced current SHORECIRC model for a hypothetical inlet, similar in dimensions to the Barra Nova, showed also that
[image:10.612.119.504.74.453.2]198 Williams et al.
a)
3500
3000o
-
L
2500
+• 2000 ..
1500 - -
1000 --
C2
500-
Q6
0---T
0-
0 500 1000 1500 2000 2500 3000 3500 4000
b)
3500-
. . .
300 me:102>' Time 02/02/99 10:30
500 - --- --- -
0 500 1000 1500 2000 2500 3000 3500 4000
Longshore distance (m) 3
500 -
Aco "$••,o a't
.. . . ... \' ... Time:t o 02/0 ...
1
...99 10 ... ...
3000-
0 --
.-. . ...
15 0
500.. 00..0...0 250.300.500 400
....n gs...o.... ...s...ce..m )
wave action can produce gyres in the absence of tides. These model results thus confirm the ebb-tide dominance at the in- let and show that the tidal flow patterns conform to the con- ceptual model during the H1 condition.
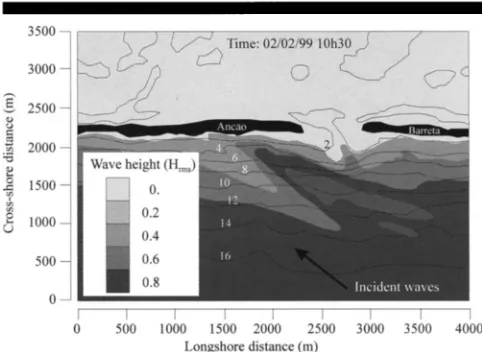
Figure 7a shows the 20 m gridded bathymetry used in the Q3D model. Simulations of ebb and flood tidal currents for 2 February, 1999 shown in Figures 7b and 8a, respectively, in- dicate peak currents 0(2.5) m/s in shallow areas. Again the ebb dominance of the Barra Nova system is demonstrated. Comparisons between predicted and measured water levels and tidal currents in Figures 8b, 9a and 9b show good agree- ment between computed and measured data. To illustrate the effect of depth limitation in the vicinity of the Barra Nova and the blocking effect to wave by the strong outflow during the ebb tide, Figure 10 shows a result from the Q3D model (H, = 1.0 m; T, = 6.0 sec). Field observations confirm this model result.
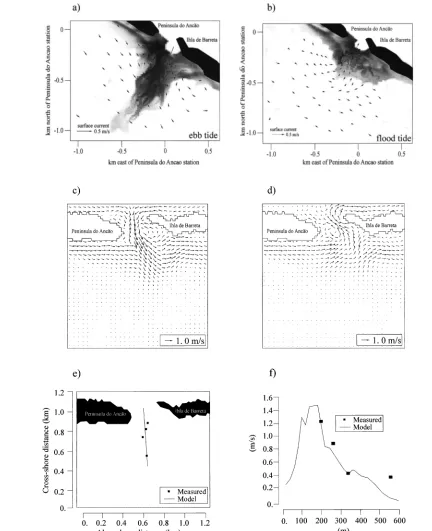
In Figures 11a and 11b COSRAD derived surface current vectors are superimposed upon x-band radar images obtained during the flood and ebb tides on 24 February, 1999, respec- tively. Here the x-band radar images have been processed to show 'rough' areas of the sea surface in dark tones and 'smooth' areas in light tones. The zone of breaking waves,
a) 3500 -
3000 ime: 02/021999 01:00
2500
3000
-
o 1500-
1000-- 1500 .... ... .... ... . ... . z.,,.• . ... ... . . ...
500
-
o
e
500-
. . .
...
. . .
.ii : 1 (m/s) ComputedI
I I I I t ! I
0 500 1000 1500 2000 2500 3000 3500 4000
Longshore distance (inm)
b)
4.0-
Measured (Jackup Barge)
3- - Computed (Q3D)
32.0- \7"
21.5-
1-2.0- •
1.5-
0.0--
0 2 4 6 8 10 12 14 16 18 20 22 24
Hours (02 Feb 1999)
Figure 8. Results from the Q3D model showing: a) simulation of the flood tide, 2/2/99; and b) measured (PIP) and computed water level in the inlet.
defining the outer limits of the ebb delta and the surf zone along adjacent beaches, is clearly visible. In addition, the plume emanating from the Barra Nova during the ebb tide is also clearly defined and supports further COSRAD data and the modelling results. In common with other COSRAD data, Figure 11b also shows some evidence of vorticity to the east of the inlet suggesting the presence of gyre-like circula- tion hypotheses in the conceptual model. Results from the WIBATH model shown in Figures 11c and 11d also demon- strate the presence of gyres in the inlet. Further evidence of this came from the SHORECIRC model. Comparison between measured and predicted current speeds along the section line shown in Figure lle are shown in Figure llf. With the ex- ception of the measurement station furthest offshore there is close agreement between measured and computed values thus verifying modelling results. Further discussion of COS- RAD results is given below.
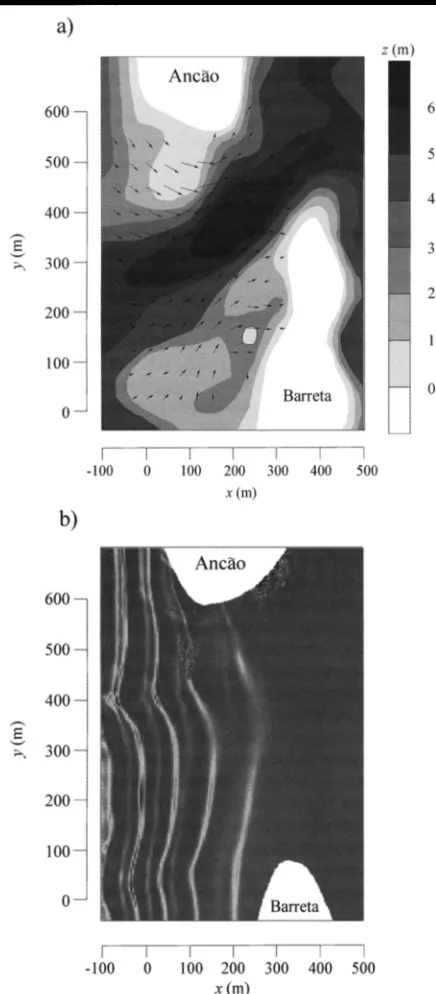
Figure 12 shows: a) bathymetry and the imposed flood-tide current field from LAGOON and b) the resulting surface wave pattern 37.5 s after inputting sinusoidal waves (H = 1.5 m, T = 8s) from the left. These results show that the model has a capacity to simulate the various complex wave refraction, diffraction and reflection effects in the inlet. Re- cently these model results have been compared with field measurements obtained using 77 GHz radar with 0.5 m spa- tial resolution and found to be broadly similar to the observed
[image:11.612.57.286.65.410.2] [image:11.612.331.536.73.368.2]Tidal Inlet Function 199
a)
4.0-o1 01
oMeasured (PT)
-
Computed (Q3D)
3.0--
E
2.5-
>"5"0 1.0-
0.0-
0 2 4 6 8 10 12 14 16 18 20 22 24
Hours (02 Feb 1999)
b)
Measured (Jackup Barge)
Computed (Q3D)
02 I
1
.
l ' /
0.6--
0.4-- l i J i/ !
o -0 2 4 6 8 10 1 14 1 18 2 22 4
Hours0(02 Feb 1999)
Figure 9. Results from the Q3D model showing a) measured (Barra Nova PT sensor) and computed water level; and b) measured (PIP) and computed tidal current speeds.
wave patterns in the inlet and across the ebb shoal. Waves were also studied using the spectral wave model SWAN. Off- shore wave conditions at the outer boundary of the SWAN model were specified by the wide area WAM wave model and currents were imposed from the Q3D model. The spatial dis- tribution of wave energy dissipation for approximately 10h00 GMT on 2/2/99 shown in Figure 13a shows clearly the break- er line and surf zone close to the beaches of Peninsula do Ancdo and Ilha da Barreta and a high dissipation region co- incident with the location of the western swash platform and ebb delta structures. Wave blocking by the ebb current is again demonstrated. Figure 13b shows a processed snapshot image of the wave field obtained at the same time using x- band radar. Here the waves close to the shore steepen before breaking resulting in stronger radar reflection as indicated here by the darker shading. This region is approximately co- incident with the areas of maximum wave dissipation in the SWAN model. Figure 13c shows good agreement between wave vectors computed by the Q3D model and the x-band radar image.
Results from bathymetric and topographic surveys cover- ing the period August 1997 to May 1999 are summarised in Figure 14 which shows: a) a plan view of morphological evo- lution; and b) evolution of the inlet channel profile. In com- mon with other examples (e.g. BENARD and DAVIES, 1999) rapid changes to inlet morphology occurred immediately after opening. In the present case the inlet is shown to widen from some 70 m a few days after dredging and attain a relatively stable width of some 300 m after approximately 12 months. The ebb and flood shoals are constructed seaward and shore-
3500-
3000-
2500-
2000 -/
Wave height (Hms) S
1500- 0. 0.2 1000 -
4
0.4
500 - 0.6 0.8 0-
I I I I I !
0 500 1000 1500 2000 2500 3000 3500 4000 Longshore distance (m)
Figure 10. Results from the Q3D model showing computed wave heights.
ward of the inlet, respectively, and swash platforms are ac- creted on either side of the inlet. Changes to the inlet width shown in Figure 14, through westwards expansion between August 1997 and April 1998, are at odds with most historical trends. However, Levante conditions, with strong easterly winds and high waves were far more prevalent than normal during this period and explain these observations. From April 1998 onwards Figure 14 shows the gradual extension of Pen- insula do Ancdo eastwards and a corresponding erosion of the western shore of Ilha da Barreta.
The morphology evolved in a step-like fashion, with major changes occurring during storm events which caused breach- ing of the ebb delta and erosion of the inlet margins and ad- jacent shorelines as described in the conceptual model. Mor- phological changes occurring during low to moderate energy wave conditions were small by comparison and were manifest by the accretion of spits and bars which slowly deflected the channel eastwards. It is noted also that since opening, the rate at which the Barra Nova width has increased has de- clined at an approximately exponential rate.
The historical development of the Peninsula do Ancdo inlet
reviewed by VILA-CONCEJO et al. (1999) draws on studies by
WEINTHOLTZ (1964), GRANJA (1984), ESAGUY (1986), PILKEY et al. (1989), ANDRADE (1990) and BETTENCOURT (1988,
1994). All authors propose a net eastern migration of the inlet with variable migration rates, Im. These range from 0(50 m/
year), (e.g. PILKEY et al., 1989; BETTENCOURT, 1994), to an extreme value of 0(700 m/year), (GRANJA, 1984). Using a se-
ries of vertical aerial photographs of the Barra de Sdo Luis (Figure 1) from the years 1976, 1985, 1989 and 1996 VILA-
CONCEJO et al., 1999 estimate Im = 53 m/year for the period
1976 to 1985. This increased subsequently to 130 m/year dur- ing the period 1985-1989 before final closure of the inlet circa 1996. This latter value for inlet migration rate is consistent with model predictions for Im using an SPM-type of bulk alongshore transport formula with corrections for grain size
(MUIR-WOOD and FLEMMING, 1981), see also Figure 14c. The model also predicts that storm events have a profound impact
[image:12.612.84.274.64.321.2] [image:12.612.320.561.65.241.2]200 Williams et al.
a)
b)
. 0
-
Peninsula do Anco 0
0-.
Peninsula do Ancao
IhIa de Barreta Ihla de Barreta
-0.5 - -0.5
B
00
surfacecurrents acecrnt
-1.0ebb
tide
-1.0 - 0.5 m/sflood tide
I
I -T -
-1.0 -0.5 0 0.5
-1.0 -0. 5 0 0.5
km east of Peninsula do Ancao station km east of Peninsula do Ancao station
c)
d)
1.---O.--m/s.----.1.-- O m/s- 0...-.
.i((#'
.. . .
> >.
..- l-hia
de Bareeta
Peninsula do
AncPoninsula onPenin adoAc
e) f)
1.2
1.6-
1.
oMeasured
o 1.2 - Model
S0.8
. . . . . . • , \ \ • . . . . . . .. . . . . . . . . . . . . . . .. . .. . . . . . . . .. . . . . ,. , ,. . . . . .. . . . . . . . . . . . . . . . . . . . . . ... . . . . , ... • . . . . . . . . . . . . . . .
...
. . . . . ...
... .1. ...
. .
.
S0.6 _08
0.6-
. . . . . . . . . . . . . . . . . . . . . .. . . .
. . . . . . . . . . . . . . . .
0.4
[image:13.612.77.509.75.606.2].0 ..4. . . . . . . . ..
...
..
0.2 .* M easured 0.2 . .... ... .... .
...
.... .. ... .. . . . .
-_ Model
0.
0.-...
1...Om /s
:..
-. 1
O m /s
0. 0.2 0.4 0.6 0.8 1.0 1.2 0. 100 200 300 400 500 600
e) f)Alongshore
distance
(k)
()
1.2-
16 1.0
-1.4-
•.. 1.-
i
• •1.2-
?Measured 1.2- Model 0.8 -
• 1.0-
0.6 J?0.8-
0.6 -.6
-
0.4- ~0.4-
U" 0.esrd0.2-
•0.2
I "MeasredModel
0.- 1 10.-
0. 0.2 0.4 0.6 0.8 1.0 1.2 0. 100 200 300 400 500 600 A Iylongshre isane(k-m)(m)
Figure 11. Comparison between JCU COSRAD HF radar and the Q3D model: superposition of COSRAD and x-band radar data for a) an ebb tide (1200hrs, 24/2/99, note the ebb tide plume) and b) a flood tide (1500hrs, 24/2/99); c) WIBATH simulation of ebb currents (1200hrs, 24/2/99); d) WIBATH simulation of flood tidal currents (1500hrs, 24/2/99); e) WIBATH section line; f) Comparison between measured (COSRAD) and simulated (WIBATH) tidal current speed.
Tidal Inlet Function 201
a)
z(m) Ancao
600 -
5
500 -
4
400-
E 3
300 -
2
200 -
100--
Barreta 0
0-
-100 0 100 200 300 400 500
x (m)
b)
Ancao 600 -
500 -
400 -- 300-
200 -
100-
0-
Barreta
I I
-100 0 100 200 300 400 500 x (m)
Figure 12. WACUP modelling for 2/2/99: a) bathymetry and imposed maximum flood tide current field (from LAGOON); b) surface wave pat- tern 37.5 s after beginning the simulation (sinusoidal wave, H = 1.5 m,
T = 8 s).
on inlet location with migration distances 0(300 m) possible in the 1 in 50 year event for this location.
Data pertaining to the width of the inlet, the location of the channel and the morphology of the flood and ebb shoals were obtained from the video images. Some results are shown using plan-view composite video images in Figure 15 for the periods a) 3 December 1998 to 9 January 2000, and b) 3 De-
cember 1998 to 20 January 1999. Simplified sketches show- ing the principal morphological features in the video images are shown in the lower panels of each figure. Figure 15a shows that the Ilha da Barreta has eroded approximately 156 m. Some of the sediment loss on the eastern side of the Barra Nova has been compensated for by the growth on the bars comprising the swash platform on the western side of the inlet. In common with historical values the video data show an average erosion rate of 140 m/year for the inlet. Since completion of the field campaign the inlet has continued to migrate in an easterly direction by some 200 m at approxi- mate