Full Terms & Conditions of access and use can be found at
http://www.tandfonline.com/action/journalInformation?journalCode=ucjs20
Download by: [University of Tasmania] Date: 08 October 2017, At: 20:28
Canadian Journal of Science, Mathematics and
Technology Education
ISSN: 1492-6156 (Print) 1942-4051 (Online) Journal homepage: http://www.tandfonline.com/loi/ucjs20
Statistical Problem Posing, Problem Refining, and
Further Reflection in Grade 6
Jane M. Watson & Lyn D. English
To cite this article: Jane M. Watson & Lyn D. English (2017): Statistical Problem Posing, Problem Refining, and Further Reflection in Grade 6, Canadian Journal of Science, Mathematics and Technology Education, DOI: 10.1080/14926156.2017.1380867
To link to this article: http://dx.doi.org/10.1080/14926156.2017.1380867
Accepted author version posted online: 28 Sep 2017.
Submit your article to this journal
Article views: 12
View related articles
ACCEPTED MANUSCRIPT
1
Statistical Problem Posing, Problem Refining, and Further Reflection in Grade 6
Jane M. Watson
Faculty of Education, University of Tasmania, Hobart, Australia
Lyn D. English
Faculty of Education, Queensland University of Technology, Brisbane, Australia
CONTACT Jane M. Watson, Faculty of Education, University of Tasmania, Private Bag 66,
Hobart, TAS 7001, Australia
Abstract
This report is based on an activity completed by 89 Grade 6 students carrying out a statistical
investigation with a focus on posing an initial question given a context and then refining it for a
chosen data set. Having reached a conclusion based on evidence from their data analysis, students
were given additional information on the context and asked to reconsider their conclusions and
degree of certainty associated with them. Data from student workbooks were used to assess
students’ capacity to engage in the extensions of a statistical investigation not usually encountered
at the school level. Results showed approximately 70% of students were able to carry out the
complete investigation and justify a meaningful decision.
ACCEPTED MANUSCRIPT
ACCEPTED MANUSCRIPT
2Introduction
As the interest in bringing statistical investigations and statistical literacy to the primary grades
increases, research on children’s capabilities in this field has grown. In terms of the components
of a statistical investigation that support statistical literacy, Watson (2006) reported on studies
related to sampling, graphing, averages, chance, beginning inference, and variation. What has
received much less attention from researchers is the actual posing of the question that is the
foundation of a statistical investigation. Recognising that just as professional statisticians may
need to rethink and revise their questions throughout an investigation, students can be introduced
to contexts with similar requirements. The study reported here was designed to reinforce Grade 6
students’ ability to carry out a statistical investigation, while introducing them to the posing of
meaningful questions and later to rethinking the investigation when further information is
discovered.
Background
This study hence addresses three aspects of the implementation of the statistics curriculum at the
school level. First is the nature of a statistical investigation appropriate for students at the school
level, in this case Grade 6. Second, within the investigation there is the need for students to pose
their own initial questions and then refine them. This aspect of a statistical investigation has
received very little attention in the statistics education literature. Third, if more information on
the context is provided, it may be necessary for students to reconsider their decisions and
questions. No earlier research has been found on this aspect of a statistical investigation at the
school level. These three aspects are considered in turn.
ACCEPTED MANUSCRIPT
ACCEPTED MANUSCRIPT
3Statistical problem solving
The authentic introduction of statistics at the school level reflects the process that applied
statisticians carry out in their profession. Wild and Pfannkuch (1999) describe this process for
statisticians with the PPDAC investigative cycle, where the first P is for Posing a question
followed by Plan, Data, Analysis, and Conclusion. Following this work at the tertiary level, the
American Statistical Association released the Guidelines for Assessment and Instruction in
Statistics Education (GAISE) Report (Franklin et al., 2007), turning the focus to the school level.
GAISE outlines the four elements of “statistical problem solving” at the school level as (i)
Formulate Question, (ii) Collect Data, (iii) Analyse Data, and (iv) Interpret Results. The Collect
Data element includes “planning”, and all four elements stress the omnipresence of variability,
without which there would be no need for statistics (Moore, 1990).
Statistical problem solving as formulated by Wild and Pfannkuch (1999) or Franklin et al. (2007)
is complemented at the school level with the idea of informal inference (Makar & Rubin, 2009).
When sampling from a population, informal inference is a generalization beyond the collected
data based on the evidence from the data, acknowledging a degree of uncertainty in the
conclusion reached. The recognition of uncertainty is crucial, may have several sources, and may
result, for example, in repeating the PPDAC cycle. The essential contribution of context (e.g.,
Moore, 1990; Rao, 1975) is implicit in these descriptions of the stages of a statistical
investigation and informal inference, potentially adding complexity at every stage of the PPDAC
cycle. Makar, Bakker, and Ben-Zvi (2011), in discussing the role of context in informal
inference, note that “[s]tudents need to learn to coordinate contextual and statistical knowledge
ACCEPTED MANUSCRIPT
ACCEPTED MANUSCRIPT
4to overcome their struggle to make sense of a perceived gap between what they know from
experience and what they observe in data” (p.156).
Statistical problem posing
Although it is logical that problems need to be posed before they can be solved, there has been
more focus in the mathematics curriculum and the mathematics classroom on problem solving
than on problem posing. In a recent effort to redress the imbalance in research, Singer, Ellerton,
and Cai’s (2015) book, Mathematical Problem Posing, reviews the contribution of problem
posing research to mathematics education, as does Silver (2013) in a summary to a special issue
of Educational Studies in Mathematics. Only one contribution to these two publications,
however, looks at problem posing in the context of a statistical inquiry (English & Watson, 2015
a). This limited interest in statistical problem posing may be a result of the difference between
the relationship of a traditional mathematics problem to a unique solution and the relationship of
a statistical problem to an inferential decision that has an associated uncertainty (Makar &
Rubin, 2009). Consider, however, Stoyanova and Ellerton’s (1996) definition of problem posing
as “the process by which, on the basis of mathematical experience, students construct personal
interpretations of concrete situations and formulate them as meaningful mathematical problems”
(p. 518). Replacing “mathematical” with “statistical” would appear to allow a recognition of
statistical questions or hypotheses as a valid extension of research into mathematical problem
posing. The “concrete situations” fit very well with “contexts”, which are required as the
foundation for any statistical investigation.
ACCEPTED MANUSCRIPT
ACCEPTED MANUSCRIPT
5The necessity to pose questions as part of this process, has been recognized since early
curriculum documents included topics related to statistics (e.g., National Council of Teachers of
Mathematics [NCTM], 1989). In its later Principles and Standards for School Mathematics for
Data Analysis and Probability, the NCTM (2000) lists as its first standard for all levels from
prekindergarten to Grade 12, “Formulate questions that can be addressed with data, and collect,
organize, and display relevant data to answer them” (p. 48). More recently, one of the aims of the
Australian Curriculum: Mathematics (Australian Curriculum, Assessment and Reporting
Authority [ACARA], 2016) includes “pose and solve problems and reason in … statistics and
probability” (p. 4). Specifically for Grade 5, the Proficiency Strand Reasoning includes “…
posing appropriate questions for data investigations and interpreting data sets” (p. 17).
Arnold (2008) suggested two types of involvement in statistical problem posing, one
being to set the overall problem for investigation and the other being to devise survey questions
to address a larger research question. Most studies in this area have followed the line of devising
survey questions, with Lavigne and Lajoie (2007) conducting case studies of two groups of three
Grade 7 students and Meletiou-Mavrotheris and Paparistodemou (2015) considering a Grade 6
class using their survey questions to explore community service in their school. English and
Watson (2015 a) had students create survey questions for their class mates to answer in order to
make suggestions for improvement to the school playground. Watson and English (2015)
combined the two approaches, using survey questions from the Australian Bureau of Statistics
(ABS) CensusAtSchool site (<http://www.abs.gov.au/censusatschool>) rather than devised by
students, to consider whether Grade 5 students were environmentally friendly. In using the ABS
set of questions, each student decided the criteria, for example the percentage of “yes” responses,
ACCEPTED MANUSCRIPT
ACCEPTED MANUSCRIPT
6required in order to convince him/her that a sample was environmentally friendly. The current
study follows the first path of devising the overall question, as done by Allmond and Makar
(2010) in a study with 9-year-old students. Allmond and Makar piloted eight lessons over a
month focussing on characteristics of investigative questions, envisaging related data, refining
questions, and considering the purpose of the solutions to their questions. Using pre- and
post-tests, they categorised students’ questions posed in a seven-stage hierarchy that included
irrelevant, closed, and inquiry questions, finding a significant positive difference for those who
had experienced the lessons compared with other classes that had not.
Further reflection on a problem
The influence of context and its possible change throughout an investigation add to the
variability experienced and at times require students to rethink their conclusions and perhaps
their questions. In this study, it is extra and unanticipated new information on the context that
forces students to reconsider their questions and decisions. Konold and Higgins (2003) use the
term backtracking to refer to the experience when “researchers look backward … and their
questions often evolve and change as they discover unanticipated results in the data” (p. 194).
The idea of introducing additional information encouraging reflection on a decision about a
question also reflects the “what-if-not” approach of Brown and Walter (1983) in suggesting the
exploration of the consequences of accepting rather than negating the conclusion for the question
posed. Further the advice of Polya (1957) in relation to “how to solve” problems, involves
“looking back,” which in turn consolidates understanding and generates new ideas.
ACCEPTED MANUSCRIPT
ACCEPTED MANUSCRIPT
7Theoretical framework for analysis
Learning in the classroom is meant to build on previous knowledge to reach higher, more complex
cognitive levels. Evolving from the work of Piaget (1952), Biggs and Collis (1982, 1991) developed the
Structure of the Observed Learning Outcome (SOLO) taxonomy to evaluate the quality of learning (Pegg,
2003). The SOLO model covers five modes of development from Sensorimotor (from birth) to
Post-Formal (from about 20 years), with the third mode, Concrete Symbolic (from around 6 to 14 years), being
the years of primary and middle school – the mode of interest in this study. Within each mode a
hierarchical learning cycle is based on the structure observed in a response to a task employing the
elements available to accomplish the task. Three of the hierarchical levels are relevant to the current
study:
(i) Unistructural (Uni), where responses employ single elements, sometimes creating
unacknowledged contradictions;
(ii) Multistructural (Multi), where responses employ multiple elements, usually in sequence,
sometimes recognizing but not resolving conflicts among the elements;
(iii) Relational (Rel), where responses relate elements and create closure for the task.
The SOLO model has been employed across many areas of mathematics and statistics education over the
years, either as the main vehicle to assess learning (e.g., Jones, Langrall, Mooney, & Thornton, 2004;
Pegg, 2003; Reading & Reid, 2006). It has also been adapted for teachers’ use in the classroom as a
model for learning (e.g., Hook, 2015; Hook, Garrett, Howard, & John, 2014). In this study, although
aware of the aims of the SOLO hierarchy generally in the classroom, the teachers involved were not asked
specifically to use it in planning. In the larger study including the activity described here, the SOLO
model has been used in assessing student capability in relation to variation in measurement (English &
ACCEPTED MANUSCRIPT
ACCEPTED MANUSCRIPT
8Watson, 2015b), probabilistic understanding (English & Watson, 2016), and exploring typical reaction
time (Watson & English, 2017).
Research question
The research interest in this study is the students’ capacities to employ their developing
understanding of statistical problem solving (Franklin, et al., 2007) with the added complexities
of posing meaningful questions in a context and revisiting their decisions when given extra
information. The overall research question hence is the following.
Give a general context for carrying out a statistical investigation, what is the capacity shown by
students to
(i) pose an initial meaningful statistical question,
(ii) refine the question for a chosen data set and sketch an initial representation,
(iii) create a representation in TinkerPlots to complete the analysis and reach a conclusion
stating a degree of uncertainty, and
(iv) reflect on the decision given further information on the context?
Methodology
Background and design
The activity reported here is the initial part of the seventh activity in a longitudinal 3-year project
introducing statistical problem solving and informal inference as a foundation for statistical
literacy in Grades 4 to 6. The previous activities beginning in Grade 4, included (i) the
introductory one on problem posing through developing surveys (English & Watson, 2015 a); (ii)
a measurement activity to introduce different types of variation (English & Watson, 2015b); (iii)
modelling the probability of outcomes from tossing two coins (English & Watson, 2016); (iv)
ACCEPTED MANUSCRIPT
ACCEPTED MANUSCRIPT
9introducing the steps of a statistical investigation by exploring the question of Grade 5 students
being environmentally friendly (Watson & English, 2015); (v) trialling different methods of
collecting data to determine the typical reaction time of Grade 5 students (Watson & English,
2017); and (vi) using eye colour as a basis for comparing the reaction time for two groups of
Grade 6 students (Watson & English, in press). Within the activities and across the project, the
design-based research format of Cobb, Confrey, diSessa, Lehrer, and Schauble (2003) was used
including the design and preparation of materials, the carrying out of the teaching activity with
data collection, and the retrospective analyses influencing the next activity. Each activity was
introduced to the teachers in a professional learning session including a detailed lesson plan
printed in parallel with the student workbook. Teachers delivered the activity in their individual
classrooms. All activities except the first made use of the software TinkerPlots: Dynamic Data
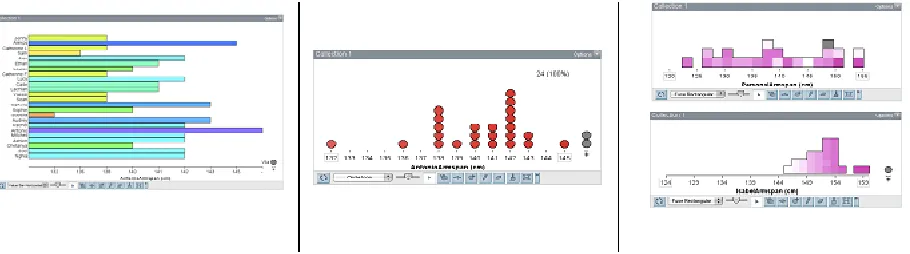
Exploration (Konold & Miller, 2011). The software was developed Grade 4 and beyond.
Students are presented with data as a “stack” of data cards (e.g., see Figure 2) and can design
their own plots by ordering, stacking, and separating data icons, transforming one display into
another, using drag-and-drop features. Examples of plots created in earlier activities by the
students in this study are shown in Figure 1.
Participants
The participants were 89 Grade 6 students (mean age 11 years, 10 months) in four classes at a
government-run school in an Australian capital city. Most of the students had been involved with
the researchers for the previous 2½ years and interacted with them freely in the classroom, both
asking and answering questions. Only data from students whose parents gave written permission
are reported; however, all students in the classes took part in the activity. Gender was evenly
ACCEPTED MANUSCRIPT
ACCEPTED MANUSCRIPT
10split with 45 girls and 44 boys. Forty-three percent of the students (38) were classified as having
English as a second language (ESL). Pseudonyms are used throughout when referring to
students.
Procedure
The activity reported here was the first part of an all-day intervention in each classroom. After
considering the question of athletes improving over time as described below, students later
selected their own Australian swimming teams for the 2016 Olympics (reported elsewhere,
English & Watson, 2017). The first part took approximately 2½ to 3 hours, depending on the
class.
The lesson began with a review of the terms students had been using in previous activities to
describe middles of data: mode, median, mean, and hat plot. Students were then asked to recall
“things to consider” when looking at data and a list was written on the whiteboard to be
referenced during the activity. The list included overall shape, end points, scale, range, outliers,
clusters, and gaps. Finally referring to a poster on the wall and used in the previous three
activities, the teacher had the students recall and describe the “4 steps to making a decision with
data”: Pose Question, Collect Data, Analyse Data, and Make Decision, reflecting the GAISE
Report (Franklin, 2007).
The students next watched a video clip of Usain Bolt running in the London 2012 Olympics 100
m Final (http://www.youtube.com/watch?v = lacjJVxC5d0; 3.38mins). Bolt set an Olympic
record of 9.63 seconds, having also set a record of 9.69 seconds at the 2008 Beijing Olympics.
Following a brief class discussion on the records displayed in the video clip, the teachers invited
the students to think about the question, “Are athletes getting better over time?” The question
ACCEPTED MANUSCRIPT
ACCEPTED MANUSCRIPT
11was deliberately vague so that students could experience the importance of refining questions in
order to answer them statistically and meaningfully.
Working in small groups, the students first informally discussed their views on the question.
Shane’s group commented, “It’s too broad… you can’t answer that question,” while Monika’s
group thought there were lots of “assumptions” in the question:
Monika: Because you could be like [an] Olympic and train a lot…?
Kelly: Yeah, because when you think about it, um, like as you get older, you’re going to get like
slower.
Monika: You’re going to get stronger and you’re going to get more stamina but like are you
actually like going to improve…
Kelly: So it, it really, it really has to depend…
Monika: Yeah, like that’s a really big like assumption to like say that all athletes get better.
A class discussion followed in which students questioned the vagueness of the terms, “athletes”,
“getting better”, and “over time”. They also considered how “better” and “over time” might be
measured. Such measurements and their units vary across different sporting events, with some
being more complex to determine than others (e.g., in gymnastics and diving). These comments
helped to set the scene and motivate students for the main part of the activity.
After the initial discussion, students were asked to write in their workbooks a question that
would be more appropriate to consider whether athletes were getting better over time. To assist
in thinking about the implications of their questions, students were also asked to indicate what
data they would collect to answer their questions. Another discussion followed with students
critiquing each other’s questions and pointing out difficulties with actually finding the required
data. Given the time constraints of the research, the age of the students, and the general context
ACCEPTED MANUSCRIPT
ACCEPTED MANUSCRIPT
12of the introduction with the video of Usain Bolt, students working in pairs were given data sets
for 12 Olympic events including 100 m sprint, 1500 m running, high jump, and long jump, and
two freestyle swimming events. For each event there were both men’s and women’s data since
the beginning of the event. An example data set is shown in Appendix A. After pairs of students
chose one of the 12 data sets, students individually wrote a revised question for that data set in
their workbooks, indicated which data they would use, and created a hand-drawn sketch in their
workbooks to show how they would analyze the data to reach a decision on athletes’
improvement. The purpose of the sketch was to orient students to thinking about time series as a
way to tell the story within the data, an approach they had not encountered before.
Students then were given the TinkerPlots file for their chosen event and worked in pairs on
laptop computers to continue their analysis from representations that they created in the software.
Students then answered a series of questions on their use of the TinkerPlots representation to
come to a conclusion and their certainty about the decision. After the students created their first
plots in TinkerPlots, there was a class discussion of the possibility to use trend lines to
summarise the movement in the data over time. Students were shown how to use the Draw tool
in TinkerPlots to draw a trend line and asked to draw one on a second plot (saved separately).
Some students wrote about their trend lines in Text boxes in the TinkerPlots file.
Finally, to reinforce the real-world nature of statistical analyses, students were shown a
PowerPoint presentation of a TED talk <
http://tedsummaries.com/2014/05/03/david-epstein-are-athletes-really-getting-faster-better-stronger/ > describing how advances in technology have
contributed to athletes’ improved performances. Subsequently, the students were to backtrack
and reflect on their prior conclusions and the certainty of their recorded decisions, indicating
ACCEPTED MANUSCRIPT
ACCEPTED MANUSCRIPT
13whether they regarded these as still justifiable. The workbook questions used for this analysis are
found in Table 1 and are directly linked to the four parts of the Research Question. Each question
in the workbook had a visual “staircase” icon numbered by the step of a statistical investigation
associated with the task.
Analysis
The source of data to address the research question was the students’ responses written in the
workbooks and the TinkerPlots files created for the data set chosen by each pair of students. The
specific responses for analysis were chosen from four parts of the workbooks as seen in Table 1:
(i) two responses about the initial question posed, (ii) three on refining the question for a chosen
Olympic data set, (iii) three on the analysis using TinkerPlots, and (iv) two after being shown the
information on technological changes potentially affecting results.
The assessment of the responses in the workbooks was based on the SOLO model (Biggs &
Collis, 1982, 1991; Pegg, 2003). The SOLO model is appropriate for the research question in this
study, first, because the judgment of capacity can be based on the cognitive complexity of the
responses provided, and second, because the model is based on the “observed” responses written
in the workbook rather than speculation of what the students might have meant to write or have
said in class discussion. The model is used to assess response complexity by considering how the
fundamental elements provided in the context for the investigation are combined to provide an
answer to a particular task. In this study, the elements vary for each part of the activity. In Part
(i), they are very general: “athletes”, “improvement”, “event”, “time”, and “data”. For Part (ii),
they are the chosen data set, added to the elements for Part (i), along with “graph”. In Part (iii),
the TinkerPlots file with data is added but otherwise it is how the other elements are combined
ACCEPTED MANUSCRIPT
ACCEPTED MANUSCRIPT
14with the new graph to make a decision that is assessed. Similarly for Part (iv), the only additional
element is the information on technological advances. As applied here for students who had had
experience with statistical investigations as summarised earlier, the relevant levels within the
Concrete Symbolic mode, the mode of development appropriate for Grade 6, are (i) Unistructural
(Uni), where students use the elements of statistics and/or context in a singular fashion; (ii)
Multistructural (Multi), where students use several elements in a sequential fashion; and (iii)
Relational (Rel), where students show evidence of interrelating elements in a meaningful way in
the conclusion reached.
The rubrics for the individual questions (see Appendix B) reflected the SOLO model, were
created by the first author, and were revised in consultation with an experienced research
assistant who completed the coding; coding was subsequently checked by the author. Because
each pair of students had potentially different data sets after Part (i), coding took place across all
responses for each student rather than across all students for each question. Previous responses
were taken into account in some cases. Subsequently codes for the individual questions were
summed for each part of the research question. The final SOLO level for each part of the activity
in Table 2 was then based on a consideration of the elements used across the two or three
questions, and hence there are alternative ways of achieving most levels. For all four parts of the
workbook it was necessary to achieve a Relational response on at least one question in that part
in order to be classified as Relational for that part. Most Multistructural responses for parts of the
workbook were evident on individual questions in those parts but a few were shown across two.
Examples are provided in the Results.
ACCEPTED MANUSCRIPT
ACCEPTED MANUSCRIPT
15Results
Percentages of responses and examples for each part of the activity are presented in relation to
the Research Question.
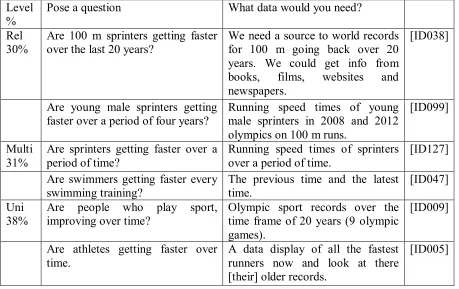
Part (i): Posing an initial question
Table 3 shows two pairs of responses for each level in Part (i) of the activity, along with the
percentage of responses at the levels. The answers to the two questions were from the same
student each time (IDs shown), with the responses considered together to determine the overall
level as detailed in Table 2. The two questions in Part (i) were about posing the initial question
and suggesting the data that would be needed to be collected to answer it. At each higher level,
more specificity was included in choosing specific, relevant elements to set the scene for a
realistic investigation, for example, the event, the athletes, the time span, and the source of data.
After filling in responses in their workbooks, students engaged in a sharing time where the
teacher and other students critiqued the questions posed and data suggested. As seen in Table 3,
more than a third of responses showed difficulty in focussing on the need for specificity. At
times students raised questions about how they were going to find the data, e.g., “we need the
names and the times from all of the races” or “it depends on how much information we find.”
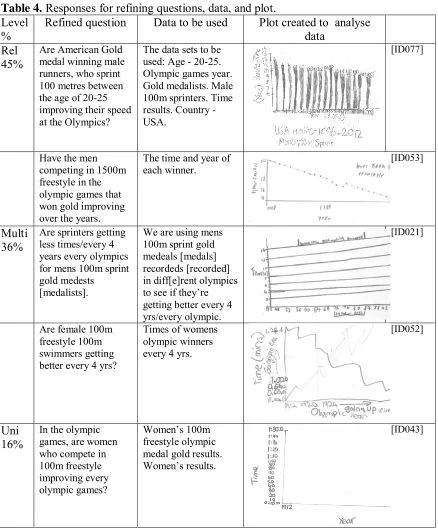
Part (ii): Refining question for Olympics, choosing data, and sketching a representation
Next, teachers introduced the students to the 12 Olympic data sets from which pairs could choose
one to focus their further refinement of the question on athletes getting better over time.
Because of the lack of experience of the students with time-series graphs, the teachers made
informal suggestions about how students could keep track of the time over which athletes may
have improved. Table 4 shows two sets of responses for the three questions in Part (ii) of the
ACCEPTED MANUSCRIPT
ACCEPTED MANUSCRIPT
16activity at each SOLO level, as well as the percentage of responses at each level. Forty-five
percent of responses at the Relational level related the elements of the refined question, data, and
a plot meaningfully, culminating in a sketch that proposed an authentic representation. At the
Multistructural level, 36% of responses basically stated the elements required for the question
and data but could not combine them for a meaningful representation. At the Unistructural level
16% of responses indicated single elements for each question but did not combine them
meaningfully in a graph.
Part (iii): Analysis using TinkerPlots file
Because of the details involved in the data and the students’ previous experience with
TinkerPlots, students were then given files with the data from their chosen events. The data were
presented as Data Cards, with students given freedom to create plots as they desired. An example
of the Data Card presentation for the Men’s Long Jump data in Appendix A is shown in Figure
2. Examples of the TinkerPlots plots created by students are displayed with the other responses
in Table 5.
Table 5 shows two sets of responses at each SOLO level for the three questions in Part (iii) of the
activity and the percentages of responses at these levels. As seen in Table 5, most responses
included creation of meaningful plots in TinkerPlots, although the level of use of the plots to
make decisions varied. Nearly half (47%) successfully related the elements across the three
questions and their graphs to a specific decision with evidence supporting their degree of
certainty at the Relational level. About a third of responses (34%) selected several relevant
elements but were not convincing in combining them and justifying certainty (Multistructural).
Finally, 19% of responses included single isolated or repeated statements across the questions.
ACCEPTED MANUSCRIPT
ACCEPTED MANUSCRIPT
17Part (iv): Reflecting on further information
Table 6 shows two sets of responses at each SOLO level for the two questions in Part (iv) of the
activity and the percentages of responses at the levels. Seven students (8%) did not engage with
the further information from the TED report. Despite only three responses reaching the highest
code (3) on both questions, all Relational responses for Part (iv) included conditional reasoning
for at least one of the questions. Although not all responses provided Relational reasoning, 70%
acknowledged uncertainty about their results given the additional information. At the
Multistructural level, responses included several elements containing relevant evidence for
uncertainty without further integrated reflection. Unistructural responses acknowledged single
pieces of evidence without uncertainty.
Summary
Table 7 summarises the levels of responses across the four parts of the activity. Because the
SOLO model is based on observed learning outcomes it is not possible to speculate on what
responses students may have provided in different circumstances, perhaps with more prompting.
Observation of the research team in the classroom was that in Part (i) some students did not
appreciate the seriousness of posing questions and did not progress past more superficial
responses; this is reflected in the 38% of Unistructural responses to Part (i). For Part (ii), having
specific data sets with which to work helped students recognise elements that could be
incorporated in their questions and proposed analyses. This resulted in increased levels of
performance for many students. This continued into Part (iii) when TinkerPlots assisted students
as they created plots for their data sets and used their previous experience with the software to
create meaningful representations. Part (iv) illustrated students’ willingness to be challenged
ACCEPTED MANUSCRIPT
ACCEPTED MANUSCRIPT
18about their conclusions, but lack of experience in arguing strongly, shown in more
Multistructural than Relational responses. The 22% of Unistructural responses illustrated the
inability to incorporate the additional information and review the certainty of their decisions
from Part (iii).
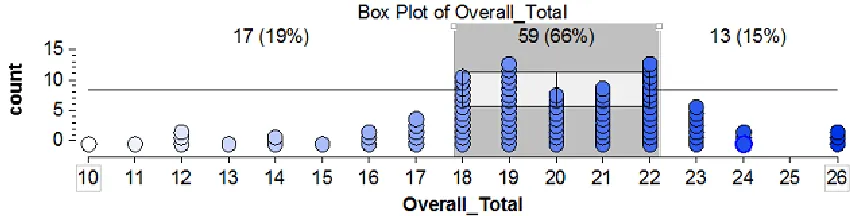
Figure 3 shows the distribution of the Overall Total coding scores for the activity. The middle of
the data bounded by the box plot includes 66% of the data. This is suggesting that these Grade 6
students have a fairly strong overall Multistructural capacity to consider this activity, with 15%
consistently able to work at a Relational level, and about 19% struggling to combine the
elements of the practice of statistics in more than a singular fashion. Gender did not play a role in
the outcomes with only a slightly higher mean for girls and a few more boys in the Unistructural
group. ESL status did not have a negative impact, with ESL students having a slightly higher
mean than other students with fewer students in the Unistructural group and more in the
Relational group.
Discussion
The contribution of this study is considered from several perspectives, including the importance
of carrying out complete statistical investigations in elementary school with a focus on problem
posing and of using a developmental framework for assessing student capacity. There are also
implications for teaching strategies in the classroom and further research, as well as enhancing
statistical literacy more generally.
In relation to the PPDAC investigative cycle used by applied statisticians (Wild & Pfannkuch,
1999), this study reinforces the view of the GAISE Report (Franklin et al., 2007) that it is both
feasible and important to introduce such a practice at the school level. Anecdotally, the students
ACCEPTED MANUSCRIPT
ACCEPTED MANUSCRIPT
19were highly motivated by the activity, as illustrated in the classroom discussion that took place
and in the oral reports presented by the students (English, 2015). As the first half of the
culminating activity for the larger project of which it was a part, the investigation carried out by
the students reinforced their previous experiences of carrying out complete statistical
investigations (e.g., Watson & English, 2015, 2017).
More specifically, in relation to problem posing, although mathematics curriculum documents
(e.g., ACARA, 2016; NCTM, 2000) include problem posing specifically in association with
statistical inquiry, very little research has taken place in this realm. That which has occurred has
been in contexts where a general question moves quickly into the construction of survey
questions from which data can be collected from other students in the class (e.g., Lavigne &
Lajoie,2007; Meletiou-Mavrotheris & Paparistodemou, 2015). Compared to the study of Allmond and
Makar (2010) with slightly younger students, which considered students setting the overall
question for investigation, it was not possible to identify seven levels of the initial problem
posing in this study. It is likely that providing the Olympic data sets in this study, avoided the
focus on irrelevant and closed questions; also, Allmond and Makar did not add extra information
to the contexts for their students. It is disappointing to find that the US Common Core State
Standards for Mathematics (Common Core State Standards Initiative, 2010) not only omits
Statistics and Probability until Grade 6, but also makes no mention of statistical problem posing.
Although the students in this study did not have the further opportunity to re-pose their
questions, as Konold and Higgins (2003) suggested often happens for adult researchers when
they backtrack, students were asked to rethink the confidence they had in the conclusions
reached. In encouraging students to at least rethink the conclusions and questions posed in the
ACCEPTED MANUSCRIPT
ACCEPTED MANUSCRIPT
20light of further information, the activity asked students to follow Polya’s (1957) advice to “look
back” after reaching a decision on a question, consolidating initial understanding, and to explore
the related concepts more fully, further acknowledging the possibility to pose more questions
(Brown & Walter, 1983).
The results of analysing students’ responses in their workbooks as they completed the four parts
of the Athletes activity indicated that approximately 70% of the Grade 6 students in this study
could engage meaningfully with a statistical investigation that involved revising a question,
carrying out analysis of data, reaching a conclusion, and rethinking the conclusion based on
additional information about the context. Based on the SOLO cognitive model (Biggs & Collis,
1982, 1991; Pegg, 2003) these students could create arguments in a sequential manner using the
elements available to them to refine their initial questions, make decisions based on analysing
their representations, and reflect on their conclusions based on additional information. Some
students could go further and produce more complex, integrated arguments combining the
elements. This study adds to previous research in statistics education at the school level using the
SOLO model (e.g., Groth, 2003; Reading & Reid, 2006; Watson, 2006; Watson & English,
2015), suggesting it is reasonable to describe the capacity of students to engage in statistical
investigations developmentally. Given the complexity of the activity, not previously known to be
carried out with Grade 6 students, this research provides benchmarks for further research. As
well as using the SOLO model to assess student outcomes as done in this study, the work of
Hook (2015) provides practical suggestions for teachers to use SOLO in the classroom, both to
make learning visible for the students and to plan specific strategies for moving students’
thinking to higher levels. This work provides an opportunity for further research. Combined with
ACCEPTED MANUSCRIPT
ACCEPTED MANUSCRIPT
21the use of authentic contexts, Hook’s work should also encourage classroom teachers to move
beyond a procedural approach to the statistics curriculum.
This activity was part of the final investigation of a 3-year study exploring the potential to build
statistical literacy understanding in upper primary students through experiences grounded in
statistical problem solving (Franklin et al., 2007) and informal inference (Makar & Rubin, 2009).
Although much has been written about statistical literacy for adults (e.g., Gal, 2002; Wallman,
1993), at the school level, Watson (2006) provides a concise description.
Statistical literacy is the meeting point of the data and chance curriculum and the everyday world,
where encounters involve unrehearsed contexts and spontaneous decision-making based on the
ability to apply statistical tools, general contextual knowledge, and critical literacy skills. (Watson,
2006, p.11)
In the activity described here students encountered an unrehearsed context where they had not
only to make decisions but also to reconsider their decisions. To do this they had to use their
contextual knowledge of athletes and the Olympics, apply the statistical tools they had been
developing over the three years of the project, and use their critical literary skills to interpret the
further information provided to rethink their positions on the questions they had posed. Outside
of school, they will meet situations where they need to think critically about questions posed in
order to judge the conclusions claimed by the poser. Hopefully the experience gained in this and
previous activities will stand them in good stead in these situations.
Acknowledgements
This study was funded by Australian Research Council project number DP120100158. Any
opinions, findings, and conclusions or recommendations expressed are those of the authors and
ACCEPTED MANUSCRIPT
ACCEPTED MANUSCRIPT
22do not necessarily reflect the views of the ARC. We wish to acknowledge the excellent support
of our senior research assistants, Jo Macri, who organised all materials and setup for the
classrooms, and Dr Ben Kelly, who assisted with the coding.
ACCEPTED MANUSCRIPT
ACCEPTED MANUSCRIPT
23References
Allmond, S., & Makar, K. (2010). Developing primary students’ ability to pose questions in
statistical investigations. In C. Reading (Ed.), Data and context in statistics education:
Towards an evidence-based society (Proceedings of the 8th International Conference on the
Teaching of Statistics, Ljubljana, Slovenia, July 11--16). Voorburg, The Netherlands:
International Statistical Institute. Retrieved from
http://iase-web.org/documents/papers/icots8/ICOTS8_8A1_ALLMOND.pdf
Arnold, P. (2008). What about the P in the PPDAC cycle? An initial look at posing questions for
statistical investigation. Proceedings of the 11th International Congress of Mathematics
Education, Monterrey, Mexico, 6--13 July, 2008. Retrieved from
http://tsg.icme11,org/tsg/show/15
Australian Curriculum, Assessment and Reporting Authority. (2013). General capabilities in the
Australian Curriculum, January, 2013 (updated September 2014). Sydney, NSW: ACARA.
Biggs, J.B., & Collis, K.F. (1982). Evaluating the quality of learning: The SOLO taxonomy. New
York: Academic Press.
Biggs, J.B., & Collis, K.F. (1991). Multimodal learning and the quality of intelligent behaviour.
In H.A.H. Rowe (Ed.), Intelligence: Reconceptualization and measurement (pp. 57--76).
Hillsdale, NJ: Lawrence Erlbaum.
Brown, S.I., & Walter, M.I. (1983). The art of problem posing. Philadelphia, PA: Franklin
Institute Press.
Cobb, P., Confrey, J., diSessa, A., Lehrer, R., & Schauble, L. (2003). Design experiments in
ACCEPTED MANUSCRIPT
ACCEPTED MANUSCRIPT
24Common Core State Standards Initiative. (2010). Common Core State Standards for
Mathematics. Washington, DC: National Governors Association for Best Practices and the
Council of Chief State School Officers. Retrieved from
http://www.corestandards.org/assets/CCSSI_Math%20Standards.pdf
English, L.D. (2015). STEM: Challenges and opportunities for mathematics education. In K.
Beswick, T. Muir, & J. Wells (Eds.), Climbing mountains, building bridges (Proceedings of
39th conference of the International Group for the Psychology of Mathematics Education,
Hobart, Tasmania, 13--18 July, Vol. 1., pp. 3--18). Hobart: PME.
English, L.D., & Watson, J.M. (2015 a). Statistical literacy in the elementary school:
Opportunities for problem posing. In F. Singer, N. Ellerton, & J. Cai (Eds.), Problem posing:
From research to effective practice (pp. 241--256). Dordrecht: Springer. [ISBN
978-1-4614-6257-6] DOI 10.1007/978-1-4614-6258-3
English, L., & Watson, J. (2015b). Exploring variation in measurement as a foundation for
statistical thinking in the elementary school. International Journal of STEM Education, 2(3).
DOI 10.1186/s40594-015-0016-x
English, L., & Watson, J. (2016). Development of probabilistic understanding in fourth grade.
Journal for Research in Mathematics Education, 47, 28--62.
English, L., & Watson, J. (2017). Developing sixth-grade students’ statistical literacy through
modeling with data. Manuscript submitted for publication.
Franklin, C., Kader, G., Mewborn, D., Moreno, J., Peck, R., Perry, M., & Scheaffer, R. (2007).
Guidelines for assessment and instruction in statistics education (GAISE) report: A preK-12
ACCEPTED MANUSCRIPT
ACCEPTED MANUSCRIPT
25curriculum framework. Alexandria, VA: American Statistical Association. Retrieved from
http://www.amstat.org/education/gaise/
Gal, I. (2002). Adults’ statistical literacy: Meanings, components, responsibilities. International
Statistical Review, 70, 1--51.
Groth, R. (2003). High school students’ levels of thinking in regard to statistical study design.
Mathematics Education Research Journal, 15(3), 252--269.
Hook, P. (2015). First steps with SOLO Taxonomy: Applying the model in your classroom.
Laughton, UK: Essential Resources Educational Publishers Limited.
Hook, P., Garrett, C., Howard, M., & John, E. (2014). SOLO Taxonomy in mathematics:
Strategies for thinking like a mathematician. Invercargill, NZ: Essential Resources
Educational Publishers Limited.
Jones, G.A., Langrall, C.W., Mooney, E.S., Thornton, C.A. (2004). Models of development in
statistical reasoning. In D. Ben-Zvi & J. Garfield (Eds.), The challenge of developing
statistical literacy, reasoning and thinking (pp. 97--117). Dordrecht, The Netherlands:
Kluwer.
Konold, C., & Higgins, T.L. (2003). Reasoning about data. In J. Kilpatrick, W.G. Martin, & D.
Schifter, (Eds.), A research companion to Principles and Standards for School Mathematics
(pp. 193--215). Reston, VA: National Council of Teachers of Mathematics.
Konold, C., & Miller, C.D. (2011). TinkerPlots: Dynamic data exploration [Computer software,
Version 2.2]. Emeryville, CA: Key Curriculum Press.
Lavigne, N.C., & Lajoie, S.P. (2007). Statistical reasoning of middle school children engaging in
survey inquiry. Contemporary Educational Psychology, 32(4), 630--666.
ACCEPTED MANUSCRIPT
ACCEPTED MANUSCRIPT
26Makar, K., Bakker, A., & Ben-Zvi, D. (2011). The reasoning behind informal statistical
inference. Mathematical Thinking and Learning, 13, 152--173.
Makar, K., & Rubin, A. (2009). A framework for thinking about informal statistical inference.
Statistics Education Research Journal, 8(1), 82--105. Retrieved from
http://iase-web.org/documents/SERJ/SERJ8(1)_Makar_Rubin.pdf
Meletiou-Mavrotheris, M., & Paparistodemou, E. (2015). Developing students’ reasoning about
samples and sampling in the context of informal inferences. Educational Studies in
Mathematics, 88, 385--404.
Moore, D.S. (1990). Uncertainty. In L.A. Steen (Ed.), On the shoulders of giants: New
approaches to numeracy (pp. 95--137). Washington, DC: National Academy Press.
National Council of Teachers of Mathematics. (1989). Curriculum and evaluation standards for
school mathematics. Reston, VA: Author.
National Council of Teachers of Mathematics. (2000). Principles and standards for school
mathematics. Reston, VA: Author.
Pegg, J.E. (2003). Assessment in mathematics: A developmental approach. In J.M. Royer (Ed.),
Mathematical cognition (pp. 227--259). Greenwich, CT: Information Age Publishing.
Piaget, J. (1952). The origin of intelligence in children. New York: International University
Press, Inc.
Polya, G. (1957). How to solve it: A new aspect of mathematical method (2nd ed.). Garden City,
NY: Doubleday.
Rao, C.R. (1975). Teaching of statistics at the secondary level: An interdisciplinary approach.
International Journal of Mathematical Education in Science and Technology, 6, 151--162.
ACCEPTED MANUSCRIPT
ACCEPTED MANUSCRIPT
27Reading, C., & Reid, J. (2006). An emerging hierarchy of reasoning about distribution: From a
variation perspective. Statistics Education Research Journal, 5(2), 46--68. Retrieved from
https://iase-web.org/documents/SERJ/SERJ5(2)_Reading_Reid.pdf
Silver, E.A. (2013). Problem-posing research in mathematics education: Looking back, looking
around, looking ahead. Educational Studies in Mathematics, 83, 157--162.
Singer, F., Ellerton, N., & Cai, J. (Eds.). (2015). Problem posing: From research to effective
practice. Dordrecht: Springer.
Stoyanova, E., & Ellerton, N.F. (1996). A framework for research into students’ problem posing
in school mathematics. In P.C. Clarkson (Ed.), Technology in mathematics education (pp.
518–525). Melbourne: Mathematics Education Research Group of Australasia and University
of Melbourne.
Wallman, K.K. (1993). Enhancing statistical literacy: Enriching our society. Journal of the
American Statistical Association, 88, No. 421, 1--8.
Watson, J.M. (2006). Statistical literacy at school: Growth and goals. Mahwah, NJ: Lawrence
Erlbaum.
Watson, J., & English, L. (2013). Data and measurement in year 4 of the Australian Curriculum:
Mathematics. In S. Herbert, J. Tillyer, & T. Spencer (Eds.), Mathematics: Launching futures
(Proceedings of the 24th biennial conference of the Australian Association of Mathematics
Teachers, Inc., pp. 157--165). Adelaide: AAMT, Inc.
Watson, J., & English, L. (2015). Introducing the practice of statistics: Are we environmentally
friendly? Mathematics Education Research Journal, 27, 585--613. DOI
10.1007/s13394-015-0153-z
ACCEPTED MANUSCRIPT
ACCEPTED MANUSCRIPT
28Watson, J., & English, L. (2017). Reaction time in Grade 5: Data collection within the Practice
of Statistics. Statistics Education Research Journal, 16(1), 262--293. Retrieved from
https://iase-web.org/documents/SERJ/SERJ16(1)_Watson.pdf
Watson, J., & English, L. (in press). Eye color and the practice of statistics in grade 6:
Comparing two groups. Journal of Mathematical Behavior.
Wild, C., & Pfannkuch, M. (1999). Statistical thinking in empirical enquiry. International
Statistical Review, 67(3), 223--248.
ACCEPTED MANUSCRIPT
ACCEPTED MANUSCRIPT
29Appendix A – Example Data Set
Men’s Long Jump Olympic Games Gold Medal Results
City Year Result (m) Age Name Country
Athens 1896 6.35 22 Ellery Clark USA
Paris 1900 7.185 23 Alvin Kraenzlein USA
St Louis 1904 7.34 24 Meyer Prinstein USA
London 1908 7.48 22 Frank Irons USA
Stockholm 1912 7.60 24 Albert Gutterson USA
Antwerp 1920 7.15 24 William Petersson SWE
Paris 1924 7.445 20 William De Hart Hubbard USA
Amsterdam 1928 7.73 22 Edward Barton Hamm USA
Los Angeles 1932 7.64 26 Edward Lansing Gordon USA
Berlin 1936 8.06 22 Jesse Owens USA
London 1948 7.825 25 William Steele USA
Helsinki 1952 7.57 24 Jerome Biffle USA
Melbourne 1956 7.83 26 Gregory Curtis Bell USA
Rome 1960 8.12 21 Ralph Boston USA
Tokyo 1964 8.07 22 Lynn Davies GBR
Mexico 1968 8.90 22 Bob Beamon USA
Munich 1972 8.24 19 Randel Williams USA
Montreal 1976 8.35 28 Arnie Robinson USA
Moscow 1980 8.54 21 Lutz Dombrowski GER
Los Angeles 1984 8.54 23 Carl Lewis USA
Seoul 1988 8.72 27 Carl Lewis USA
Barcelona 1992 8.67 31 Carl Lewis USA
Atlanta 1996 8.50 35 Carl Lewis USA
ACCEPTED MANUSCRIPT
ACCEPTED MANUSCRIPT
30Sydney 2000 8.55 27 Ivan Pedroso CUB
Athens 2004 8.59 26 Dwight Phillips USA
Beijing 2008 8.34 25 Irving Saladino PAN
London 2012 8.31 26 Greg Rutherford GBR
ACCEPTED MANUSCRIPT
ACCEPTED MANUSCRIPT
31Appendix B
Athletes Workbook Questions and Rubrics
Question Code Description response
Part (i) 0 No response; not a question
1. Pose a question 1 General question on “athletes” or “getting better”
2 Question based on a specific sport, type of improvement and time frame.
Part (i) 0 No response; data not related to question
2. Collect data 1 One of data set, measurement or time related to question
What data would you need to
answer your question? 2 Two of data set, measurement or time related to question 3 Names data set and measurement over time
period – related to question
Part (ii) 0 No response or general question on
“athletes” or “getting better”
1. Refined/group question 1 Specific question including one or two of: specific sport, type of improvement, or time frame
2 Specific question including all three of: specific sport, type of improvement, and time frame
Part (ii) 0 No response; no improvement on 1. (Part
(i))
2. Data set/s to be used 1 One of data set, measurement or time related to refined question 1.
2 Two of data set, measurement or time related to refined question 1.
3 Names data set and measurement over time period – related to refined question 1.
Part (ii) 0 No response; unlabelled plot
3. Analyse data 1 Plot with attempted but inadequate/inappropriate labels (as requested in the question)
Remember, part of analysing the data is to plot and organise the data. This gives us a good
2 Plot labelled adequately/appropriately (as requested) but no data
3 Appropriate labels and minimal data
ACCEPTED MANUSCRIPT
ACCEPTED MANUSCRIPT
32Question Code Description response
understanding of the “whole picture.” Use the space below to
sketch your graph, ensuring you:
label your axis, record your end points, record your scale.
4 Appropriate labels on plot as required and meaningful data related to refined question 1.
Question Code Description response
Part (iii) 0 No response
[from representation in
TinkerPlots]
1 One accurate observation 2 Two accurate observations 1. What does your representation
tell you? List as many things as you can see.
3 Three or more accurate observations
Part (iii) 0 No response; decision not related to
evidence 2. From your analysis, what
decision/conclusion have you reached?
1 General relevant comment on data
2 Specific comment including details of sport, time, improvement, etc.
Part (iii) 0 No response; statement without
justification 3. How certain of your conclusion
are you? Explain your answer. 1 Certainty based on general claim of “evidence” 2 Certainty based on specific “evidence”
Part (iv) 0 No response; “Yes” or “No” with no
explanation
1. Reflect on your decision 1 “Yes” or “No”; with brief superficial reasoning
Reflecting on the TED article, would you change your
conclusion? Slightly? A lot? If so, write your new conclusion below. If not, record your reasons below why you feel your previous conclusion is still justifiable.
2 “Yes” or “No”; with specific reasoning 3 Unsure; with reasoning for both “Yes” and
“No”
Part (iv) 0 No response; comment without
explanation
2. How certain of your conclusion 1 Very certain because of evidence
2 Not very certain because of TED
ACCEPTED MANUSCRIPT
ACCEPTED MANUSCRIPT
33Question Code Description response
are you now? Explain your answer. 3 Not certain – times improved but maybe because of non-human factors
ACCEPTED MANUSCRIPT
[image:35.612.66.521.114.448.2]ACCEPTED MANUSCRIPT
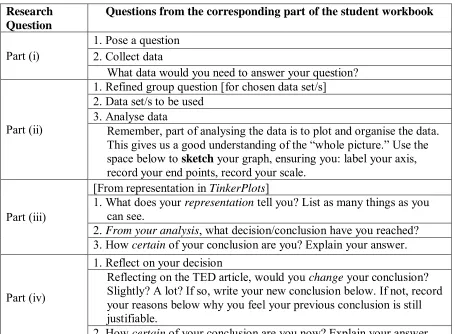
34Table 1. Questions from the student workbook.
Research Question
Questions from the corresponding part of the student workbook
Part (i) 1. Pose a question 2. Collect data
What data would you need to answer your question?
Part (ii)
1. Refined group question [for chosen data set/s] 2. Data set/s to be used
3. Analyse data
Remember, part of analysing the data is to plot and organise the data. This gives us a good understanding of the “whole picture.” Use the space below to sketch your graph, ensuring you: label your axis,
record your end points, record your scale.
Part (iii)
[From representation in TinkerPlots]
1. What does your representation tell you? List as many things as you
can see.
2. From your analysis, what decision/conclusion have you reached?
3. How certain of your conclusion are you? Explain your answer.
Part (iv)
1. Reflect on your decision
Reflecting on the TED article, would you change your conclusion?
Slightly? A lot? If so, write your new conclusion below. If not, record your reasons below why you feel your previous conclusion is still justifiable.
2. How certain of your conclusion are you now? Explain your answer.
ACCEPTED MANUSCRIPT
[image:36.612.60.523.82.647.2]ACCEPTED MANUSCRIPT
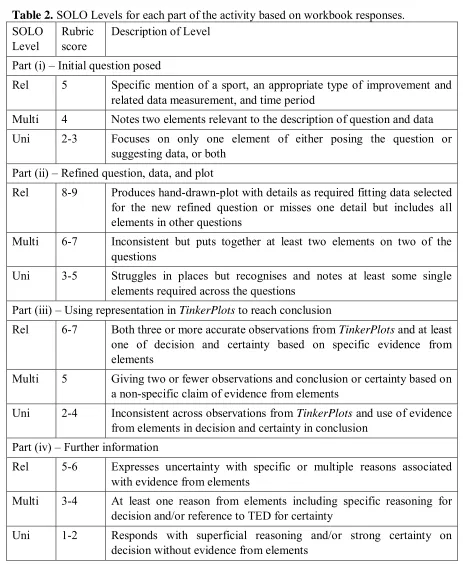
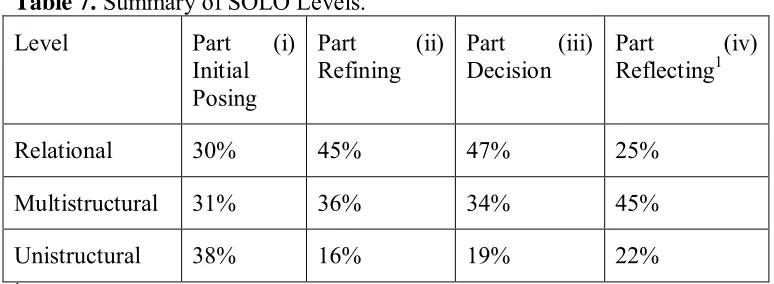
35Table 2. SOLO Levels for each part of the activity based on workbook responses.
SOLO
Level Rubric score Description of Level Part (i) – Initial question posed
Rel 5 Specific mention of a sport, an appropriate type of improvement and related data measurement, and time period
Multi 4 Notes two elements relevant to the description of question and data Uni 2-3 Focuses on only one element of either posing the question or
suggesting data, or both Part (ii) – Refined question, data, and plot
Rel 8-9 Produces hand-drawn-plot with details as required fitting data selected for the new refined question or misses one detail but includes all elements in other questions
Multi 6-7 Inconsistent but puts together at least two elements on two of the questions
Uni 3-5 Struggles in places but recognises and notes at least some single elements required across the questions
Part (iii) – Using representation in TinkerPlots to reach conclusion
Rel 6-7 Both three or more accurate observations from TinkerPlots and at least
one of decision and certainty based on specific evidence from elements
Multi 5 Giving two or fewer observations and conclusion or certainty based on a non-specific claim of evidence from elements
Uni 2-4 Inconsistent across observations from TinkerPlots and use of evidence
from elements in decision and certainty in conclusion Part (iv) – Further information
Rel 5-6 Expresses uncertainty with specific or multiple reasons associated with evidence from elements
Multi 3-4 At least one reason from elements including specific reasoning for decision and/or reference to TED for certainty
Uni 1-2 Responds with superficial reasoning and/or strong certainty on decision without evidence from elements
ACCEPTED MANUSCRIPT
[image:37.612.66.525.104.393.2]ACCEPTED MANUSCRIPT
36Table 3. Response for initial problem posing.
Level
% Pose a question What data would you need? Rel
30% Are 100over the last 20 years? m sprinters getting faster We need a source to world records for 100 m going back over 20 years. We could get info from books, films, websites and newspapers.
[ID038]
Are young male sprinters getting
faster over a period of four years? Running speed times of young male sprinters in 2008 and 2012 olympics on 100m runs.
[ID099]
Multi
31% Are sprinters getting faster over a period of time? Running speed times of sprinters over a period of time. [ID127] Are swimmers getting faster every
swimming training? The previous time and the latest time. [ID047] Uni
38% Are people who play sport, improving over time? Olympic sport records over the time frame of 20 years (9 olympic games).
[ID009]
Are athletes getting faster over
time. A data display of all the fastest runners now and look at there [their] older records.
[ID005]
ACCEPTED MANUSCRIPT
[image:38.612.71.509.89.617.2]ACCEPTED MANUSCRIPT
37Table 4. Responses for refining questions, data, and plot.
Level
% Refined question Data to be used Plot created to analyse data Rel
45% Are American Gold medal winning male runners, who sprint 100 metres between the age of 20-25 improving their speed at the Olympics?
The data sets to be used: Age - 20-25. Olympic games year. Gold medalists. Male 100m sprinters. Time results. Country - USA.
[ID077]
Have the men competing in 1500m freestyle in the olympic games that won gold improving over the years.
The time and year of
each winner. [ID053]
Multi
36% Are sprinters getting less times/every 4 years every olympics for mens 100m sprint gold medests
[medalists].
We are using mens 100m sprint gold medeals [medals] recordeds [recorded] in diff[e]rent olympics to see if they’re getting better every 4 yrs/every olympic.
[ID021]
Are female 100m freestyle 100m swimmers getting better every 4 yrs?
Times of womens olympic winners every 4 yrs.
[ID052]
Uni
16% In the olympic games, are women who compete in 100m freestyle improving every olympic games?
Women’s 100m freestyle olympic medal gold results. Women’s results.
[ID043]
ACCEPTED MANUSCRIPT
ACCEPTED MANUSCRIPT
38Is the younger swimmer better than the old swimmer?
Age and the time (15, 17, 18, 20, 22, 23, 24, 25, 26, 29) 10, 20, 30, 40, 50, times 1:10, 1:20, 1:30, 1:40, 1:50.
[ID089]
ACCEPTED MANUSCRIPT
[image:40.612.66.524.97.661.2]ACCEPTED MANUSCRIPT
39Table 5. Responses for analysis using plots created in TinkerPlots.
Level
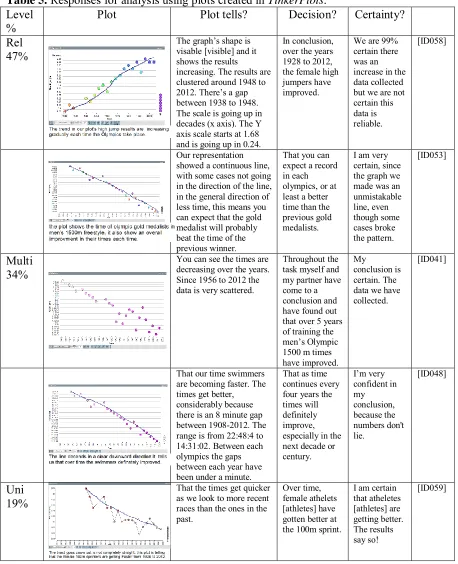
% Plot Plot tells? Decision? Certainty? Rel
47%
The graph’s shape is visable [visible] and it shows the results increasing. The results are clustered around 1948 to 2012. There’s a gap between 1938 to 1948. The scale is going up in decades (x axis). The Y axis scale starts at 1.68 and is going up in 0.24.
In conclusion, over the years 1928 to 2012, the female high jumpers have improved.
We are 99% certain there was an increase in the data collected but we are not certain this data is reliable.
[ID058]
Our representation showed a continuous line, with some cases not going in the direction of the line, in the general direction of less time, this means you can expect that the gold medalist will probably beat the time of the previous winner.
That you can expect a record in each olympics, or at least a better time than the previous gold medalists.
I am very certain, since the graph we made was an unmistakable line, even though some cases broke the pattern. [ID053] Multi 34%
You can see the times are decreasing over the years. Since 1956 to 2012 the data is very scattered.
Throughout the task myself and my partner have come to a conclusion and have found out that over 5 years of training the men’s Olympic 1500 m times have improved.
My
conclusion is certain. The data we have collected.
[ID041]
That our time swimmers are becoming faster. The times get better, considerably because there is an 8 minute gap between 1908-2012. The range is from 22:48:4 to 14:31:02. Between each olympics the gaps between each year have been under a minute.
That as time continues every four years the times will definitely improve, especially in the next decade or century. I’m very confident in my conclusion, because the numbers don't lie. [ID048] Uni 19%
That the times get quicker as we look to more recent races than the ones in the past.
Over time, female athelets [athletes] have gotten better at the 100m sprint.
I am certain that atheletes [athletes] are getting better. The results say so! [ID059]
ACCEPTED MANUSCRIPT
ACCEPTED MANUSCRIPT
40Our representation tells us that over time of 12 years, the athletes have risen the record jump height by 3mm.
The conclusion I have reached is that, over a certain period of time athletes can and will improve the gold med[a]list records.
I am very certain of my conclusion because the results are going in an upwards direction.
[ID091]