i
Data network for better European organic market information Collaborative Project
Collaborative Project targeted to a special group (such as SMEs)
SEVENTH FRAMEWORK PROGRAMME FP7-KBBE.2011.1.4-05
Data network for better European organic market information
Appendices to D 6.7 report on the experience of conducting the case studies
Gerrard, C.L., Vieweger, A., Alisir, L., Bteich, M.-R., Cottingham, M., Feldman, C., Flechet, D., Husak, J., Losták, M., Moreau, C., Rison, N., Pugliese, P., Schaack, D., Solfanelli, F., Willer, H., Padel, S.
Due date of delivery: 31.08.2014 (Month 32) Actual submission date: 30.09.2014
Start date of project: 1st January 2012 Duration: 36 months Work package: 6
Work package Leader: Susanne Padel Version: Final
ii
Content of appendices
Content of appendices ... ii
Tables and Figures ... iii
Table of Acronyms ... v
Appendix A: Background data collection methods ... 1
Production and farm-level prices... 1
Domestic trade/retail and retail prices ... 1
International trade ... 4
Appendix B: Current status of data collection as at 2012/2013 ... 6
UK (by Catherine Gerrard) ... 8
Germany (by Diana Schaack) ... 17
Italy (by Francesco Solfanelli, Daniela Vairo and Raffaele Zanoli) ... 27
France (by Camille Moreau, Nathalie Rison, and Dorian Flechet) ... 32
Czech Republic (by Michal Lošák and Jakub Husák) ... 42
Mediterranean (Produced by: Marie Reine Bteich, Patrizia Pugliese and Lina Al-Bitar on the basis of reports by national experts) ... 56
Appendix C: Experience of carrying out the case study ... 79
UK (by Catherine Gerrard and Martin Cottingham) ... 79
Germany (by Diana Schaack) ... 98
Italy (by Francesco Solfanelli, Daniela Vairo and Raffaele Zanoli) ... 113
France (by Nathalie Rison Alabert, Eva Lacarce and Dorian Flechet) ... 126
Czech Republic (by Jakub Husák and Michal Lošták) ... 136
Mediterranean (produced by Bteich Marie Reine, Pugliese Patrizia and Al-Bitar Lina on the basis of reports prepared by national experts) ... 146
Appendix D: Overview of data collection systems for import data in Europe (by Helga Willer and Diana Schaack) ... 165
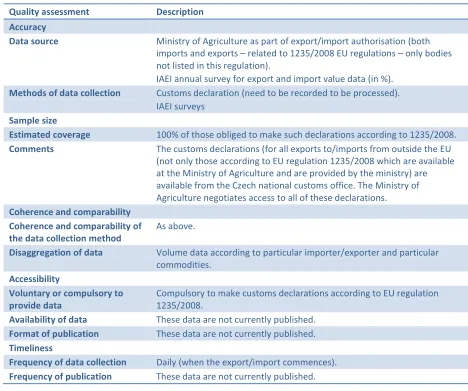
Czech Republic ... 165
Denmark ... 167
France ... 169
Germany ... 170
Italy... 175
iii
Tables and Figures
Table A 1: Advantages and disadvantages of household panels ... 2
Table A 2: Advantages and disadvantages of retail panels ... 2
Table B 1: Data collection in case study countries in 2011/12 ... 7
Table B 2: UK production (livestock number and crop area) data quality assessment ... 9
Table B 3: UK production (volume and value) data quality assessment ... 11
Table B 4: UK retail data quality assessment ... 13
Table B 5: UK catering data quality assessment ... 14
Table B 6: UK farm-level price data quality assessment ... 15
Table B 7: German production (crop areas and livestock numbers) data quality assessment ... 18
Table B 8: German production (volumes and values) data quality assessment ... 19
Table B 9: German retail data quality assessment ... 22
Table B 10: German international trade data quality assessment ... 23
Table B 11: German farm-level price data quality assessment ... 24
Table B 12: Italian production (crop area/livestock number) data quality assessment ... 27
Table B 13: Italian retail data quality assessment. ... 28
Table B 14: Italian farm-level price data quality assessment ... 30
Table B 15: French production (crop area and livestock number) data quality assessment ... 32
Table B 16: French production (yield and volumes) data quality assessment ... 34
Table B 17: French retail sales (value) data quality assessment... 36
Table B 18: French catering data quality assessment ... 37
Table B 19: French import data quality assessment ... 38
Table B 20: French export data quality assessment ... 39
Table B 21: French farm-level price data quality assessment ... 40
Table B 22: French retail price data quality assessment ... 40
Table B 23: Czech Republic production (livestock numbers and crop areas) data quality assessment. ... 44
Table B 24: Czech Republic production (volume and value) data quality assessment. ... 47
Table B 25: Czech Republic retail (volumes and values) data quality assessment ... 48
Table B 26: Czech Republic international trade data quality assessment ... 50
Table B 27: Czech Republic farm level price data quality assessment ... 51
Table B 28: Czech Republic retail price data quality assessment. ... 52
Table B 29: Turkish production (number and area) data quality assessment ... 57
Table B 30: Turkish production volumes data quality assessment ... 58
Table B 31: Turkish Export volumes and values data quality assessment ... 59
Table B 32: Lebanese production (number and area) data quality assessment ... 61
Table B 33: Lebanese production volumes data quality assessment ... 62
Table B 34: Serbian production (number and area) data quality assessment ... 64
Table B 35: Serbian production (volume and value) data quality assessment ... 65
Table B 36: Serbian international trade data quality assessment ... 67
Table B 37: Albanian production (number and area) data quality assessment ... 69
Table B 38: Albanian production volumes data quality assessment ... 70
iv
Table B 40: Tunisian production (volume and value) data quality assessment ... 75
Table B 41: Tunisian international trade data quality assessment ... 76
Table C 1: Proportions of farm types represented in the England 2013 survey ... 85
Table C 2: Overview of producer price data collections: ... 104
Table C 3: Example for the computation of Regional Crop Index. ... 117
Table D 1: Import data based on import authorisations – Czech Republic. ... 165
Table D 2: Import data from importers – Czech Republic ... 166
Table D 3: External trade of organic products - Denmark ... 167
Table D 4: Customs data - France ... 169
Table D 5: Customs data - Germany ... 170
Table D 6: Survey among importers - Germany ... 171
Table D 7: Foreign trade statistics - Germany ... 171
Table D 8: GfK household panel data - Germany... 172
Table D 9: Estimate of production - Germany ... 173
Table D 10: Combined data - Germany ... 174
Table D 11: Import data based on information from importers - Italy ... 175
Figure C 1: Comparison between the geographical distribution of the entire population of the OF&G and Soil Association contact lists (left hand side) and the 1,000 farm sample which was used for the initial mail-out (right hand side) ... 84
Figure C 2: The geographical distribution of the final sample of responses (223) to the England 2013 producer survey ... 85
Figure C 3: Example of producer prices for potatoes in EUR/kg. Source: AMI ... 105
Figure C 4: Example of producer prices for apples in EUR/kg. Source: AMI ... 106
Figure C 5: Example of producer prices for organic milling wheat in EUR/t. Source: AMI ... 106
Figure C 6: Example of producer prices for organic young bulls in EUR/kg carcase weight. Source: AMI ... 107
Figure C 7: Illustration of the data collection concept ... 114
Figure C 8: Illustration of the process of data comparison ... 120
v
Table of Acronyms
Acronym Description
AAM Albanian Association of Marketing (Albania) AEA Aegean Exporters’ Association (Turkey)
Agence Bio French agency for the development of organic farming (France)
AIAB The Italian Association for Organic Agriculture
AMI Agricultural Market Information company (Germany)
APCA Assemblée permanente des chambres d'agriculture, Permanent assembly of the
chambers of agriculture (France)
AssoBio Associazione nazionale delle imprese di transformazione e distribzione di produtti
biologici e naturali (Italy)
BLE Federal Office for Agriculture and Food (Germany)
BMEL Ministry of Food and Agriculture (Germany)
BOLW German umbrella association for the organic sector
CB Control body
CNIEL Centre National Interprofessionel de l'economie latiere, sector organisation for milk
(France)
CPA Classification of products by activity, code for identifying products.
CRDA Commissariat Régional au Développement Agricole (Tunisia)
CSD Certified sales data (UK)
CTAB Centre Technique de l’Agriculture Biologique, Technical centre for organic agriculture
(Tunisia)
CULS Czech University of Life Sciences (Czech Republic)
CZ Czech Republic
DE Germany
Defra Department for environment, food and rural affairs (UK)
DGAB Direction Générale de l’Agriculture Biologique (Tunisia)
EAs Exporters’ Associations (Turkey)
EACCE Etablissement Autonome de Contrôle et Coordination des Exportations (Morocco)
EAN European Article Number / International Article Number or bar code
EEA European Economic Area
EPOS Electronic point of sale
ETO Ekolojik Tarım Organizasyonu, Organic Trade Organisation (Turkey)
EU European Union
Eurostat Statistical office of the EU
FADN Farm Accountancy Data Network
FAM FranceAgriMer, national organisation for agricultural and marine products (France) FAO Food and Agriculture Organisation
FARMA Farm Retail and Markets Association (UK)
FBS Farm Business Survey (UK)
vi agriculture (France)
FR France
GfK Association for Consumer Research (Gesellschaft für Konsumforschung) GIZ Gesellschaft für Internationale Zusammenarbeit GmbH (Germany) GM Green marketing (Czech Republic)
IAEI Institute of agricultural economics and information (Czech Republic)
IAMB Instituto Agronomico Mediterranneo di Bari (Italy)
INSTAT The Albanian Institute for Statistics (Albania)
Interbev Interprofession betail et viande, the sector organisation for livestock and meat
(France)
Interfel Interprofession des fruits et légumes frais, Sector association for the fresh fruit and
vegetable industry (France)
IOA Institute of Organic Agriculture (Albania)
ISMEA Istituto di servizi per il mercato agricolo alimentare, the institute for study, research
and information on agricultural and agri-food market (Italy)
ISTAT The Italian National Institute of Statistics (Italy)
IT Italy
MA Ministry of Agriculture (Czech Republic)
MAEP Ministry of Agriculture and Environmental Protection (Serbia)
MAPM Ministère de l'Agriculture et de la Pêche Maritime, Ministry of Agriculture and
Maritime Fisheries ( Morocco)
MARDWA Ministry of Agriculture , Rural Development, and Water Administration (Albania)
ME Maximum entropy
Med Mediterranean
MEG Market information for Eggs and Poultry (Germany)
MFAL Ministry of Food, Agriculture and Livestock (Turkey)
MIPAAF Ministero per le Politiche Agricole, Alimentari e Forestali, Ministry of Agriculture,
Food and Forestry (Italy) MOA Ministry of Agriculture
MOAN Mediterranean Organic Agriculture Network
N/A Not applicable
NACE Is the “statistical classification of economic activities in the European Community”
which imposes the use of the classification uniformly within all the Member States. NGO Non-governmental organisation
NUTS Nomenclature of territorial units for statistics
OF&G Organic Farmers and Growers (UK)
OFIS Organic Farming Information System (Turkey)
OMSCo The Organic Milk Suppliers Co-operative (UK)
ORC The Organic Research Centre Elm Farm(UK)
ORSA Organic crop statistics Sampling survey (Italy)
PRODCOM PRODuction COMmunautaire. Prodcom uses the product codes specified on the
Prodcom List, which contains about 3900 different types of manufactured products.
vii
RNM Réseau des nouvelles des marchés, Network market news (France)
RPA Rural Payments Agency (UK)
SACL Soil Association Certification Ltd (UK)
SAD Single administrative document
SINAB Sistema d'informazione Nazionale sull'Agricoltura Biologica, national information
system on organic farming (Italy)
SPS Supply balance sheets
SRUC Scotland's Rural College (UK), previously known as SAC
Synabio Le syndicat national des enterprises bio, the national organisation for organic
businesses
Synalaf Syndicat national des labels avicoles de France, the national organisation for
aviculture (France)
TARIC Customs data classification system
UK United Kingdom
UPM Università politecnica delle Marche (Italy)
UTAP Union Tunisienne de l’Agriculture et de la Pêche (Tunisia)
VAT Value added tax
1
Appendix A: Background data collection methods
Production and farm-level prices
In this report “production data” refers to all data concerned with agricultural production including crop areas, livestock numbers, yields and production values as well as production volumes.
Within the EU, data are collected on organic land areas and livestock numbers to satisfy the requirements of reporting to Eurostat, the statistical office of the European Union (see Appendix 2). Generally, these data are collected by control bodies as part of the organic certification process, and are collated by a central organisation (e.g. the national ministry of agriculture or an organisation appointed by them). Some data cleaning/harmonisation may occur and the data are then provided to Eurostat and may also be published nationally. Inspection visits take place on different days on different farms and frequently collect data on cropping areas/livestock numbers on farm on the day of the inspection. The collated data are therefore an amalgamation of these one-off data sets.
Data on organic production yields, values, farm-level prices and other aspects beyond what is currently required by Eurostat1 are much less likely to be collected (Gerrard et al., 2012). Where they are collected, the data collection is usually carried out by survey but since the surveys are not compulsory (unlike the inspection visits) they may have lower response rates.
Domestic trade/retail and retail prices
Estimates of the total organic retail sales value mainly rely on sales data. Most countries use a mixture of different sources to estimate the total value of the domestic market, including household panels, retail panels, specific surveys and expert estimates (see Appendix 2 and Gerrard et al., 2012). In some countries (e.g. Germany and France which both have well-developed organic markets) additional panels that specialise in organic outlets exist. More information about these can be found in Appendix 2 in the sections on French and German retail data and in the Box below that describes the Biovista panel from Germany. For the majority of countries, sales through non-multiple channels can be difficult to track. Some countries use surveys of producers and independent retailers in an attempt to obtain information about such sales (Appendix 2). However, such surveys are not compulsory and so response rates may be low, meaning that the results may not be statistically representative.
If retail data are collected through questionnaires, interviews or consumer surveys, it is important to be aware of the differences between the stated purchase intention and the actual purchase behaviour. Niessen and Hamm (2006), in a review of such a survey, found that of the 19% of households which stated that they buy organic products at least once a month, in fact only 11% actually bought an organic product. This difference was even clearer among the 42% of households who stated that they buy organic products several times a month, where in fact only 28% actually bought organic products more than once a month. On the other hand, Niessen and Hamm (2006) found that fewer households (11%) see themselves as intensive buyers (more than once a week) than there actually are (18%).
Household panels
In recent years, household panel data have been mostly collected with the help of digital scanners where consumers scan the EAN-code (European Article Number / International Article Number or bar code) of their bought products at home (Niessen, 2008). Some multiples and specialised stores are also able to automatically scan the products at the counter in store, link them to the corresponding
1
2
household and send the data directly to a data house for analysis. Products like loose vegetables and fruit, unpacked cheese, bread or eggs etc. that do not carry an EAN-code need to be scanned by the consumer separately and manually at home, using a code-book.
Table A 1: Advantages and disadvantages of household panels
Advantages Disadvantages
In interviews consumers tend to over-estimate their organic purchases, possibly because their answers are socially motivated (Schantl, 2004; Michels, 2004). Since household panels do not involve face-to-face interviews this social motivation is reduced.
There may be missing data on products consumed before they could be scanned, such as take-away meals, coffee and other beverages (Buder, 2011; Niessen, 2008).
Household panels provide quantitative data, collected over long time periods and therefore allow trends to be analysed (Schantl, 2004).
There may be a lack of full coverage for specific marketing channels. Also coverage may be problematic for specific products that are seen as socially
undesirable (e.g. alcohol, sweet snacks). Companies providing such data very often record
socio-demographic variables for their panel members and so it is possible to obtain information about the
households and purchasing behaviour (Schantl, 2004).
“Panel effects” can occur, whereby the act of noting their purchases over long periods of time causes consumers to alter their shopping behaviour (Schantl, 2004).
Comparison of organic and non-organic food retail is easier, as the same panel and method can be used for both (Michels, 2004).
Source: Own summary based on various studies
Retail panels
Retail panels provide data on purchases from the viewpoint of retailers themselves, rather than the consumers. Their data is often based on EPOS (electronic point of sales). Some EPOS data may cover all of the multiples in a country (especially where they are relatively few in number) whereas others may only cover a sample of them.
Table A 2: Advantages and disadvantages of retail panels
Advantages Disadvantages
They tend to give high coverage of multiple retailers. Limited or no coverage of independent retailers and
direct sales from producers. Retail panels provide quantitative data, collected over
long time periods and therefore allow trends to be analysed.
Errors of classification when retailers set up their EPOS system will be carried through into the panel data and so organic foods may be incorrectly recorded as non-organic and vice versa.
Comparison of organic and non-organic food is straightforward, as they are collected with the same instrument.
Data from such panels is generally only available at a cost, as these are commercial panels carried out by market research companies.
Compared to household panels, they cannot give information about the consumers.
Source: based on Michels (2004)
Specific weaknesses of panel data when used to estimate the organic market are:
3
area than younger ones (7-9%). The researchers found that consumers made most mistakes (around 35%) when buying the products through direct marketing, on-farm sales or markets (in fact, more than 70% of all classifying mistakes made in egg sales occurred when bought through direct marketing, 79% for strawberries and 77% for potatoes); and around 5-15% of the products bought in supermarkets or discounters were classified wrongly.
Panels are selected to be representative of the total food market. Even in most well developed organic markets like that of Germany, the organic food market covers less than 10% of the total food market. Because of the small importance of the organic market relative to the total market, the number of households recording organic purchases in a specific product category can be very small (depending on the size of the panel). Small errors, for example in product classification, could potentially have a large distorting impact on the total value of the organic food market.
It is known that a relatively small proportion of households account for a relatively large proportion of total spend in the organic food market (e.g. 20% of households account for 80% of spending in the UK (Buder et al, 2010; SA/WDA/OCW 2004)) which can only partially be predicted from demographic variables (education, age etc.). If, in the composition of such a panel, the number of high spending organic households is over or under represented, this could lead to significant errors in estimating the total market value.
The panel data include information about all food products, not just organic products. Each organic product line has to be classified as such in order to be recorded. Errors in classification can occur both at the level of data analysis in the data houses (mainly for bar-coded product lines), and at the level of the household-panel members (shoppers) for non-bar-coded products.
Bien and Michels (2007) carried out a survey of 500 households from a panel who were asked to keep additional records of their organic purchases in addition to the panel returns. The authors, on behalf of ZMP (Central Market and Price Report Office) and the panel company GfK, used these data to develop a specific methodology for fresh products that is able to minimise misclassifications, based on price differences. For purchases of fresh products a data check is used such that they are only accepted as organic if their price is higher than the specific non-organic threshold price, set on the basis of the monthly price reporting published in Germany. The results of the comparison also provide insights into suitable methods of weighting results of different German panels in order to estimate the total organic market value. This relies on the cross-checking of data from the different panels with other sources (including expert estimates). However, transferring lessons learned from one country to the other is made more difficult because the data houses do not necessarily use the same methods in all countries and data used for cross checks are not necessarily available.
Sales through farm shops and farmers’ markets
4
farmers’ markets and farm shops with the additional problem of having to separate out organic sales from non-organic sales.
Catering
General catering sales can be split into public catering (e.g. in schools, hospitals, armed forces canteens, etc.) and private catering (e.g. in workplaces and restaurants/ hotels). However, in some countries the division may differ, e.g. in France catering is split into collective catering (this covers any meal served away from the house which is largely paid for by the service provider; public and private. It would include schools, universities, hospitals, retirement homes, prisons, work canteens etc.) and commercial catering (e.g. restaurants).
Retail prices
Retail prices can be collected as part of retail/EPOS or household panel data. Alternatively retail prices can be recorded across a wide range of shops by researchers. As part of the OMIaRD project, prices at consumer-level were surveyed in 19 countries (Hamm et al., 2002; Hamm and Gronefeld, 2004). At least 10 shops were selected in each country, from different regions, to reflect possible price differences. The shops were selected to reflect the importance of different sales channels in the country surveyed (e.g. where the relative importance of general food shops, specialised organic food shops and direct sales were 50%, 30% and 20% respectively then in a sample of 10 shops, 5 would be general shops, 3 specialised organic shops and 2 would be farm shops). The prices were recorded for a number of products including cereal products, livestock products, fruit and vegetables. Conventional prices were collected at the same time as organic prices for the same/similar products and in comparable sales channels so that the organic price premium could be calculated. Hamm and Gronefeld (2004) note that, for comparison between countries it is more meaningful to compare price premiums rather than absolute prices as absolute prices are affected by national rates of VAT (value added tax), the relative importance within each country of different sales channels and the competitive situation between the organic and conventional sectors in each country.
International trade
Data on international trade (import and export) outside the EU, not necessarily recording whether or not the product is organic, is generally collected by the customs/revenue authorities (imports) or other authorities of a country (e.g. for official trade statistics) and makes use of the EU’s TARIC classification which is used for customs data. However these data are not generally made public. If it is possible to access such data, there are two main challenges in using it to investigate international trade in organic products:
1. Whether or not a product is organic is not always recorded within the customs documentation or the data. It can be helpful to at least investigate data from 100% organic companies.
2. Exports and imports within the EU may not be recorded. In fact, it may be the case that only exports and imports involving third countries with no equivalency are recorded.
The Organic Regulations2 set out procedures for importing organic products from non EU countries into the EU, which are enforced as part of the Customs rules. The Regulation specifies two different approaches:
2
5
1. production and control requirements comply exactly with Regulation (EU) 834/2007. Proof of compliance is provided through inspections of control bodies that are authorised by the EU. Applications for recognition under this option have to be submitted by 31 October 2014.This compliance approach is not yet implemented and the detailed rules are currently under discussion.
2. production rules and control requirements are equivalent to the EU rules. Equivalency means that applied systems and measures “are capable of meeting the same objectives and principles by applying rules which ensure the same level of assurance of conformity.” (Art 2 of Regulation (EC) 834/2007. Eequivalency is recognised either by bilateral agreements (i.e. the country in question is included in the EU list of equivalent third countries) or by control bodies (approved and supervised for this purpose by the EU Commission). For a transitional period until 1 July 2014 equivalence can also be confirmed by Member States authorities at the request of an importer located in the EU (import authorisation).
To make the organic status of an imported item clear it is necessary to add it to the customs documentation; this has been done in Italy, France and Serbia, for instance, by adding information on the organic status of a product to box 44 of the SAD (Single Administrative Document).
Import authorisations were widely used under the previous organic regulation (EEC2092/91) (Sanders, 2013, Chapter 3). EU Member States have been granting around 4.000 import authorisations annually (European Court of Auditors, 2012) and there are around 1.600 approved importers in the EU, mostly located in Germany, the Netherlands, the United Kingdom, Denmark, Sweden and France (Sanders, 2013). Import authorisations have been explored as a source of data on imports into the EU.
An alternative approach for collecting data on international trade, is to survey various organic operators (importers, exporters, organic producers, processors, wholesalers and retailers) regarding amounts that they import/export. This has the advantage that it will give data on intra-EU trade as well as trade outside the EU. This approach would require reasonable response rates to the surveys which may be difficult to achieve if they are not compulsory. Both Agence Bio and AMI used this approach but it was more straightforward for Agence Bio as they could contact all the main organic market operators since these were identified using the notification system in use in France (See Appendix 3). For AMI this was more difficult and they estimate that their survey was sent to one third of all importers and of those one third responded. The Czech Republic also carry out a survey of actors within the organic market which could be used to provide data on international trade especially within the EU.
6
Appendix B: Current status of data collection as at 2012/2013
In the first phase of the case study work, a report was produced for each country, describing the current status of data collection within the country, broken down by the main topics of production data (areas/numbers, volume and value), retail market (volume and value), prices (farm gate and consumer), and import and export data. Summarised versions of the reports can be found in Appendix 2. The reports were based on information obtained in earlier parts of the OrganicDataNetwork project (e.g. the survey of market data collectors), discussion with stakeholders within the individual case study countries, and desk-studies. The reports include a table for each data type, which summarises the data collection against Eurostat’s data quality dimensions of accuracy, coherence and comparability, accessibility, and timeliness (Eurostat, 2012).
In general, production-related data (especially areas/numbers of livestock) were most commonly collected (usually by CBs as part of the certification process) and international trade data were very rarely collected. With regard to market data, data on sales through multiples tended to be available albeit at a cost (usually through market research companies employing household or retail panel methods to follow the market); whereas data on sales through specialist shops, farmers’ markets and catering sales were scarce to non-existent in most of the case study countries. International trade data were not often collected and where they were available it was often only with regards to non-equivalent third countries. Table B-1 summarises the data collection in the case study countries with the remaining Appendix B providing much greater detail.
7 Table B 1: Data collection in case study countries in 2011/12
UK DE FR CZ IT
Production data Crop areas and livestock numbers. Producer surveys in Scotland and Wales.
Crop areas and livestock numbers. Volume data collected by AMI are not yet officially recognised.
Crop areas and livestock numbers. Volume data are collected by Agence Bio from a number of sources.
Crop areas and livestock numbers. Volume data and prices at farm level.
Crop areas and livestock numbers. Domestic trade/retail Value data collected by retail panel and surveys of multiple retailers and independents. GfK household panel data, Nielsen retail panel data for multiples, BioVista and Klaus Braun for organic shops. Prices are collected on a monthly basis by AMI using GfK household panel data.
Survey for specialised supermarkets, for direct sales by farmers and processors and for supermarkets. Symphony IRI data for general supermarkets; Kantar data for fruits, vegetables and eggs.
Questionnaire in four formats: producers, distributors,
producer/distributors and retailers. Retail price data are collected every two months by the Green Marketing Agency.
ISMEA makes use of GfK-Eurisko household panel data whereas AssoBio makes use of expert opinions and company data.
International trade
Data are not currently published.
Import data collected in a research project for 2009/10 and again, using the same methods, for 2010/11 and 2012/13.
Agence Bio and AND international estimate the value of imports and exports using a survey of processors and other
organisations.
Data are not currently published.
Data on imports are collected and published by SINAB but do not cover trade from equivalent third countries. Farm-level prices Limited data collected as part of Scottish and Welsh producer surveys. Soil Association publishes some expert estimates on a regular basis
Collected and published weekly by AMI.
FranceAgriMer collect some data on prices of milk, fruits, vegetables and cereals.
Collected as part of the surveys that collect production data. Collected annually by ISMEA. Italian commodity exchanges also provide weekly price data for cereals,
8
UK (by Catherine Gerrard
3)
The information below is based on discussions which took place at a meeting of UK data collectors held at the Organic Research Centre (ORC) on 18th July 2012 supplemented with information received during a meeting at the Soil Association on 12th November 2012 and at a meeting of Defra and the UK control bodies (CBs) on the 20th November 2012 at ORC.
Note that in 2013 the Scottish Agricultural College (SAC) became Scotland’s Rural College (SRUC) after merging with three other agricultural colleges in Scotland. Also in 2013, the Soil Association made the decision to move from using Kantar WorldPanel data (as it had done previously and as described below) to using Nielsen electronic point of sale data.
Production data
Production area/livestock number data
Production data, particularly area and number data (areas of crops, numbers of livestock) are more commonly collected than other data types. The data are collected, with respect to organic farming, by the various control/certification bodies (Organic Farmers and Growers Ltd, Scottish Food Quality Certification, Organic Food Federation, Soil Association Certification Ltd, Biodynamic Agricultural Association, Irish Farmers and Growers Association, Organic Trust Ltd, Quality Welsh Food Certification) as part of the certification process and are fed through to the Department for Food and Rural Affairs (Defra) who pass the data to Eurostat and publish a UK document on organic farming statistics, “Organic Statistics”. The data are sent to Defra in January of the year following the year to which they refer (e.g. 2011 data forwarded to Defra by January 2012) to form the annual return required of Defra under Eurostat Commission Regulation No. 889/2008. The data published by Defra currently include land areas (cereals, other arable crops, and fresh vegetables), livestock numbers (poultry, cattle, pigs) and producer numbers. All data includes fully organic and in-conversion holdings.
These are the data collected in annual inspections carried out by the CBs. As a result, each set of data from an individual farm is based on a snapshot of that farm on the particular day it was inspected and the collated data do not represent the whole UK situation on a particular day as each inspection could have been carried out on a number of different days throughout the year. A further issue with the data is that, while Defra do provide a template, some CBs use categorisations which are different from those used by Defra. As a result of the lack of harmonisation, the Defra statistics department must spend some time cleaning the data which impacts on the timeliness of their publication. The publication is usually issued in the summer of the following year.
Additional data on production areas and numbers may also be collected by Defra as part of their Agricultural Census/Survey and Farm Business Survey (however the organic sample can be very small) and by Scotland’s Rural College (SRUC) and Aberystwyth University during their producer surveys.
9
Table B 2: UK production (livestock number and crop area) data quality assessment
Quality assessment Description Accuracy
Data source CB collated by DEFRA
Methods of data collection Inspection records
Sample size All certified farms
Estimated coverage 100%
Comments Collection through the year, checked by DEFRA
Coherence and comparability Coherence and comparability of the data collection method
Similar data collection methods are used for organic throughout Europe Non-organic data are census based;
Disaggregation of data Data are disaggregated into each of the countries within UK.
Accessibility
Voluntary or compulsory to provide data
Compulsory: Data are collected as part of control process and CBs have to provide data to DEFRA
Availability of data Summary statistics are available for free
Format of publication Summary statistics are published on-line
Timeliness Up to 6 months delay
Frequency of data collection Collected annually for 31 Dec closing date
Frequency of publication Annual publication scheduled in July of the following year
Comments
Production volumes, yields, and value data
Organic production data (volume and value) is collected by Scotland’s Rural College (SRUC) and Aberystwyth University as part of their producer surveys. There is currently no annual survey of organic producers in England or in Northern Ireland.
As part of an organic market link project funded by the Scottish Government, SRUC produces an annual report based on a survey of organic producers. The aim of the project is to improve information flow between producers and the marketplace, and to improve the marketing of Scottish organic produce. It particularly focuses on grain and red-meat produce. In 2011-12, the survey collected information on production of beef, lamb, pigs, table birds, eggs, grain, pulses, fruit, and vegetables and accounted for 85% of Scottish organic producers. Similar data are collected every year4. The survey results are not extrapolated to cover all producers.
The survey is a postal survey sent to Scottish organic producers and collects data for the year running from July to June (e.g. the 2011-12 survey ran from July 2011-June 2012). 50% of the survey data are collected via post, 50% is collected via phone. Broken down to a monthly basis, the producers are asked to provide data on what they have sold in the last 6 months and what they expect to sell in the following 6 months.
4
10
The annual report gives a sector and market update, based on contact with the trade and information from the SRUC’s annual organic producer conference, and then gives production information based on the survey responses. The production information which is collected includes:
monthly production patterns,
geographical production patterns,
information on the number of producers and how it compares with previous years,
information on grains and pulses about the breakdown of production between home-use, and produce available for trading,
information about producer’s plans with regards to remaining as licensed organic producers. The 2011-12 survey also provides a plot of the organic premium over conventional prices for finished beef cattle and finished lamb on a monthly basis from January 2011- February 2012.
Similar surveys are carried out in Wales as in Scotland, but they are carried out in November of each year. In contrast with the Scottish data, the Welsh data are not partly forecast (i.e. consists entirely of actual figures). It is also based on a postal survey, followed up with phone calls to encourage missing respondents (although for the 2011 survey onwards it was decided to conduct the survey entirely by phone call), and achieves a 60-70% response rate for the main sectors. The survey response rate is used to extrapolate up the data to give an estimate of the land areas and livestock numbers for all organic production in Wales. This gives an estimate but is subject to potential error so a full census would give a more accurate set of values (but is not possible on a voluntary basis).
The annual report on the Welsh survey gives information about5:
organic certified land areas (in comparison with Defra data to ensure consistency), livestock numbers,
sales data (including the numbers of organic livestock being sold as conventional, sales routes),
livestock feed and fodder (concentrate feed use, proportion bought-in, prices and availability as rated by the producers),
agri-environmental scheme participation
and producer views of the future (e.g. opinion about current prices, plans to leave the organic sector).
The data are disaggregated into data on cereals, other arable/fodder crops, potatoes, horticulture (excluding potatoes), tillage, temporary grass, permanent grass/rough grazing, woodland/other, beef cows, dairy cows, other cattle, ewes, other sheep, laying hens, table birds, other poultry, sows, other pigs, other livestock. The livestock are also split, for some questions, into breeding, growing and replacement livestock. Price data are collected for beef and lamb (broken down by month) and also for eggs (an average figure was given in the 2011 report but it was also commented that there is a large variation in prices) and milk (where an estimate price is given although it is commented that organic milk prices are not readily available due to commercial sensitivity).
Additional production volume and value data may be obtained from Defra’s Agricultural Census/Survey and Farm Business Survey. However, these do not cover just organic farming and therefore the organic sample can be very small.
5
The most recent market report covers the 2013 survey and is available at
11
In the near future Eurostat will require some yield data (e.g. volume data) for livestock production in addition to the livestock numbers and crop areas that they currently collate. Defra currently plans to estimate these with the help of experts so as not to over-burden the CBs with further data requirements.
Table B 3: UK production (volume and value) data quality assessment
Quality assessment Description Accuracy
Data source Scotland’s Rural College (SRUC) and Aberystwyth University/Organic Centre Wales
Methods of data collection Telephone surveys
Sample size Wales 2012 survey: 647, Scotland 2012-13 survey: 377
Estimated coverage Wales: 60-70%, Scotland: 81%
Comments The main gap is the lack of similar data for England and Northern Ireland.
Coherence and comparability Coherence and comparability of the data collection method
The Welsh survey asks about production in the last 12 months and future intentions with regards to remaining organic.
The Scottish survey asks about production in the last 6 months and predicted production in the next 6 months.
Disaggregation of data Split by enterprise (e.g. cropping, beef, sheep)
Accessibility
Voluntary or compulsory to provide data
Voluntary.
Availability of data Results are published and are available from the webpages of the data collecting institutes.
Format of publication Online reports.
Comments No such data exist for England and Northern Ireland.
Timeliness
Frequency of data collection Annual.
Frequency of publication Annual.
Comments Publication is within a few months of data collection.
Domestic trade/retail data
Retail volumes and values
Retail value data are collected by the Soil Association using Kantar retail data and additional in-house surveys of Soil Association licensees. These data form the basis of their Organic Market Report.
In 2013, the Soil Association made the decision to move from using Kantar WorldPanel data (as it had done previously and as described below) to using Nielsen electronic point of sale data.
12
missed and also that purchases from e.g. farm shops, box schemes may be missed. There is a booklet of additional codes for loose items that the households can use but it is possible that some organic purchases of this type are not recorded. Some alternatives to multiple sales are likely to be picked up by Kantar Worldpanel data (e.g. they do pick up sales through Ocado – a UK-based online supermarket). The Kantar Worldpanel data can be used to give price trends as well as trends in shopping habits. It is generally not broken down on a regional basis as regional disaggregation can lead to small samples and questionable representativeness of the results. Also, Kantar Worldpanel only covers households.
The Soil Association carries out a survey of their top 100 licensees by turnover. Among other questions they are asked to give an indication of what proportion of their turnover comes from multiples, independent retail, and catering. Thus the responses from these larger licensees can be used to inform some of the categories of the Organic Market Report.
The Soil Association produces an organic market report annually. The market report data are split into 4 main sub-categories:
Multiples
Independent retail
Health and Beauty
Textiles
These will be discussed in turn as the data collection/analysis approach differs for each. Multiples
A direct relationship exists with the multiples and therefore the Soil Association can get actual figures for organic sales for the calendar year by January of the next year. Usually they get them from at least 5 of the main supermarkets. They believe that >75% of the market is covered by the responses that they get. The Soil Association used to request a detailed breakdown of these figures but some respondents gave very detailed figures whereas others gave just a total and so they ceased requesting the detailed breakdown as it put a lot of pressure on the more diligent organisations to provide data that then couldn’t be used. The data are always aggregated and they never identify individual turnover, only the rate of growth.
Soil Association use actuals from previous years multiplied up by the growth rates supplied by Kantar to cover those multiples that have not given actual figures and to double-check the actuals they have received. In general they take the view that absolute values from Kantar are less accurate but the trends are accurate.
The other use of Kantar data the Soil Association make is that once they have tallied up the biggest seven multiples they use Kantar’s assessment of the market share for multiples to gross that figure up to give the full multiple total. E.g. if the biggest seven multiples cover 87% of the multiples market and have a total organic sales figures of x then the total organic multiples sales figures for the market report will be calculated as x*100/87.
Independents
13
independents. The survey doesn’t get participants to report precise turnover but rather the band that their turnover is in (in the future they could be asked for the precise actual turnover figures). Then the proportion in each band is used to extrapolate performance figures for the sector as a whole. Since small independents are only a small section of the market the lower confidence in their data is not considered cause for concern. In general they consider box sales and home delivery to be the most robust section of the independents’ data.
In the survey of independents the Soil Association ask about whether they make sales through farmers’ markets, box schemes, farm shops and /or high street shops. However, very few respond that they make sales through farmers’ markets or farm shops. Thus, the data are quite minimal in this area. In the past a survey was carried out by FARMA (Farm Retail and Markets Association) of their affiliated farm shops and markets which gave a total estimated turnover figure and an idea of what proportion of sales were organic. The questions in the survey were: How many regular stall holders are there? How many are organic? What is the total turnover of the market? The total turnover was multiplied by the proportion of stall holders that were organic to give an estimate of organic turnover. Since then a % growth or decline figure is applied to this estimate on a yearly basis and double-checked against the returns of the Soil Association’s survey of independents.
[image:20.612.65.522.406.711.2]This “other independent retailers” category includes Planet Organic (the UK's largest fully certified organic supermarket) and As Nature Intended (a high street retailer of organic food)who provide some actuals. Kantar data includes Londis, Mace and Spar (small supermarkets) who are also included in this sector. Each year the rate of growth/shrinking of the market is applied to the previous year’s figure. The Kantar data, actuals and an idea of how independent high street shops are developing are combined to provide the growth rate. The suspicion is that this sector may be over-valued.
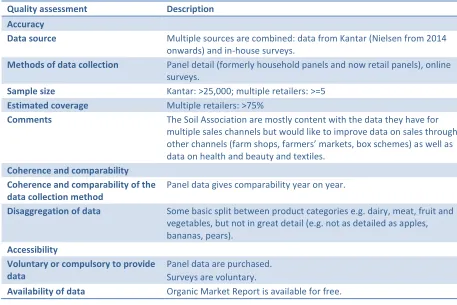
Table B 4: UK retail data quality assessment
Quality assessment Description Accuracy
Data source Multiple sources are combined: data from Kantar (Nielsen from 2014 onwards) and in-house surveys.
Methods of data collection Panel detail (formerly household panels and now retail panels), online surveys.
Sample size Kantar: >25,000; multiple retailers: >=5
Estimated coverage Multiple retailers: >75%
Comments The Soil Association are mostly content with the data they have for multiple sales channels but would like to improve data on sales through other channels (farm shops, farmers’ markets, box schemes) as well as data on health and beauty and textiles.
Coherence and comparability Coherence and comparability of the data collection method
Panel data gives comparability year on year.
Disaggregation of data Some basic split between product categories e.g. dairy, meat, fruit and vegetables, but not in great detail (e.g. not as detailed as apples, bananas, pears).
Accessibility
Voluntary or compulsory to provide data
Panel data are purchased. Surveys are voluntary.
14
Format of publication Organic Market Report (hard copy and online)
Timeliness
Frequency of data collection Annual
Frequency of publication Annual
Comments Data publication is very timely – publish in March with data for the previous calendar year.
Health and Beauty
The health and beauty sector figures are calculated using the turnover actual figures from SACL (Soil Association Certification Ltd) and aggregating the data to get the overall figure. The data are corrected for export figures (since the export market is stronger than the UK domestic market) and for sales through wholesale rather than retail. Retail sales are left as they stand. Wholesaler sales are increased by an amount which reflects retail mark-up before being aggregated with the other figures to give the overall total.
Textiles
The UK organic textile sector consists mostly of cotton with a small element from wool sales. Wool sales are easily covered as the wool board gives good, accurate figures. Cotton sales figures are produced by adding the growth rate of the market to a baseline figure from several years ago. The issue with cotton data comes from the fact that some products are entirely organic but others may include organic cotton in a mix of cottons and so the product is not marked as organic for retail purposes.
Catering volumes and values
Catering market data (values) are estimated for the Soil Association’s Organic Market Report, however, this is an area where they feel that there is room for improvement. For the companies involved in catering, the organic market does not cover a large proportion of their business and they have no time to give figures. However, since they have no differentiated strategy for organic food, the market report uses the percentage increase or decrease for the catering market as a whole as the likely rate of increase or decrease for the organic sector within that market (the effect of the Soil Association’s Catering Marque is currently small). Thus the figure is based on a growth rate taken from the market as a whole and double-checked against the survey of independents, applied to the proportion of the catering market that is organic. The Soil Association believe that this approach means that this sector may be undervalued in the market report (several fast food/coffee chains now use organic milk e.g. MacDonalds, Pret-A-Manger, and adding up their sales alone may get near to the figure reported in the Market Report).
Table B 5: UK catering data quality assessment
Quality assessment Description Accuracy
Data source Soil Association
Methods of data collection Estimate based on previous value and movement in overall catering market.
Sample size N/A
15
Comments Soil Association feel there is room for improvement, but it is difficult to obtain figures from the main actors within the market.
Coherence and comparability Coherence and comparability of the data collection method
Estimate
Disaggregation of data None
Accessibility
Voluntary or compulsory to provide data
N/A
Availability of data Published in annual Organic Market Report by Soil Association.
Format of publication Online and hard copy report.
Timeliness
Frequency of data collection N/A
Frequency of publication Annual
International trade data
International trade data for organic products is not currently collected within the UK. Prices
Price at farm level
Data on organic prices at farm level for Scotland and Wales are collected annually by SRUC and Aberystwyth University as part of their producer surveys.
The Soil Association also provides some price data on their website. They collect monthly to quarterly producer prices for fruit and vegetables, eggs, dairy, meat, and cereals. The frequency depends on the product. Price collection for fruit and vegetables, eggs, and dairy includes wholesale prices and also farm shop prices and retail prices. The Soil Association collates these data from various sources: surveys of key producers, traders, feed mills, and slaughterhouses, and a webpage where retail prices are compared.
Table B 6: UK farm-level price data quality assessment
Quality assessment Description Accuracy
Data source SRUC and Aberystwyth University / Organic Centre Wales
Methods of data collection Telephone surveys
Sample size Wales 2012 survey: 647, Scotland 2012 survey: 377
Estimated coverage Wales: 60-70%, Scotland: 81%
Comments The main gap is the lack of similar data for England. Only limited price data are collected.
Coherence and comparability Coherence and comparability of the data collection method
Only limited price data are collected e.g. for milk and eggs. Other enterprises are asked whether organic price is sufficient to continue in organic production.
16
Quality assessment Description Accessibility
Voluntary or compulsory to provide data
Voluntary.
Availability of data Results are published and are available from the webpages of the data collecting institutes.
Format of publication Online reports.
Comments Timeliness
Frequency of data collection Annual.
Frequency of publication Annual.
Comments Publication is within a few months of data collection.
Retail price
Data on organic retail prices are collected by Kantar Worldpanel (replaced since the 2014 market report by Nielsen) but at present are not evaluated separately as part of the Soil Association’s market report. Data gaps and issues
The main data gaps and issues that exist at present in the UK appear to be:
1. There is a lack of harmonisation in Certification Bodies’ (CBs) data that are provided to Defra. This results in a time delay in publication of such data that impacts on its usefulness to stakeholders.
2. There is no producer survey carried out in England or Northern Ireland and the Welsh survey may be at risk due to funding constraints. Producer surveys can collect information such as the number of organic animals being sold as conventional, producer intentions for the future, and prices received by producers, which can provide additional information on the market and potential future market trends. For example, large numbers of producers planning to leave organic certification may imply a future reduction in supply of certain organic products, which in turn may result in higher costs to consumers.
3. There is limited data on sales through non-multiple sales channels such as box schemes, farm shops, and farmers’ markets. It has been suggested that sales of organic produce through the multiples may partly drop due to sales through other routes increasing. However, it is difficult to analyse trends to see if this is the case due to insufficient year-on-year data on sales through these alternative routes.
4. There is no data on organic products in supermarkets: line availability (range) and product availability on the shelf. It has been postulated that organic sales are limited by availability, but the lack of data on this makes it impossible to test the correlation.
5. There is limited data on catering sales.
17
Germany (by Diana Schaack
6)
AMI publishes an annual report “Markt Bilanz Ökolandbau”. This book (approx. 200 pages) contains a market overview of the different organic markets in Germany, and also a European market overview that is compiled annually by FiBL and AMI. The book contains enormous numbers of data tables on:
1. Sales volumes and values of organic fresh products – mainly according to GfK data. 2. Development of organic farming and production.
3. Producer prices - monthly and annual time series. 4. Consumer prices.
5. EU and Europe – retails sales data (total only) and production.
Production data
Production area/livestock number data
Production data, particularly crop areas and livestock numbers, are more commonly collected than other data types. In accordance with EU regulation No. 889/2008 of 5 September 2008, the Federal Office for Agriculture and Food (BLE) collects data on the total organic agricultural land and the number of organic enterprises in Germany to deliver to Eurostat. As Germany is a federalist country, each of the 16 federal states have to collect these data from the control bodies and deliver a single federal state dataset to the BLE every year by the end of April. BLE then has got time until the end of June to check and match this data and send it to Eurostat. The federal states collect the data from the control bodies as part of the certification process. Unfortunately the Ministry of Food and Agriculture (BMEL) has, until now, only obliged the control bodies to deliver data about the total agricultural land (in conversion and converted together) and the number of enterprises. There is no split into conversion area and fully converted area, and no data on land use, livestock numbers, or production volumes although this is required by the EU regulation. However BLE annual production data gives information on the total organic agricultural land because it works like a census.
The fact that these data are not disaggregated into land use types and do not contain data on animal husbandry is the reason why since 1999 the former ZMP (Central Market and Price Report Office) and since 2009 AMI directly collect data from the control bodies in Germany about land use and animal husbandry (AMI structural data survey). Because data delivery is voluntary except for an expense allowance, not all the control bodies take part in this annual survey. Usually approximately 10 to 12 control bodies take part, which cover about 85% to 90% of the area and 80% to 85% of the farms. The missing area and number of animals has to be estimated by AMI according to the growth rates delivered by the participating control bodies. AMI collects data about land use and the livestock numbers annually and, together with the producer prices and average yields of the different crops, this allows the farm gate value of organic production to be estimated.
Additionally, the Federal Statistical Office collects crop area and livestock number data every three years, but not in as much detail as the survey by AMI. Instead it shows a regional split into the federal states. From 2012 onwards the statistical office also collects detailed data on fruit and vegetable production (area and volumes) which is more detailed than data from the structural data survey.
18
Furthermore, the Federal Statistical Office collects annual data on the number of organic laying hens within their annual livestock census. Moreover, there are monthly data on organic milk deliveries collected by the Federal Office for Agriculture and Food (BLE) within their milk delivery statistics.
ZMP and AMI have developed a database that makes data comparable over the years and also between the different control bodies.
Table B 7: German production (crop areas and livestock numbers) data quality assessment
Quality assessment Description Accuracy
Data source Control bodies of the 16 federal states and AMI survey data
Methods of data collection The 16 federal states deliver the single federal state data (area and number data) to the BLE.
Land use and animal husbandry survey (AMI structural data survey among the CBs).
Sample size BLE 100 % for the total area, AMI 85-90 % of land use types
Estimated coverage BLE 100 % % for the total area and number of farms, Voluntary survey - 85% to 90% of the area and 80% to 85% of the farms are covered (based on data from 10-12 CBs)
Comments There is no data on conversion area, land use, or the numbers of animals in the official data collection by BLE. Therefore the AMI
structural data survey was developed with coverage of 85 to 90 % of the area. The gap between the total agricultural land and the land use that has to be estimated as discussed above.
The missing area and number of animals is estimated by AMI according to the growth rates of the participating control bodies.
Coherence and comparability Coherence and comparability of the data collection method
Part of the certification process, survey. Similar methods based on CB data are used in all countries
Disaggregation of data
Comments ZMP and AMI have developed a data base that makes data comparable over the years and also between the different control bodies.
Accessibility The 2014 AMI “Markt Bilanz Ökolandbau” (in German) can be ordered for EUR 206 (print version) or EUR 303 (digital version). Only production data is available for free here: http://www.ami-informiert.de/ami- maerkte/ami-weitere-maerkte/ami-maerkte-oekolandbau/bio-strukturdaten.html
Voluntary or compulsory to provide data
Total agricultural land and the number of enterprises is compulsory (collected by BLE).
AMI survey is voluntary.
Availability of data Published online and in print.
Format of publication Annual Report “Markt Bilanz Ökolandbau“
Timeliness Total area data is published by the end of June in the following year. Results of the structural data survey are published in around September of the following year.
Frequency of data collection Annually: Data delivery from the 16 federal states to BLE by the end of April, BLE then has until the end of June to check and match this data and send it to Eurostat.
19
Production volumes, yields, and value data
The estimate of the production volume of a few basic product groups such as vegetables, fruit, potatoes and also pork, beef and poultry meat is part of the annual AMI structural data survey. The production is calculated using area data and average yields or carcase weights in that particular year. For cereals, AMI carries out an additional survey among farmers, with the help of the German Farmers Association, asking for their average yields of the different crops in the federal states. Production volume is calculated using the yields and area data in the different federal states.
Another part of the AMI structural data survey is a calculation of the production value on the basis of farm gate prices that AMI collects for many products.
Until now all the data collected within the AMI structural data survey is not delivered to Eurostat, although land use and livestock number data are required by the EU regulation. AMI has tried to convince the Ministry of Food and Agriculture (BMEL) to make the data officially recognised but it seems to be a long way from a decision, even taking into account that the Federal Office for Agriculture and Food has been financing the survey since 2010.
[image:26.612.62.549.342.724.2]The Federal statistical office has included organic berries and vegetables into their overall data collection in 2012 and 2013 and determined production volumes as part of this.
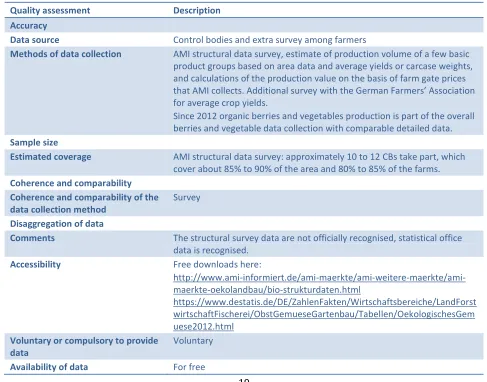
Table B 8: German production (volumes and values) data quality assessment
Quality assessment Description Accuracy
Data source Control bodies and extra survey among farmers
Methods of data collection AMI structural data survey, estimate of production volume of a few basic product groups based on area data and average yields or carcase weights, and calculations of the production value on the basis of farm gate prices that AMI collects. Additional survey with the German Farmers’ Association for average crop yields.
Since 2012 organic berries and vegetables production is part of the overall berries and vegetable data collection with comparable detailed data.
Sample size
Estimated coverage AMI structural data survey: approximately 10 to 12 CBs take part, which cover about 85% to 90% of the area and 80% to 85% of the farms.
Coherence and comparability Coherence and comparability of the data collection method
Survey
Disaggregation of data
Comments The structural survey data are not officially recognised, statistical office data is recognised.
Accessibility Free downloads here:
http://www.ami-informiert.de/ami-maerkte/ami-weitere-maerkte/ami-maerkte-oekolandbau/bio-strukturdaten.html
https://www.destatis.de/DE/ZahlenFakten/Wirtschaftsbereiche/LandForst wirtschaftFischerei/ObstGemueseGartenbau/Tabellen/OekologischesGem uese2012.html
Voluntary or compulsory to provide data
Voluntary
20
Format of publication Annual report
Timeliness
Frequency of data collection Monthly for animals for slaughter/ Annually for cereals production
Frequency of publication Annually
Domestic trade/retail data
Retail volumes and values
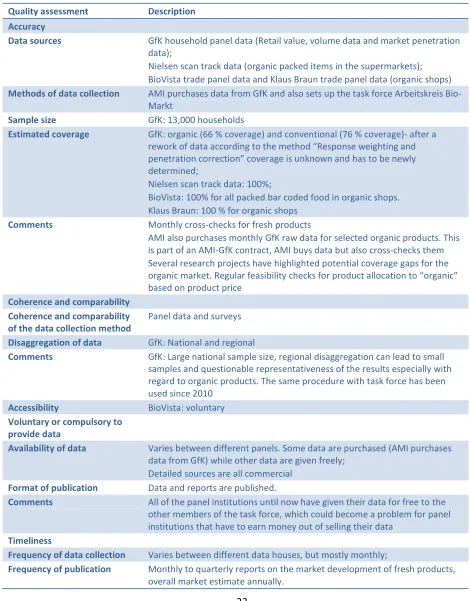
Retail value, volume data and market penetration data are collected by AMI using GfK household panel data, which are the basis of their monthly to quarterly reports on the market development of fresh products. During the year, AMI regularly analyses and cross-checks GfK household panel data for fresh products. AMI purchases monthly GfK raw data for organic and conventional meat, meat products, poultry, eggs, cheese, fruit, vegetables, potatoes, bread, vegetable oils, milk, and milk products. This is part of an AMI-GfK contract; AMI buys data but also cross-checks them according to promotions in the multiple chains and also with the development of the product markets.
The proportion of the overall market that consists of organic produce is calculated according to annual consumption data from the Federal Statistical Office.
The German organic market is estimated annually by the Arbeitskreis Bio-Markt that is coordinated by AMI. AMI set up the task force (Arbeitskreis Bio-Markt) together with the BÖLW, the German umbrella association for the organic sector; the panel institutions GfK, Nielsen scan track, BioVista and Klaus Braun; and also the Universities of Kassel and Weihenstephan-Triesdorf. A piecemeal approach is used for the annual estimate of the market. The GfK household panel data are used for fresh products and dairy in the supermarkets and for all products in the “other sectors” such as bakeries, butchers, box schemes, farmer´s markets and farm shops. Additionally, Nielsen scan track data are used for organic packed items in the supermarkets. BioVista trade panel data and Klaus Braun trade panel data are used for estimating the size of the organic shops. More information about each of these data sources is given below. The task force has been working since 2010 (for estimate of 2009 data) on a regular and voluntary basis.
There are two issues with that estimate:
1. At present, all of the panel institutions give their data to the other members of the task force for free. This may not be possible in the long-term for panel institutions that have to earn money out of selling their data.
2. The butchers, bakeries, farmers’ markets, farm shops and box schemes data from the GfK household panel shows too much variation and it is not clear how much of the market is covered. For the multiples, there is always a coverage gap which makes it difficult to estimate the whole market.