Molecular Sciences
Article
Hydrogen Peroxide-Induced Root Ca
2+
and K
+
Fluxes
Correlate with Salt Tolerance in Cereals: Towards the
Cell-Based Phenotyping
Haiyang WangID, Lana ShabalaID, Meixue Zhou and Sergey Shabala *
School of Land and Food, University of Tasmania, Hobart, Tasmania 7001, Australia;
Haiyang.Wang@utas.edu.au (H.W.); L.Shabala@utas.edu.au (L.S.); Meixue.Zhou@utas.edu.au (M.Z.) * Correspondence: Sergey.Shabala@utas.edu.au; Tel.: +61-3-6226-7539
Received: 24 January 2018; Accepted: 22 February 2018; Published: 1 March 2018
Abstract: Salinity stress-induced production of reactive oxygen species (ROS) and associated oxidative damage is one of the major factors limiting crop production in saline soils. However, the causal link between ROS production and stress tolerance is not as straightforward as one may expect, as ROS may also play an important signaling role in plant adaptive responses. In this study, the causal relationship between salinity and oxidative stress tolerance in two cereal crops—barley (Hordeum vulgare) and wheat (Triticum aestivum)—was investigated by measuring the magnitude of ROS-induced net K+and Ca2+fluxes from various root tissues and correlating them with overall whole-plant responses to salinity. We have found that the association between flux responses to oxidative stress and salinity stress tolerance was highly tissue specific, and was also dependent on the type of ROS applied. No correlation was found between root responses to hydroxyl radicals and the salinity tolerance. However, when oxidative stress was administered via H2O2treatment,
a significant positive correlation was found for the magnitude of ROS-induced K+efflux and Ca2+ uptake in barley and the overall salinity stress tolerance, but only for mature zone and not the root apex. The same trends were found for wheat. These results indicate high tissue specificity of root ion fluxes response to ROS and suggest that measuring the magnitude of H2O2-induced net K+and Ca2+
fluxes from mature root zone may be used as a tool for cell-based phenotyping in breeding programs aimed to improve salinity stress tolerance in cereals.
Keywords: ion flux; reactive oxygen species; barley; wheat; oxidative stress; salinity stress; microelectrode ion flux estimation
1. Introduction
Salinity stress is one of the major environmental constraints limiting crop production worldwide that results in massive economic penalties, especially in arid and semi-arid regions [1–3]. Because of this, plant breeding for salt tolerance is considered to be a major avenue to improve crop production in salt affected regions [4]. According to the classical view, two major components—osmotic stress and specific ion toxicity—limit plant growth in saline soils [5]. Unsurprisingly, in the past decades, many attempts have been made to target these two components in plant breeding programs. The major efforts were focused on either improving plant capacity to exclude Na+from uptake by targeting SOS1[6–8] andHKT1[9–11] genes, or increasing de novo synthesis of organic osmolytes for osmotic adjustment [12–14]. However, none of these approaches has resulted in truly tolerant crops in the farmers’ fields, and even the best performing genotypes created showed a 50% of yield loss when grown under saline conditions [9].
In addition to osmotic and ionic component of the salt stress, one of the reasons for the above detrimental effects of salinity on plant growth is the overproduction and accumulation of reactive
Int. J. Mol. Sci. 2018,19, 702 2 of 18
oxygen species (ROS) under saline condition [15,16]. The increasing level of ROS in a green tissue under saline condition results from the impairment of the photosynthetic apparatus and a limited capability for CO2assimilation in a conjunction with plant’s inability to fully utilize light captured
by photosynthetic pigments [17,18]. However, leaf is not the only site of ROS generation, as the latter species can also be produced in root tissues under saline condition [15,19–22]. In Arabidopsis roots, increasing hydroxyl radicals ( OH) [23] and H2O2[24] levels were observed under salt stress.
Accumulation of NaCl-induced H2O2was also observed in rice [25] and pea roots [26].
When ROS are accumulated in excessive quantities in plant tissues, significant damage to key macromolecules and cellular structures occurs [27,28]. However, the disturbance to cell metabolism (and associated growth penalties) may occur well before this damage is observed. ROS generation in root tissues occurs rapidly in response to salt stimuli and leads to the activation of a broad range of ion channels including Na+-permeable non-selective cation channels (NSCCs) and outward rectifying efflux K+channels (GORK). This results in a disequilibrium of the cytosolic ions pools and a perturbation of cell metabolic processes. When the cytosolic K+/Na+ratio is shifted beyond some critical threshold, the cell can undergo a programmed cell death (PCD) [29,30]. Taken together, these findings have prompted an idea of improving salinity stress tolerance via enhancing plant antioxidant activity [31,32]. However, despite numerous attempts [33–35], the practical outcomes of this approach are rather modest [36,37].
One of the reasons for the above failure to improve plant stress tolerance via constitutive expression of enzymatic antioxidants is the fact that ROS also play an important signaling role in plant adaptive and developmental responses [38]. Moderate level of ROS is essential for signaling pathways mediating a diverse range of physiological and developmental processes [15,38–43]. Therefore, scavenging ROS by constitutive expression of enzymatic antioxidants (AOs) may interfere with these processes and cause pleiotropic effects. As a result, the reported association between activity of AO enzymes and salinity stress tolerance is often controversial [44], and the entire concept “the higher the AO activity the better” does not hold in many cases [45–47].
ROS are known to activate Ca2+ and K+-permeable plasma membrane channels in root epidermis [48], resulting in elevated Ca2+and depleted K+ pool in the cytosol, with a consequent disturbance to intracellular ion homeostasis. A pivotal importance of K+retention under salinity stress
is well known and has been widely reported to correlate positively with the overall salinity tolerance in roots of both barley and wheat, as well as many other species (reviewed by Shabala [49]). Elevation in the cytosolic free Ca2+is also observed in response to a broad range of abiotic and biotic stimuli, and has long been considered an essential component of cell stress signaling mechanism [50–52]. In light of the above, and given the dual role of ROS and their involvement in multiple signaling transduction pathways [38], should salt tolerant species and genotypes be more or less sensitive to ROS? Is this sensitivity the same for all tissues, or does it show some specificity? Can the magnitude of the ROS-induced ion fluxes across the plasma membrane be used as a physiological marker in breeding programs to improve plant salinity stress tolerance? To the best of our knowledge, none of the previous studies has examined ROS-sensitivity of ion transporters in the context of tissue-specificity, or explored a causal link between two type of ROS applied and stress-induced changes in plant ionic homeostasis, in the context of salinity stress tolerance. This gap in our knowledge was addressed in this work.
2. Results
2.1. H2O2-Induced Ion Fluxes Are Dose-Dependent
Two parameters were identified and analyzed from transient response curves (Figure1). The first one was peak value, defined as the maximum flux value measured after the treatment; and the second was the end value, defined as a baseline flux 20 min after the treatment application.
2. Results
2.1. H2O2-Induced Ion Fluxes Are Dose-Dependent
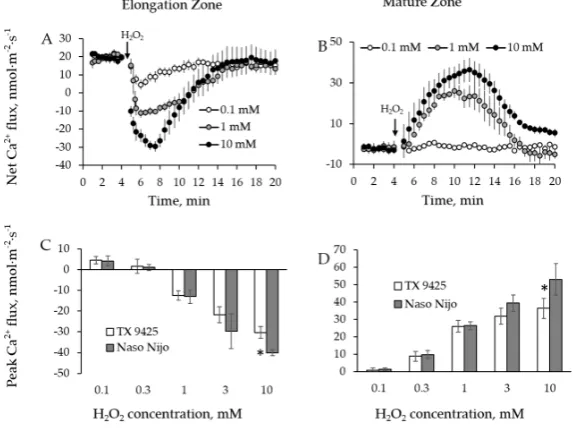
[image:3.595.105.495.184.408.2]Two parameters were identified and analyzed from transient response curves (Figure 1). The first one was peak value, defined as the maximum flux value measured after the treatment; and the second was the end value, defined as a baseline flux 20 min after the treatment application.
Figure 1. Descriptions (see inserts in each panel) of cereal root ion fluxes in response to H2O2 and hydroxyl radicals (●OH) in a single experiment. (A,B) Ion flux kinetics in root elongation zone (A) and mature zone (B) in response to H2O2; (C,D) Ion flux kinetics in root elongation zone (C) and mature zone (D) in response to ●OH. Two distinctive flux points were identified in kinetics of responses: peak value-identified as a maximum flux value measured after a treatment; end value-identified 20 min after the treatment application. An arrow in each panel represents when oxidative stress was imposed.
Two barley varieties (TX 9425, salinity tolerant; Naso Nijo, salinity sensitive) were used for
optimizing the dosage of H2O2 treatment. Accordingly, TX 9425 and Naso Nijo roots were treated with
0.1, 0.3, 1, 3, and 10 mM H2O2 and ion fluxes data were acquired from both root mature and elongation
zones for 15 min after application of H2O2. We found that, except for 0.1 mM, all the H2O2 concentrations
triggered significant ion flux responses in both root zones (Figures 2A,B and 3A,B). In the elongation
root zone, an initial K+ efflux (negative flux values, Figure 2A) and Ca2+ uptake (positive flux values,
Figure 3A) were observed. Application of H2O2 to the root led to a more intensive K+ efflux and a
reduced Ca2+ influx (the latter turned to efflux when concentration of H2O2 was ≥ 1 mM) (Figures 2A
and 3A). In the mature root zone, the initial K+ uptake (Figure 2B) and Ca2+ efflux (Figure 3B) were
observed. Application of H2O2 to the bath led to a dramatic K+ efflux and Ca2+ uptake (Figures 2B and
3B). Ca2+ flux has returned to pre-stress level after reaching a peak (Figure 3A,B). Fluxes of K+, however,
remained negative after reaching the respective peak (Figure 2A,B). The time required to reach a peak
increased with an increase in H2O2 concentration (Figures 2A,B and 3A,B).
The peak values for both Ca2+ and K+ fluxes showed a clear dose-dependency for H2O2
concentrations used (Figures 2C,D and 3C,D). The biggest significant difference (p˂ 0.05) in ion flux
responses of contrasting varieties was observed at 10 mM H2O2 for both K+ (Figure 2C,D) and Ca2+
fluxes (Figure 3C,D). Accordingly, 10 mM H2O2 was chosen as the most suitable concentration for
further experiments.
Figure 1.Descriptions (see inserts in each panel) of cereal root ion fluxes in response to H2O2and hydroxyl radicals ( OH) in a single experiment. (A,B) Ion flux kinetics in root elongation zone (A) and mature zone (B) in response to H2O2; (C,D) Ion flux kinetics in root elongation zone (C) and mature zone (D) in response to OH. Two distinctive flux points were identified in kinetics of responses: peak value-identified as a maximum flux value measured after a treatment; end value-identified 20 min after the treatment application. An arrow in each panel represents when oxidative stress was imposed.
Two barley varieties (TX 9425, salinity tolerant; Naso Nijo, salinity sensitive) were used for optimizing the dosage of H2O2treatment. Accordingly, TX 9425 and Naso Nijo roots were treated
with 0.1, 0.3, 1, 3, and 10 mM H2O2and ion fluxes data were acquired from both root mature and
elongation zones for 15 min after application of H2O2. We found that, except for 0.1 mM, all the
H2O2concentrations triggered significant ion flux responses in both root zones (Figures2A,B and 3A,B). In the elongation root zone, an initial K+ efflux (negative flux values, Figure2A) and Ca2+ uptake (positive flux values, Figure3A) were observed. Application of H2O2 to the root led to a
more intensive K+efflux and a reduced Ca2+influx (the latter turned to efflux when concentration of H2O2was≥1 mM) (Figures2A and3A). In the mature root zone, the initial K+uptake (Figure2B)
and Ca2+efflux (Figure3B) were observed. Application of H2O2to the bath led to a dramatic K+
efflux and Ca2+uptake (Figures2B and3B). Ca2+flux has returned to pre-stress level after reaching a peak (Figure3A,B). Fluxes of K+, however, remained negative after reaching the respective peak (Figure2A,B). The time required to reach a peak increased with an increase in H2O2concentration
(Figures2A,B and3A,B).
The peak values for both Ca2+ and K+ fluxes showed a clear dose-dependency for H2O2
concentrations used (Figures2C,D and3C,D). The biggest significant difference (p< 0.05) in ion flux responses of contrasting varieties was observed at 10 mM H2O2for both K+(Figure2C,D) and
Ca2+fluxes (Figure3C,D). Accordingly, 10 mM H2O2was chosen as the most suitable concentration
Int. J. Mol. Sci. 2018,19, 702 4 of 18
[image:4.595.156.440.87.306.2]Int. J. Mol. Sci. 2018, 19, x FOR PEER REVIEW 4 of 17
Figure 2. (A,B) Net K+ fluxes measured from barley variety TX 9425 root elongation zone (A)—about
1 mm from the root tip and mature zone (B)—about 30mm from the root tip with respective H2O2
concentrations. (C,D) Dose-dependency of H2O2-induced K+ fluxes from root elongation zone (C) and
mature zone (D). Error bars are means ± SE (n = 6–8). Asterisks indicate statistically significant differences between two varieties (* p < 0.05, Student’s t-test). Responses from Naso Nijo were qualitatively similar to those shown for TX 9425.
Figure 3. (A,B) Net Ca2+ fluxes measured from barley variety TX 9425 root elongation zone (A) and
mature zone (B) with respective H2O2 concentrations. (C,D) Dose-dependency of H2O2-induced Ca2+
fluxes from root elongation zone (C) and mature zone (D). Error bars are means ± SE (n = 6–8). Asterisks indicate statistically significant differences between two varieties (* p < 0.05, Student’s t -test). Responses from Naso Nijo were qualitatively similar to those shown for TX 9425.
2.2. Genotypic Variation in H2O2-Induced Ca2+ and K+ Fluxes in Barley
[image:4.595.154.441.411.625.2]Once the optimal H2O2 concentration was chosen, eight barley varieties contrasting in their salt tolerance (see Table 1) were tested for their ability to maintain K+ and Ca2+ homeostasis under 10 mM
Figure 2.(A,B) Net K+fluxes measured from barley variety TX 9425 root elongation zone (A)—about 1 mm from the root tip and mature zone (B)—about 30mm from the root tip with respective H2O2 concentrations. (C,D) Dose-dependency of H2O2-induced K+fluxes from root elongation zone (C) and mature zone (D). Error bars are means±SE (n= 6–8). Asterisks indicate statistically significant differences between two varieties (*p< 0.05, Student’st-test). Responses from Naso Nijo were qualitatively similar to those shown for TX 9425.
Int. J. Mol. Sci. 2018, 19, x FOR PEER REVIEW 4 of 17
Figure 2. (A,B) Net K+ fluxes measured from barley variety TX 9425 root elongation zone (A)—about
1 mm from the root tip and mature zone (B)—about 30mm from the root tip with respective H2O2
concentrations. (C,D) Dose-dependency of H2O2-induced K+ fluxes from root elongation zone (C) and
mature zone (D). Error bars are means ± SE (n = 6–8). Asterisks indicate statistically significant differences between two varieties (* p < 0.05, Student’s t-test). Responses from Naso Nijo were qualitatively similar to those shown for TX 9425.
Figure 3. (A,B) Net Ca2+ fluxes measured from barley variety TX 9425 root elongation zone (A) and
mature zone (B) with respective H2O2 concentrations. (C,D) Dose-dependency of H2O2-induced Ca2+
fluxes from root elongation zone (C) and mature zone (D). Error bars are means ± SE (n = 6–8). Asterisks indicate statistically significant differences between two varieties (* p < 0.05, Student’s t -test). Responses from Naso Nijo were qualitatively similar to those shown for TX 9425.
2.2. Genotypic Variation in H2O2-Induced Ca2+ and K+ Fluxes in Barley
Once the optimal H2O2 concentration was chosen, eight barley varieties contrasting in their salt tolerance (see Table 1) were tested for their ability to maintain K+ and Ca2+ homeostasis under 10 mM
Figure 3.(A,B) Net Ca2+fluxes measured from barley variety TX 9425 root elongation zone (A) and mature zone (B) with respective H2O2 concentrations. (C,D) Dose-dependency of H2O2-induced Ca2+fluxes from root elongation zone (C) and mature zone (D). Error bars are means±SE (n= 6–8). Asterisks indicate statistically significant differences between two varieties (*p< 0.05, Student’st-test). Responses from Naso Nijo were qualitatively similar to those shown for TX 9425.
2.2. Genotypic Variation in H2O2-Induced Ca2+and K+Fluxes in Barley
Once the optimal H2O2concentration was chosen, eight barley varieties contrasting in their salt
magnitudes were dramatically different between mature and elongation zones as well as between the varieties tested (Figure4A,B). Highest and smallest peak and end fluxes of K+were observed in Naso Nijo and CM 72, respectively, in the elongation root zone (Figure4C,D). The same trend was found in the mature root zone for K+peak fluxes, with a small difference in K+end fluxes, where the highest flux was observed in another cultivar: Unicorn (Figure4E,F). Ca2+peak flux responses varied among cultivars (Figure5A,B), with the highest and smallest Ca2+fluxes observed in SYR 01 and Gairdner in
elongation zone (Figure5C), and Naso Nijo and ZUG 403 in mature zone (Figure5D).
We then used a quantitative scoring system [53] to correlate the magnitude of measured flux responses with the salinity tolerance of each genotype. The overall salinity tolerance of barley was quantified as a damage index score ranging between 0 and 10, with 0 representing most tolerant and 10 representing most sensitive variety (Table1). Peak and end flux values of K+and Ca2+were then plotted against respective tolerance scores. A significant (p< 0.05) positive correlation was found between H2O2-induced K+efflux (Figure4I,J), the Ca2+uptake (Figure5F), and the salinity damage
[image:5.595.108.486.338.423.2]index score in the mature root zone. At the same time, no correlation was found in the elongation zone for either K+(Figure4G,H) or Ca2+flux (Figure5E).
Table 1. List of barley and wheat varieties used in this study. Scores represent quantified damage degree of cereals under salinity stress, reported as damage index score from 0 to 10.
Barley Wheat
Tolerant Sensitive Tolerant Sensitive
Varieties Score Varieties Score Varieties Score Varieties Score
SYR 01 0.25 Gairdner 4.00 Titmouse S 1.83 Seville 20 3.83
TX 9425 1.00 ZUG 403 5.75 Cranbrook 2.50 Iran 118 4.17
CM 72 1.25 Naso Nijo 7.50 Westonia 3.00 340 5.50
ZUG 293 1.75 Unicorn 9.50
0—highest overall salinity tolerance; 10—lowest level of salt tolerance. Data collected from our previous study from Wu et al. [53,54].
Int. J. Mol. Sci. 2018, 19, x FOR PEER REVIEW 5 of 17
H2O2 treatment (Figures 4 and 5). The kinetics of K+ flux responses were qualitatively similar and the magnitudes were dramatically different between mature and elongation zones as well as between the varieties tested (Figure 4 A,B). Highest and smallest peak and end fluxes of K+ were observed in Naso Nijo and CM 72, respectively, in the elongation root zone (Figure 4C,D). The same trend was found in the mature root zone for K+ peak fluxes, with a small difference in K+ end fluxes, where the highest flux was observed in another cultivar: Unicorn (Figure 4E,F). Ca2+ peak flux responses varied among cultivars (Figure 5A,B), with the highest and smallest Ca2+ fluxes observed in SYR 01 and Gairdner in elongation zone (Figure 5C), and Naso Nijo and ZUG 403 in mature zone (Figure 5D).
[image:5.595.150.444.457.672.2]We then used a quantitative scoring system [53] to correlate the magnitude of measured flux responses with the salinity tolerance of each genotype. The overall salinity tolerance of barley was quantified as a damage index score ranging between 0 and 10, with 0 representing most tolerant and 10 representing most sensitive variety (Table 1). Peak and end flux values of K+ and Ca2+ were then plotted against respective tolerance scores. A significant (p < 0.05) positive correlation was found between H2O2-induced K+ efflux (Figure 4I,J), the Ca2+ uptake (Figure 5F), and the salinity damage index score in the mature root zone. At the same time, no correlation was found in the elongation zone for either K+ (Figure 4G,H) or Ca2+ flux (Figure 5E).
Table 1. List of barley and wheat varieties used in this study. Scores represent quantified damage degree of cereals under salinity stress, reported as damage index score from 0 to 10.
Barley Wheat
Tolerant Sensitive Tolerant Sensitive Varieties Score Varieties Score Varieties Score Varieties Score
SYR 01 0.25 Gairdner 4.00 Titmouse S 1.83 Seville 20 3.83
TX 9425 1.00 ZUG 403 5.75 Cranbrook 2.50 Iran 118 4.17
CM 72 1.25 Naso Nijo 7.50 Westonia 3.00 340 5.50
ZUG 293 1.75 Unicorn 9.50
0—highest overall salinity tolerance; 10—lowest level of salt tolerance. Data collected from our previous study from Wu et al. [53,54].
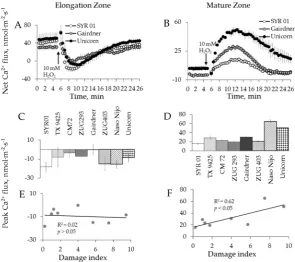
Figure 4. Kinetics of K+ fluxes from three representative barley varieties in response to 10 mM H2O2
treatment from both root elongation zone (A) and mature zone (B). Error bars are means ± SE (n = 6– 8). (C,D,G,H) Peak (C) and end (D) K+ fluxes of eight barley varieties in response to 10 mM H2O2 and
their correlation with damage index (G,H, respectively) in root elongation zone. (E,F,I,J) Peak (E) and end (F) K+ fluxes of eight barley varieties in response to 10 mM H2O2 and their correlation with
damage index (I,J, respectively) in root mature zone.
Figure 4.Kinetics of K+fluxes from three representative barley varieties in response to 10 mM H 2O2 treatment from both root elongation zone (A) and mature zone (B). Error bars are means±SE (n= 6–8). (C,D,G,H) Peak (C) and end (D) K+fluxes of eight barley varieties in response to 10 mM H2O2and their correlation with damage index (G,H, respectively) in root elongation zone. (E,F,I,J) Peak (E) and end (F) K+fluxes of eight barley varieties in response to 10 mM H
Int. J. Mol. Sci. 2018,19, 702 6 of 18
[image:6.595.149.445.88.350.2]Int. J. Mol. Sci. 2018, 19, x FOR PEER REVIEW 6 of 17
Figure 5. Kinetics of Ca2+ fluxes from three representative barley varieties in response to 10 mM H2O2 treatment from both root elongation zone (A) and mature zone (B). Error bars are means ± SE (n = 6– 8). (C,E) Peak Ca2+ fluxes (C) of eight barley varieties in response to 10 mM H2O2 and their correlation with damage index (E) in root elongation zone. (D,F) Peak Ca2+ fluxes (D) of eight barley varieties in response to 10 mM H2O2 and their correlation with damage index (F) in root mature zone.
2.3. Genotypic Variation in H2O2-Induced Ca2+ and K+ Fluxes in Wheat
Six wheat varieties contrasting in their salt tolerance were used to check whether the above
trends observed in barley are also applicable to wheat species. Transient K+ and Ca2+ flux responses
to 10 mM H2O2 in wheat were qualitatively identical to those measured from barley roots, in both
zones (Figures 6A,B and 7A,B). When peak and end flux values were plotted against the salinity
damage index (Table 1, [54]), a strong positive correlation was found between H2O2-induced K+
(Figure 6E,F) and Ca2+ (Figure 7D) fluxes and the overall salinity tolerance (Table 1) in wheat root
[image:6.595.86.512.597.723.2]mature zone (p < 0.01 for Figure 6I,J; p < 0.05 for Figure 7F). Similar to barley, no correlation was found between salt damage index (Table 1) and the magnitude of ion flux responses (Figures 6C,D and 7C) in the root elongation zone of wheat (Figures 6G,H and 7E).
Figure 5.Kinetics of Ca2+fluxes from three representative barley varieties in response to 10 mM H2O2 treatment from both root elongation zone (A) and mature zone (B). Error bars are means±SE (n= 6–8). (C,E) Peak Ca2+fluxes (C) of eight barley varieties in response to 10 mM H2O2and their correlation with damage index (E) in root elongation zone. (D,F) Peak Ca2+fluxes (D) of eight barley varieties in response to 10 mM H2O2and their correlation with damage index (F) in root mature zone.
2.3. Genotypic Variation in H2O2-Induced Ca2+and K+Fluxes in Wheat
Six wheat varieties contrasting in their salt tolerance were used to check whether the above trends observed in barley are also applicable to wheat species. Transient K+and Ca2+flux responses to 10 mM H2O2in wheat were qualitatively identical to those measured from barley roots, in both zones
(Figures6A,B and7A,B). When peak and end flux values were plotted against the salinity damage index (Table1, [54]), a strong positive correlation was found between H2O2-induced K+(Figure6E,F)
and Ca2+(Figure7D) fluxes and the overall salinity tolerance (Table1) in wheat root mature zone (p< 0.01 for Figure6I,J;p< 0.05 for Figure7F). Similar to barley, no correlation was found between salt damage index (Table1) and the magnitude of ion flux responses (Figures6C,D and7C) in the root elongation zone of wheat (Figures6G,H and7E).
Int. J. Mol. Sci. 2018, 19, x FOR PEER REVIEW 6 of 17
Figure 5. Kinetics of Ca2+ fluxes from three representative barley varieties in response to 10 mM H2O2 treatment from both root elongation zone (A) and mature zone (B). Error bars are means ± SE (n = 6– 8). (C,E) Peak Ca2+ fluxes (C) of eight barley varieties in response to 10 mM H2O2 and their correlation with damage index (E) in root elongation zone. (D,F) Peak Ca2+ fluxes (D) of eight barley varieties in response to 10 mM H2O2 and their correlation with damage index (F) in root mature zone.
2.3. Genotypic Variation in H2O2-Induced Ca2+ and K+ Fluxes in Wheat
Six wheat varieties contrasting in their salt tolerance were used to check whether the above
trends observed in barley are also applicable to wheat species. Transient K+ and Ca2+ flux responses
to 10 mM H2O2 in wheat were qualitatively identical to those measured from barley roots, in both
zones (Figures 6A,B and 7A,B). When peak and end flux values were plotted against the salinity
damage index (Table 1, [54]), a strong positive correlation was found between H2O2-induced K+
(Figure 6E,F) and Ca2+ (Figure 7D) fluxes and the overall salinity tolerance (Table 1) in wheat root
mature zone (p < 0.01 for Figure 6I,J; p < 0.05 for Figure 7F). Similar to barley, no correlation was found between salt damage index (Table 1) and the magnitude of ion flux responses (Figures 6C,D and 7C) in the root elongation zone of wheat (Figures 6G,H and 7E).
Int. J. Mol. Sci. 2018, 19, x FOR PEER REVIEW 7 of 17
Figure 6. Kinetics of K+ fluxes from three representative wheat varieties in response to 10 mM H2O2 treatment from both root elongation zone (A) and mature zone (B). Error bars are means ± SE (n = 6– 8). (C,D,G,H) Peak (C) and end (D) K+ fluxes of six wheat varieties in response to 10 mM H2O2 and their correlation with damage index (G,H, respectively) in root elongation zone. (E,F,I,J) Peak (E) and end (F) K+ fluxes of six wheat varieties in response to 10 mM H2O2 and their correlation with damage index (I,J, respectively) in root mature zone.
[image:7.595.111.483.366.697.2]Figure 7. Kinetics of Ca2+ fluxes from three representative wheat varieties in response to 10 mM H2O2 treatment from both root elongation zone (A) and mature zone (B). Error bars are means ± SE (n = 6– 8). (C,E) Peak Ca2+ fluxes (C) of six wheat varieties in response to 10 mM H2O2 and their correlation with damage index (E) in root elongation zone. (D,F) Peak Ca2+ fluxes (D) of six wheat varieties in response to 10 mM H2O2 and their correlation with damage index (F) in root mature zone.
Figure 6.Kinetics of K+fluxes from three representative wheat varieties in response to 10 mM H2O2 treatment from both root elongation zone (A) and mature zone (B). Error bars are means±SE (n= 6–8). (C,D,G,H) Peak (C) and end (D) K+fluxes of six wheat varieties in response to 10 mM H2O2and their correlation with damage index (G,H, respectively) in root elongation zone. (E,F,I,J) Peak (E) and end (F) K+fluxes of six wheat varieties in response to 10 mM H2O2and their correlation with damage index (I,J, respectively) in root mature zone.
Int. J. Mol. Sci. 2018, 19, x FOR PEER REVIEW 7 of 17
Figure 6. Kinetics of K+ fluxes from three representative wheat varieties in response to 10 mM H2O2
treatment from both root elongation zone (A) and mature zone (B). Error bars are means ± SE (n = 6– 8). (C,D,G,H) Peak (C) and end (D) K+ fluxes of six wheat varieties in response to 10 mM H2O2 and
their correlation with damage index (G,H, respectively) in root elongation zone. (E,F,I,J) Peak (E) and end (F) K+ fluxes of six wheat varieties in response to 10 mM H2O2 and their correlation with damage
index (I,J, respectively) in root mature zone.
Figure 7. Kinetics of Ca2+ fluxes from three representative wheat varieties in response to 10 mM H2O2
treatment from both root elongation zone (A) and mature zone (B). Error bars are means ± SE (n = 6– 8). (C,E) Peak Ca2+ fluxes (C) of six wheat varieties in response to 10 mM H2O2 and their correlation
with damage index (E) in root elongation zone. (D,F) Peak Ca2+ fluxes (D) of six wheat varieties in
response to 10 mM H2O2 and their correlation with damage index (F) in root mature zone.
Figure 7.Kinetics of Ca2+fluxes from three representative wheat varieties in response to 10 mM H2O2 treatment from both root elongation zone (A) and mature zone (B). Error bars are means±SE (n= 6–8). (C,E) Peak Ca2+fluxes (C) of six wheat varieties in response to 10 mM H
Int. J. Mol. Sci. 2018,19, 702 8 of 18
Taken together, the above results suggest that the H2O2-induced fluxes of Ca2+and K+in mature
root zone correlate well with the damage index but no such correlation exists in the elongation zone. 2.4. Genotypic Variation of Hydroxyl Radical-Induced Ca2+and K+Fluxes in Barley
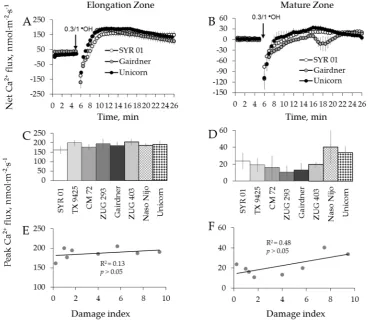
Using eight barley varieties listed in Table1, we then repeated the above experiments using a hydroxyl radical, the most aggressive ROS species of which can be produced during Fenton reaction between transition metal and ascorbate [55]. Hydroxyl radicals ( OH) were generated by applying 0.3/1.0 mM Cu2+/ascorbate mixture [48]. This treatment caused a dramatic K+efflux (6–8 fold greater than the treatment with H2O2, data not shown), with fluxes reaching their peak efflux magnitude after
3 to 4 min of stress application in elongation zone and 7 to 13 min in the mature zone (Figure8A,B). The mean peak values ranged from−3686±600 to−8018±536 nmol m−2·s−1and from−7669±27 to−11,930±619 nmol·m−2·s−1, respectively, for the two zones (data not shown).
Int. J. Mol. Sci. 2018, 19, x FOR PEER REVIEW 8 of 17
Taken together, the above results suggest that the H2O2-induced fluxes of Ca2+ and K+ in mature
root zone correlate well with the damage index but no such correlation exists in the elongation zone.
2.4. Genotypic Variation of Hydroxyl Radical-Induced Ca2+ and K+ Fluxes in Barley
Using eight barley varieties listed in Table 1, we then repeated the above experiments using a hydroxyl radical, the most aggressive ROS species of which can be produced during Fenton reaction
between transition metal and ascorbate [55]. Hydroxyl radicals (●OH) were generated by applying
0.3/1.0 mM Cu2+/ascorbate mixture [48]. This treatment caused a dramatic K+ efflux (6–8 fold greater
than the treatment with H2O2, data not shown), with fluxes reaching their peak efflux magnitude after
3 to 4 min of stress application in elongation zone and 7 to 13 min in the mature zone (Figure 8A,B).
The mean peak values ranged from −3686 ± 600 to −8018 ± 536 nmol m−2·s−1 and from −7669 ± 27 to
[image:8.595.97.493.268.549.2]−11,930 ± 619 nmol·m−2·s−1, respectively, for the two zones (data not shown).
Figure 8. Kinetics of K+ fluxes from three representative barley varieties in response to 0.3/1 mM Cu2+/ascorbate mixture(●OH) treatment from both root elongation zone (A) and mature zone (B). Error bars are means ± SE (n = 6–8). (C,D,G,H) Peak (C) and end (D) K+ fluxes of eight barley varieties in response to ●OH and their correlation with damage index (G,H, respectively) in root elongation zone. (E,F,I,J) Peak (E) and end (F) K+ fluxes of eight barley varieties in response to ●OH and their correlation with damage index (I,J, respectively) in root mature zone.
Contrary to H2O2 treatment, a dramatic and instantaneous net Ca2+ efflux was observed in both
zones immediately after application of ●OH-generation mixture to the bath (Figure 9A,B). This Ca2+
efflux was short lived, and net Ca2+ influx was measured after about 2 min from elongation and after
8 min from mature root zones, respectively (Figure 9A,B). No significant correlation between overall
salinity tolerance (damage index, see Table 1) and either Ca2+ or K+ fluxes in response to ●OH
treatment was found in either zone (Figures 8G,H,I,J and 9E,F).
Figure 8. Kinetics of K+ fluxes from three representative barley varieties in response to 0.3/1 mM Cu2+/ascorbate mixture ( OH) treatment from both root elongation zone (A) and mature zone (B). Error bars are means±SE (n= 6–8). (C,D,G,H) Peak (C) and end (D) K+fluxes of eight barley varieties in response to OH and their correlation with damage index (G,H, respectively) in root elongation zone. (E,F,I,J) Peak (E) and end (F) K+fluxes of eight barley varieties in response to OH and their correlation with damage index (I,J, respectively) in root mature zone.
Contrary to H2O2treatment, a dramatic and instantaneous net Ca2+efflux was observed in both
Int. J. Mol. Sci. 2018, 19, x FOR PEER REVIEW 9 of 17
Figure 9. Kinetics of Ca2+ fluxes from three representative barley varieties in response to 0.3/1 mM Cu2+/ascorbate mixture(●OH) treatment from both root elongation zone (A) and mature zone (B). Error bars are means ± SE (n = 6–8). (C,E) Peak Ca2+ fluxes (C) of eight barley varieties in response to
●OH and their correlation with damage index (E) in root elongation zone. (D,F) Peak Ca2+ fluxes (D) of eight barley varieties in response to ●OH and their correlation with damage index (F) in root mature zone.
3. Discussion
ROS are the “dual edge swords” that are essential for plant growth and signaling when they are maintained at the non-toxic level, but that can be detrimental to plant cells when ROS production exceeds a certain threshold [38]. This is particularly true for the role of ROS in plant responses to salinity. Salt-stress induced ROS production is considered to be an essential step in triggering a
cascade of adaptive responses including early stomatal closure [56]; control of xylem Na+ loading
[57,58] and sodium compartmentalization [59]. At the same time, excessive ROS accumulation may have negative impact on intracellular ionic homeostasis under saline conditions. Of specific
importance is ROS-induced cytosolic K+ loss that stimulates protease and endonuclease activity,
promoting program cell death [23,29,30,60]. Thereby, ROS homeostasis is required to maintain ROS concentrations at basal level, to facilitate redox biology, and act in signaling processes [20,21,38]. This homeostasis implies an involvement of highly orchestrated ROS generating and scavenging systems [20,61,62]. Here we show that such homeostasis is highly plant tissue-specific and differs between various ROS species.
3.1. The Magnitude of the Hydroxyl Radical-Induced K+ and Ca2+ Fluxes Does Not Correlate With Salinity
Stress Tolerance in Barley
Hydroxyl radicals (●OH) are considered to be very short-lived (half-life of 1 ns) and highly
aggressive agents that are a prime cause of oxidative damage to proteins and nucleic acids, as well as lipid peroxidation during oxidative stress [63]. At physiologically relevant concentrations, they
Figure 9.Kinetics of Ca2+fluxes from three representative barley varieties in response to 0.3/1 mM Cu2+/ascorbate mixture ( OH) treatment from both root elongation zone (A) and mature zone (B). Error bars are means±SE (n= 6–8). (C,E) Peak Ca2+fluxes (C) of eight barley varieties in response to OH and their correlation with damage index (E) in root elongation zone. (D,F) Peak Ca2+fluxes (D) of eight barley varieties in response to OH and their correlation with damage index (F) in root mature zone.
3. Discussion
ROS are the “dual edge swords” that are essential for plant growth and signaling when they are maintained at the non-toxic level, but that can be detrimental to plant cells when ROS production exceeds a certain threshold [38]. This is particularly true for the role of ROS in plant responses to salinity. Salt-stress induced ROS production is considered to be an essential step in triggering a cascade of adaptive responses including early stomatal closure [56]; control of xylem Na+ loading [57,58] and sodium compartmentalization [59]. At the same time, excessive ROS accumulation may have negative impact on intracellular ionic homeostasis under saline conditions. Of specific importance is ROS-induced cytosolic K+loss that stimulates protease and endonuclease activity, promoting program cell death [23,29,30,60]. Thereby, ROS homeostasis is required to maintain ROS concentrations at basal level, to facilitate redox biology, and act in signaling processes [20,21,38]. This homeostasis implies an involvement of highly orchestrated ROS generating and scavenging systems [20,61,62]. Here we show that such homeostasis is highly plant tissue-specific and differs between various ROS species. 3.1. The Magnitude of the Hydroxyl Radical-Induced K+and Ca2+Fluxes Does Not Correlate With Salinity Stress Tolerance in Barley
Int. J. Mol. Sci. 2018,19, 702 10 of 18
as lipid peroxidation during oxidative stress [63]. At physiologically relevant concentrations, they have the greatest potency to induce activation of Ca2+and K+channels, leading to massive fluxes of these ions across cellular membranes [23,48] with detrimental effects on cell metabolism. This is clearly demonstrated by our data, showing that OH–induced K+efflux was an order of magnitude stronger compared with that induced by H2O2, for the appropriate variety and a root zone (e.g., Figures4and8).
Due to their short life, they can diffuse over very short distances (<1 nm) [64] and thus are less suitable for the role of the signaling molecules. Importantly, OH cannot be scavenged by traditional enzymatic antioxidants, and control of OH level in cells is achieved via elaborated network of non-enzymatic antioxidants (e.g., polyols, tocopherols, polyamines, ascorbate, glutathione, proline, glycine betaine, polyphenols, carotenoids; reviewed by Bose et al. [16]). It was shown that exogenous application of some of these non-enzymatic antioxidants prevented OH-induced K+efflux from plant cells [65] and resulted in an improved salinity stress tolerance [66–68]. Thus, an ability of keeping OH levels under control appears to be absolutely essential for plant survival under salt stress conditions, and all barley genotypes, studied in our work, appeared to possess this ability (although, most likely, by different means).
A recent study from our laboratory [69] has shown that higher sensitivity of the root apex to salinity stress (as compared to mature root zone) was partially explained by the higher population of OH-inducible K+-permeable efflux channels in this tissue. At the same time, root apical cells responses to salinity stress by a massive increase in the level of allantoin, a substance with a known ability to mitigate oxidative damage symptoms [70] and alleviate OH-induced K+efflux from root cells [69]. This suggests an existence of a feedback mechanism that compensates hypersensitivity of some specific tissue and protects them against detrimental action of OH. From our data reported here, it appears that the same mechanism exists amongst diverse barley germplasm. Thus, from the practical point of view, the lack of significant correlation between OH-induced ion fluxes and salinity stress tolerance (Figures8and9) makes this trait not suitable for salinity breeding programs.
3.2. H2O2-Induced K+and Ca2+Fluxes in Cereals Correlate with their Overall Salinity Stress Tolerance But Only in Mature Zone
Earlier observations showed that salt sensitive barley varieties (with higher damage index) have higher K+ efflux in response to H
2O2compared to salt tolerant varieties [44,71]. In this study, we
extrapolated these initial observations made on a few selected varieties to a larger number of genotypes. We have also shown that (1) the same trend is also applicable to wheat species; (2) larger K+efflux is mirrored by the higher Ca2+uptake in H2O2-treated roots; and (3) the correlation between salinity
tolerance and H2O2-induced ion flux responses exists only in mature but not elongation root zone.
Over the last decade, an ability of various plant tissues to retain potassium under stress conditions has evolved as a novel and essential mechanism of salinity stress tolerance in plants (reviewed by Shabala and Pottosin [30] and Shabala et al. [72]). Reported initially for barley roots [73–75], a positive correlation between the overall salinity stress tolerance and the ability of a root tissue to retain K+ was later expanded to many other species (reviewed by Shabala [49]) and also extrapolated to explain the inter-specific variability in salinity stress tolerance [76–78]. In roots, this NaCl-induced K+efflux is mediated predominantly by outward-rectifying K+ channels GORK that are activated by both
membrane depolarization [79] and ROS [23], as shown in direct patch-clamp experiments. Thus, the reduced H2O2 sensitivity of roots of tolerant wheat and barley genotypes may be potentially
explained by either smaller population of ROS-sensitive GORK channels, or by higher endogenous level of enzymatic antioxidants in the mature root zone. It is not clear at this stage if H2O2is less
prone to induce K+efflux (e.g., root cells are less sensitive to this ROS) in salt tolerant plants or the “effective” H2O2concentration in root cells is lower in salt-tolerant plants due to a higher scavenging
or detoxification capacity. However, given the fact that the activity of major antioxidant enzymes has been shown to be higher in salt sensitive barley cultivars in both control and H2O2treated roots [44],
The molecular identity of ROS-sensitive transporters should be revealed in the future pharmacological and (forward) genetic experiments. Previously we have shown that H2O2-induced
Ca2+and K+fluxes were significantly attenuated in ArabidopsisAtann1mutants and enhanced in overexpressing lines [80], making annexin a likely candidate to this role. Further, H2O2-induced
Ca2+uptake in Arabidopsis roots was strongly suppressed by application of 30µM Gd3+, a known blocker of non-selective cation channels [81], and roots pre-treatment with either cAMP or cGMP significantly reduced H2O2-induced K+-leakage and Ca2+-influx [82], implicating the involvement of
cyclic nucleotide-gated channels (one type of NSCC) [83].
The lack of the above correlation between H2O2-induced K+ efflux and salinity tolerance in
the elongation root zone is very interesting and requires some further discussion. In recent years, a “metabolic switch” concept has emerged [49,63], which implies that K+efflux from metabolically active cells may be a part of the mechanism inhibiting energy-consuming anabolic reactions and saving energy for adaptation and reparation needs. This mechanism is implemented via transient decrease in cytosolic K+concentration and accompanied reduction in the activity of a large number of K+-dependent enzymes, allowing a redistribution of ATP pool towards defense responses [49]. Thus, high K+efflux from the elongation zone in salt-tolerant varieties may be an important part of this adaptive strategy. This suggestion is also consistent with the observation that plants often respond to salinity stress by the increase in the GORK transcript level [78,84].
It should be also commented that salt tolerant varieties used in this study usually have lower grain yield under control condition [75,85], showing a classical trade-off between tolerance and productivity [86], most likely as a result of allocation of a larger metabolic pool towards constitutive defense traits such as maintenance of more negative membrane potential in plant roots [72] or more reliance on the synthesis of organic osmolytes for osmotic adjustment.
3.3. Reactive Oxygen Species (ROS)-Induced K+Efflux is Accompanied by an Increased Ca2+Uptake
Elevation in the cytosolic free calcium is crucial for plant growth, development, and adaptation. Calcium influx into plant cells may be mediated by a broad range of Ca2+-permeable channels. Of specific interest are ROS-activated Ca2+-permeable channels that form so-called “ROS-Ca2+ hub” [87]. This mechanism implies that Ca2+-activated NADPH oxidases work in concert with ROS-activated Ca2+-permeable cation channels to generate and amplify stress-induced Ca2+and ROS signals [48,81,83,88]. This self-amplification mechanism may be essential for early stress signaling events as proposed by Shabala et al. [88] and may operate in the root apex, where the salt stress sensing most likely takes place [89]. In the mature zone, however, continues influx of Ca2+may cause excessive apoplastic O2production where it is rapidly reduced to H2O2. By interacting with transition metals
(Cu+and Fe2+) in the cell wall, the hydroxyl radicals are formed [63], activating K+efflux channels.
This may explain the observed correlation between the magnitude of H2O2-induced Ca2+influx and
K+efflux measured in this tissue (Figure4I,J, Figure5F, Figure6I,J and Figure7F). This notion is further supported by the previous reports that in Arabidopsis mature root cell protoplasts hydroxyl radicals were proved to activate and mediate inward Ca2+and outward K+currents [48,81], while exogenous H2O2failed to activate inward Ca2+currents [48]. The conductance resumed when H2O2
was applied to intact mature roots [81]. This indicated that channel activation by H2O2may be indirect
and mediated by its interaction with cell wall transition metals [55,90]. 3.4. Implications for Breeders
Int. J. Mol. Sci. 2018,19, 702 12 of 18
root ion transporters mediating ionic homeostasis in plant cells. This gap in our knowledge was filled by the current study.
Taken together, our results indicate high tissue specificity of root ion flux response to ROS and suggest that measuring the magnitude of H2O2-induced net K+and Ca2+fluxes from mature root zone
may be used as a tool for cell-based phenotyping in breeding programs aimed to improve salinity stress tolerance in cereals. The next step in this process will be a full-scale validation of the proposed method and finding QTLs associated with ROS-induced ion fluxes in plant roots.
4. Materials and Methods
4.1. Plant Materials and Growth Conditions
Eight barley (sevenHordeum vulgare L. and one H. vulgare ssp. Spontaneum) and six wheat (bread wheat, Triticum aestivum) varieties contrasting in salinity tolerance were used in this study. All seeds were acquired from the Australian Winter Cereal Collection, and the list of cultivars is shown in Table1. Seeds were surface sterilized with ten-fold diluted commercial bleach for 10 min and then rinsed thoroughly with tap water. Seeds were grown in basic salt medium (BSM; 0.1 mM CaCl2and
0.5 mM KCl, pH 5.6) in aerated hydroponic system in 24 h darkness at 24±1◦C for 4 days. Seedlings with root length between 60 and 80 mm were used in experiments.
4.2. Ion-Selective Microelectrodes Preparation
Net ion fluxes were measured with ion-selective microelectrodes non-invasively using MIFE technique (University of Tasmania, Hobart, Australia) [99]. Blank microelectrodes were pulled out from borosilicate glass capillaries (GC150-10, 1.5 mm OD×0.86 mm ID×100 mm L, Harvard Apparatus, UK) using a vertical puller, then dried at 225 ◦C overnight in an oven and then silanized with chlorotributylsilane (282707-25G, Sigma-Aldrich, Sydney, NSW, Australia). Silanized electrode tips were flattened to a diameter of 2–3µm and backfilled with respective backfilling solutions (200 mM KCl for K+and 500 mM CaCl2for Ca2+). Electrode tips were then front-filled with respective commercial
ionophore cocktails (Cat. 99311 for K+and 99310 for Ca2+, Sigma-Aldrich,). Filled microelectrodes were mounted in the electrode holders of the MIFE set-up and calibrated in a set of respective calibration solutions (250, 500, 1000µM KCl for calibrating K+electrode and 100, 200, 400µM CaCl2for calibrating
Ca2+electrode) before and after measurements. Electrodes with a slope of more than 50 mV per decade for K+and more than 25 mV per decade for Ca2+, and correlation coefficients of more than 0.9990 have been used.
4.3. Ion Flux Measurements
Net fluxes of Ca2+and K+were measured from mature (2–3 cm from root apex) and elongation
(1–2 mm from root apex) root zones. To do this, plant roots were immobilized in a measuring chamber containing 30 ml BSM solution and left for 40 min for adaptation prior to the measurement. The calibrated electrodes were co-focused and positioned 40–50µm away from the measuring site on the root before starting the experiment. After commencing, a computer-controlled stepper motor (hydraulic micromanipulator) moved microelectrodes 100µm away from the positioned site and back in a 12 s square-wave manner to measure electrochemical gradient potential between two positions. The CHART software was used to acquire data [99,100] and ion fluxes were then calculated using the MIFEFLUX program [99].
4.4. Experimental Protocols for Microelectrode Ion Flux Estimation (MIFE) Measurements
Two types of ROS were tested—hydrogen peroxide (H2O2) and hydroxyl radicals ( OH). A final
working concentration of H2O2in BSM was achieved by adding H2O2stock to the measuring chamber.
As the half-life of H2O2in the absence of transition metals is of an order of magnitude of several (up to
that bath H2O2concentration remained stable during measurements. A mixture of copper/sodium
ascorbate (Cu/A, 0.3/1.0 mM) was used to generate OH [48]. The measuring solution containing 0.5 mM KCl and 0.1 mM CaCl2was buffered with 4mM MES/Tris to achieve pH 5.6. Net Ca2+and K+
fluxes were measured from mature and elongation zones of a root for 4 to 5 min to ensure the stability of initial ion fluxes. Then a stressor (either H2O2or OH) was added to the bath and Ca2+and K+
fluxes were acquired for another 20 min. The first 30–60 s after adding the treatment solution (H2O2or
Cu/A mixture) were discarded during data analyses in agreement with the MIFE theory that requires non-stirred conditions [99].
4.5. Quantifying Plant Damage Index
The extent of plant salinity tolerance was quantified by allocating so-called “damage index score” to each plant. The use of such damage index is a widely accepted practice by plant breeders [53,54,102]. This index is based on evaluation of the extent of leaf chlorosis and plant survival rate and relies on the visual assessment of plant performance after about 30 days of exposure to high salinity. The score ranges between 0 (no stress symptoms) and 10 (completely dead plant), and it was shown before that the damage index score correlated strongly with the grain yield under stress conditions [102]. 4.6. Statistical Analysis
Statistical significance of mean values was determined by the standard Student’s t-test at p< 0.05 level.
Acknowledgments: This work was supported by the Grain Research and Development Corporation grant to Sergey Shabala and Meixue Zhou and by the Australian Research Council Discovery grant to Sergey Shabala.
Author Contributions:Sergey Shabala, Meixue Zhou and Lana Shabala conceived and designed the experiments; Haiyang Wang performed the experiments and analyzed the data; Lana Shabala and Meixue Zhou contributed reagents/materials/analysis tools; the paper was written under the direction and supervision of Sergey Shabala; Haiyang Wang was responsible for writing this work.
Conflicts of Interest:The authors declare no conflict of interest. 22 February 2018.
Abbreviations
ROS Reactive Oxygen Species SOS Salt Overly Sensitive HKT High-affinity K+Transporter NSCCs Non-Selective Cation Channels
GORK Guard cell Outward Rectifying K+channel
PCD Programmed Cell Death
AO Antioxidant
MIFE Microelectrode Ion Flux Estimation QTL Quantitative Trait Locus
BSM Basic Salt Medium
Cu/A Copper/Ascorbate
References
1. Schleiff, U. Analysis of water supply of plants under saline soil conditions and conclusions for research on crop salt tolerance.J. Agron. Crop Sci.2008,194, 1–8. [CrossRef]
2. Shabala, S.; Bose, J.; Hedrich, R. Salt bladders: Do they matter?Trends Plant Sci.2014,19, 687–691. [CrossRef]
[PubMed]
3. Gorji, T.; Tanik, A.; Sertel, E. Soil salinity prediction, monitoring and mapping using modem technologies. Procedia Earth Planet. Sci.2015,15, 507–512. [CrossRef]
Int. J. Mol. Sci. 2018,19, 702 14 of 18
5. Deinlein, U.; Stephan, A.B.; Horie, T.; Luo, W.; Xu, G.H.; Schroeder, J.I. Plant salt-tolerance mechanisms. Trends Plant Sci.2014,19, 371–379. [CrossRef] [PubMed]
6. Martinez-Atienza, J.; Jiang, X.Y.; Garciadeblas, B.; Mendoza, I.; Zhu, J.K.; Pardo, J.M.; Quintero, F.J. Conservation of the salt overly sensitive pathway in rice.Plant Physiol.2007,143, 1001–1012. [CrossRef]
[PubMed]
7. Xu, H.X.; Jiang, X.Y.; Zhan, K.H.; Cheng, X.Y.; Chen, X.J.; Pardo, J.M.; Cui, D.Q. Functional characterization of a wheat plasma membrane Na+/H+antiporter in yeast.Arch. Biochem. Biophys.2008,473, 8–15. [CrossRef]
[PubMed]
8. Feki, K.; Quintero, F.J.; Pardo, J.M.; Masmoudi, K. Regulation of durum wheat Na+/H+exchanger TdSOS1 by phosphorylation.Plant Mol. Biol.2011,76, 545–556. [CrossRef] [PubMed]
9. Munns, R.; James, R.A.; Xu, B.; Athman, A.; Conn, S.J.; Jordans, C.; Byrt, C.S.; Hare, R.A.; Tyerman, S.D.; Tester, M.; et al. Wheat grain yield on saline soils is improved by an ancestral Na+ transporter gene. Nat. Biotechnol.2012,30, 360–364. [CrossRef] [PubMed]
10. Byrt, C.S.; Xu, B.; Krishnan, M.; Lightfoot, D.J.; Athman, A.; Jacobs, A.K.; Watson-Haigh, N.S.; Plett, D.; Munns, R.; Tester, M.; et al. The Na+transporter, TaHKT1;5-D, limits shoot Na+accumulation in bread wheat.Plant J.2014,80, 516–526. [CrossRef] [PubMed]
11. Suzuki, K.; Yamaji, N.; Costa, A.; Okuma, E.; Kobayashi, N.I.; Kashiwagi, T.; Katsuhara, M.; Wang, C.; Tanoi, K.; Murata, Y.; et al. OsHKT1;4-mediated Na+transport in stems contributes to Na+exclusion from leaf blades of rice at the reproductive growth stage upon salt stress.BMC Plant Biol.2016,16, 22. [CrossRef]
[PubMed]
12. Sakamoto, A.; Murata, A.; Murata, N. Metabolic engineering of rice leading to biosynthesis of glycinebetaine and tolerance to salt and cold.Plant Mol. Biol.1998,38, 1011–1019. [CrossRef] [PubMed]
13. Sakamoto, A.; Murata, N. Genetic engineering of glycinebetaine synthesis in plants: Current status and implications for enhancement of stress tolerance.J. Exp. Bot.2000,51, 81–88. [CrossRef] [PubMed] 14. Wani, S.H.; Singh, N.B.; Haribhushan, A.; Mir, J.I. Compatible Solute Engineering in Plants for Abiotic Stress
Tolerance - Role of Glycine Betaine.Curr. Genom.2013,14, 157–165. [CrossRef] [PubMed]
15. Miller, G.; Suzuki, N.; Ciftci-Yilmaz, S.; Mittler, R. Reactive oxygen species homeostasis and signalling during drought and salinity stresses.Plant Cell Environ.2010,33, 453–467. [CrossRef] [PubMed]
16. Bose, J.; Rodrigo-Moreno, A.; Shabala, S. ROS homeostasis in halophytes in the context of salinity stress tolerance.J. Exp. Bot.2014,65, 1241–1257. [CrossRef] [PubMed]
17. Biswal, B.; Joshi, P.N.; Raval, M.K.; Biswal, U.C. Photosynthesis, a global sensor of environmental stress in green plants: Stress signalling and adaptation.Curr. Sci.2011,101, 47–56.
18. Ozgur, R.; Uzilday, B.; Sekmen, A.H.; Turkan, I. Reactive oxygen species regulation and antioxidant defence in halophytes.Funct. Plant Biol.2013,40, 832–847. [CrossRef]
19. Luna, C.; Seffino, L.G.; Arias, C.; Taleisnik, E. Oxidative stress indicators as selection tools for salt tolerance. Plant Breed.2000,119, 341–345. [CrossRef]
20. Mittler, R. Oxidative stress, antioxidants and stress tolerance.Trends Plant Sci.2002,7, 405–410. [CrossRef] 21. Miller, G.; Shulaev, V.; Mittler, R. Reactive oxygen signaling and abiotic stress. Physiol. Plant. 2008,133,
481–489. [CrossRef] [PubMed]
22. Turkan, I.; Demiral, T. Recent developments in understanding salinity tolerance.Environ. Exp. Bot.2009,67, 2–9. [CrossRef]
23. Demidchik, V.; Cuin, T.A.; Svistunenko, D.; Smith, S.J.; Miller, A.J.; Shabala, S.; Sokolik, A.; Yurin, V. Arabidopsis root K+-efflux conductance activated by hydroxyl radicals: Single-channel properties, genetic basis and involvement in stress-induced cell death.J. Cell Sci.2010,123, 1468–1479. [CrossRef] [PubMed] 24. Xie, Y.J.; Xu, S.; Han, B.; Wu, M.Z.; Yuan, X.X.; Han, Y.; Gu, Q.A.; Xu, D.K.; Yang, Q.; Shen, W.B. Evidence of
Arabidopsis salt acclimation induced by up-regulation of HY1 and the regulatory role of RbohD-derived reactive oxygen species synthesis.Plant J.2011,66, 280–292. [CrossRef] [PubMed]
25. Khan, M.H.; Panda, S.K. Alterations in root lipid peroxidation and antioxidative responses in two rice cultivars under NaCl-salinity stress.Acta Physiol. Plant.2008,30, 81–89. [CrossRef]
27. Vellosillo, T.; Vicente, J.; Kulasekaran, S.; Hamberg, M.; Castresana, C. Emerging complexity in reactive oxygen species production and signaling during the response of plants to pathogens.Plant Physiol.2010, 154, 444–448. [CrossRef] [PubMed]
28. Karuppanapandian, T.; Moon, J.C.; Kim, C.; Manoharan, K.; Kim, W. Reactive oxygen species in plants: Their generation, signal transduction, and scavenging mechanisms.Aust. J. Crop Sci.2011,5, 709–725.
29. Demidchik, V.; Straltsova, D.; Medvedev, S.S.; Pozhvanov, G.A.; Sokolik, A.; Yurin, V. Stress-induced electrolyte leakage: The role of K+-permeable channels and involvement in programmed cell death and metabolic adjustment.J. Exp. Bot.2014,65, 1259–1270. [CrossRef] [PubMed]
30. Shabala, S.; Pottosin, I. Regulation of potassium transport in plants under hostile conditions: Implications for abiotic and biotic stress tolerance.Physiol. Plant.2014,151, 257–279. [CrossRef] [PubMed]
31. Kim, S.Y.; Lim, J.H.; Park, M.R.; Kim, Y.J.; Park, T.I.; Se, Y.W.; Choi, K.G.; Yun, S.J. Enhanced antioxidant enzymes are associated with reduced hydrogen peroxide in barley roots under saline stress. J. Biochem. Mol. Biol.2005,38, 218–224. [CrossRef] [PubMed]
32. Hasanuzzaman, M.; Hossain, M.A.; da Silva, J.A.T.; Fujita, M. Plant response and tolerance to abiotic oxidative stress: Antioxidant defense is a key factor. InCrop Stress and Its Management: Perspectives and Strategies; Venkateswarlu, B., Shanker, A., Shanker, C., Maheswari, M., Eds.; Springer: Dordrecht, The Netherlands, 2012; pp. 261–315.
33. Dionisio-Sese, M.L.; Tobita, S. Antioxidant responses of rice seedlings to salinity stress.Plant Sci.1998,135, 1–9. [CrossRef]
34. Sairam, R.K.; Srivastava, G.C.; Agarwal, S.; Meena, R.C. Differences in antioxidant activity in response to salinity stress in tolerant and susceptible wheat genotypes.Biol. Plant.2005,49, 85–91. [CrossRef]
35. Gill, S.S.; Tuteja, N. Reactive oxygen species and antioxidant machinery in abiotic stress tolerance in crop plants.Plant Physiol. Biochem.2010,48, 909–930. [CrossRef] [PubMed]
36. Allen, R.D. Dissection of oxidative stress tolerance using transgenic plants.Plant Physiol.1995,107, 1049–1054.
[CrossRef] [PubMed]
37. Rizhsky, L.; Hallak-Herr, E.; Van Breusegem, F.; Rachmilevitch, S.; Barr, J.E.; Rodermel, S.; Inze, D.; Mittler, R. Double antisense plants lacking ascorbate peroxidase and catalase are less sensitive to oxidative stress than single antisense plants lacking ascorbate peroxidase or catalase.Plant J.2002,32, 329–342. [CrossRef]
[PubMed]
38. Mittler, R. ROS are good.Trends Plant Sci.2017,22, 11–19. [CrossRef] [PubMed]
39. Joo, J.H.; Bae, Y.S.; Lee, J.S. Role of auxin-induced reactive oxygen species in root gravitropism.Plant Physiol. 2001,126, 1055–1060. [CrossRef] [PubMed]
40. Bartoli, C.G.; Casalongue, C.A.; Simontacchi, M.; Marquez-Garcia, B.; Foyer, C.H. Interactions between hormone and redox signalling pathways in the control of growth and cross tolerance to stress. Environ. Exp. Bot.2013,94, 73–88. [CrossRef]
41. Baxter, A.; Mittler, R.; Suzuki, N. ROS as key players in plant stress signalling.J. Exp. Bot.2014,65, 1229–1240.
[CrossRef] [PubMed]
42. Schmidt, R.; Schippers, J.H.M. ROS-mediated redox signaling during cell differentiation in plants. BBA Gen. Subj.2015,1850, 1497–1508. [CrossRef] [PubMed]
43. Mignolet-Spruyt, L.; Xu, E.J.; Idanheimo, N.; Hoeberichts, F.A.; Muhlenbock, P.; Brosche, M.; Van Breusegem, F.; Kangasjarvi, J. Spreading the news: Subcellular and organellar reactive oxygen species production and signalling.J. Exp. Bot.2016,67, 3831–3844. [CrossRef] [PubMed]
44. Maksimovic, J.D.; Zhang, J.Y.; Zeng, F.R.; Zivanovic, B.D.; Shabala, L.; Zhou, M.X.; Shabala, S. Linking oxidative and salinity stress tolerance in barley: Can root antioxidant enzyme activity be used as a measure of stress tolerance?Plant Soil2013,365, 141–155. [CrossRef]
45. Noreen, Z.; Ashraf, M. Assessment of variation in antioxidative defense system in salt-treated pea (Pisum sativum) cultivars and its putative use as salinity tolerance markers. J. Plant Physiol. 2009, 166, 1764–1774. [CrossRef] [PubMed]
46. Seckin, B.; Sekmen, A.H.; Türkan, I. An enhancing effect of exogenous mannitol on the antioxidant enzyme activities in roots of wheat under salt stress.J. Plant Growth Regul.2009,28, 12. [CrossRef]
Int. J. Mol. Sci. 2018,19, 702 16 of 18
48. Demidchik, V.; Shabala, S.N.; Coutts, K.B.; Tester, M.A.; Davies, J.M. Free oxygen radicals regulate plasma membrane Ca2+and K+-permeable channels in plant root cells. J. Cell Sci. 2003,116, 81–88. [CrossRef]
[PubMed]
49. Shabala, S. Signalling by potassium: Another second messenger to add to the list? J. Exp. Bot. 2017,68, 4003–4007. [CrossRef] [PubMed]
50. Chen, Z.H.; Hills, A.; Lim, C.K.; Blatt, M.R. Dynamic regulation of guard cell anion channels by cytosolic free Ca2+concentration and protein phosphorylation.Plant J.2010,61, 816–825. [CrossRef] [PubMed] 51. Bose, J.; Pottosin, I.I.; Shabala, S.S.; Palmgren, M.G.; Shabala, S. Calcium efflux systems in stress signaling
and adaptation in plants.Front. Plant Sci.2011,2, 85. [CrossRef] [PubMed]
52. Wang, Y.Z.; Chen, Z.H.; Zhang, B.; Hills, A.; Blatt, M.R. PYR/PYL/RCAR abscisic acid receptors regulate K+and Cl−channels through reactive oxygen species-mediated activation of Ca2+channels at the plasma membrane of intact Arabidopsis guard cells.Plant Physiol.2013,163, 566–577. [CrossRef] [PubMed] 53. Wu, H.H.; Zhu, M.; Shabala, L.; Zhou, M.X.; Shabala, S. K+ retention in leaf mesophyll, an overlooked
component of salinity tolerance mechanism: A case study for barley.J. Integr. Plant Biol.2015,57, 171–185.
[CrossRef] [PubMed]
54. Wu, H.H.; Shabala, L.; Zhou, M.X.; Shabala, S. Durum and bread wheat differ in their ability to retain potassium in leaf mesophyll: Implications for salinity stress tolerance.Plant Cell Physiol.2014,55, 1749–1762.
[CrossRef] [PubMed]
55. Halliwell, B.; Gutteridge, J.M.C.Free Radicals in Biology and Medicine, 5th ed.; Oxford University Press: New York, NY, USA, 2015; pp. 38–40.
56. Pei, Z.M.; Murata, Y.; Benning, G.; Thomine, S.; Klusener, B.; Allen, G.J.; Grill, E.; Schroeder, J.I. Calcium channels activated by hydrogen peroxide mediate abscisic acid signalling in guard cells.Nature2000,406, 731–734. [CrossRef] [PubMed]
57. Jiang, C.F.; Belfield, E.J.; Mithani, A.; Visscher, A.; Ragoussis, J.; Mott, R.; Smith, J.A.C.; Harberd, N.P. ROS-mediated vascular homeostatic control of root-to-shoot soil Na delivery inArabidopsis.EMBO J.2012, 31, 4359–4370. [CrossRef] [PubMed]
58. Zhu, M.; Zhou, M.X.; Shabala, L.; Shabala, S. Physiological and molecular mechanisms mediating xylem Na+ loading in barley in the context of salinity stress tolerance.Plant Cell Environ.2017,40, 1009–1020. [CrossRef]
[PubMed]
59. De la Garma, J.G.; Fernandez-Garcia, N.; Bardisi, E.; Pallol, B.; Rubio-Asensio, J.S.; Bru, R.; Olmos, E. New insights into plant salt acclimation: The roles of vesicle trafficking and reactive oxygen species signalling in mitochondria and the endomembrane system.New Phytol.2015,205, 216–239. [CrossRef] [PubMed] 60. Hanin, M.; Ebel, C.; Ngom, M.; Laplaze, L.; Masmoudi, K. New insights on plant salt tolerance mechanisms
and their potential use for breeding.Front. Plant Sci.2016,7, 1787. [CrossRef] [PubMed]
61. Apel, K.; Hirt, H. Reactive oxygen species: Metabolism, oxidative stress, and signal transduction.Annu. Rev. Plant Biol.2004,55, 373–399. [CrossRef] [PubMed]
62. Schieber, M.; Chandel, N.S. ROS function in redox signaling and oxidative stress. Curr. Biol. 2014, 24, R453–R462. [CrossRef] [PubMed]
63. Demidchik, V. Mechanisms and physiological roles of K+efflux from root cells.J. Plant Physiol.2014,171, 696–707. [CrossRef] [PubMed]
64. Sies, H. Strategies of antioxidant defense.Eur. J. Biochem.1993,215, 213–219. [CrossRef] [PubMed]
65. Cuin, T.A.; Shabala, S. Compatible solutes reduce ROS-induced potassium efflux in Arabidopsis roots. Plant Cell Environ.2007,30, 875–885. [CrossRef] [PubMed]
66. Ashraf, M.; Foolad, M.R. Roles of glycine betaine and proline in improving plant abiotic stress resistance. Environ. Exp. Bot.2007,59, 206–216. [CrossRef]
67. Chen, T.H.; Murata, N. Glycinebetaine: An effective protectant against abiotic stress in plants.Trends Plant Sci. 2008,13, 499–505. [CrossRef] [PubMed]
68. Pandolfi, C.; Pottosin, I.; Cuin, T.; Mancuso, S.; Shabala, S. Specificity of polyamine effects on NaCl-induced ion flux kinetics and salt stress amelioration in plants. Plant Cell Physiol. 2010,51, 422–434. [CrossRef]