This is a repository copy of
Compound driven differences in N2 and N2O emission from
soil; the role of substrate use efficiency and the microbial community
.
White Rose Research Online URL for this paper:
http://eprints.whiterose.ac.uk/110171/
Version: Accepted Version
Article:
Giles, M.E., Daniell, T.J. and Baggs, E.M. (2017) Compound driven differences in N2 and
N2O emission from soil; the role of substrate use efficiency and the microbial community.
Soil Biology and Biochemistry, 106. pp. 90-98. ISSN 0038-0717
https://doi.org/10.1016/j.soilbio.2016.11.028
Article available under the terms of the CC-BY-NC-ND licence
(https://creativecommons.org/licenses/by-nc-nd/4.0/)
[email protected] https://eprints.whiterose.ac.uk/ Reuse
This article is distributed under the terms of the Creative Commons Attribution-NonCommercial-NoDerivs (CC BY-NC-ND) licence. This licence only allows you to download this work and share it with others as long as you credit the authors, but you can’t change the article in any way or use it commercially. More
information and the full terms of the licence here: https://creativecommons.org/licenses/
Takedown
If you consider content in White Rose Research Online to be in breach of UK law, please notify us by
1
Compound driven differences in N2 and N2O emission from soil; the role of substrate1
use efficiency and the microbial community
2
3
Madeline E Gilesab*, Tim J Daniellbc, Elizabeth M Baggsa
4
5
aSchool of Biological Sciences, University of Aberdeen, Cruickshank Building, St
6
Machar Drive, Aberdeen, AB24 3UU, UK
7
8
bTheJames Hutton Institute, Invergowrie, Dundee, DD2 5DA, UK
9
10
cDepartment of Animal and Plant Sciences, University of Sheffield, Sheffield S10
11
2TN, UK
12
13
14
15
* author for correspondence:
16
17
TheJames Hutton Institute, Invergowrie, Dundee
18
+44 01382568797
19
2
Abstract23
Organic C is an important control on the process of denitrification, a process that can
24
result in the production and reduction of the potent greenhouse gas nitrous oxide
25
(N2O). This study identified the influence of different low molecular weight C
(LMW-26
C) compounds on the production of nitrous oxide (N2O) and dinitrogen (N2) and the
27
associated role of the size and structure of the microbial community. We examined
28
this following application of glucose, glutamine or citric acid (250 mg C kg-1 dry soil)
29
and 15N-KNO3 (100 mg N kg-1 dry soil) to a sandy loam soil and measured the
30
production of N2 and N2O by denitrifiers using 15N labeling techniques, changes in the
31
bacterial community as measured by T-RFLP on 16SrDNA fragments and changes in
32
the gene copy number of 16SrDNA, nirK, nirS and nosZ over 144 hours. Addition of
33
glucose, citric acid and glutamine all increased emissions of 15N-N2 above that found
34
in the control (P < 0.05) while the addition of glucose and glutamine resulted in
35
higher emissions of 14+15N-N2O (P < 0.001) than the addition of citric acid, resulting in
36
a lower 15N-N2O to 15N-N2 ratio in the citric acid treatment. The 16SrDNA gene copy
37
number increased after addition of citric acid and glutamine, whilst 16SrDNA showed
38
significant shifts in community composition in all C treatments although over different
39
time periods. The gene copy number of nosZ only significantly increased at 120
40
hours in the glutamine treatment (P < 0.05) and nirS at 120 hours in the citric acid
41
and glutamine treatments(P < 0.05). This suggests that where C is added as a
42
single input, differences in N2 and N2O emissions between LMW-C compounds were
43
not caused by selection for denitrifiers but likely driven by differences in substrate
44
use efficiency and subsequent differences in C partitioning between growth and
45
respiration. The differing influence of the three selected C compounds on
46
denitrification indicates the potential for lowering net N2O emissions through
47
regulation of C compound availability.
48
49
Key words; Carbon, denitrification, nitrous oxide, nosZ, nirK, nirS
3
1 Introduction51
Soils are an important source of N2O, a greenhouse gas with a global warming
52
potential around 300 times greater than that of CO2 over a 100 year period (Forster
53
et al., 2007). The global atmospheric concentration of N2O has increased from
pre-54
industrial levels of 270 ppb to 319 ppb as of 2005 (Forster et al., 2007), with
55
emissions from agricultural soils increasing from 2.4 Tg N-N2O yr-1 in 1990 to 6.6 Tg
56
N-N2O yr-1 in 2000 and representing one of the most important sources of N2O
57
(Bouwman et al., 2013). The microbial process of denitrification, the stepwise
58
reduction of NO3- to N2, is thought to be responsible for ~ 60% of global N2O
59
emissions from agricultural soils (Smith et al., 2007). It is believed that emissions
60
from soils can be lowered under conditions favorable to the final step in
61
denitrification
,
the reduction of N2O to N2 (Richardson et al., 2009). Denitrification is62
performed by facultative anaerobic microorganisms as a means of maintaining
63
respiration under O2 limited conditions where NO3, NO2-, NO and N2O are used as
64
alternative electron receptors (Zumft, 1997). Carbon remains as the electron donor
65
for all of the possible reduction steps so the presence of organic C is an important
66
control of both the production and reduction of N2O, with high concentrations of labile
67
C found to promote the reduction of N2O to N2 when NO3- is limiting(Weier et al.,
68
1993). As denitrification is predominately a biological process the relative abundance
69
and structure of the denitrifying community plays a crucial role in facilitating the
70
production and reduction of N2O. However, whilst there is a growing body of
71
evidence of the role of C quantity in regulating N2O production in soil (Morley et al.,
72
2014), we know comparatively little about the effects of the form of C substrate, or on
73
the interaction between C substrate and the denitrifying bacterial community.
74
75
Dissolved organic C (DOC) in soil is comprised of a wide variety of C compounds
76
and within the soil matrix the quantity and composition of this DOC can vary over
77
4
2015). In the rhizosphere plant roots provide a wide range of low molecular weight C79
(LMW-C) compounds, through rhizodeposition (Nguyen, 2003), to soil surrounding a
80
root. This, together with root respiration driving down oxygen availability, results in
81
higher denitrification rates and subsequently higher N2O production in the
82
rhizosphere compared to the bulk soil (Højberg et al., 1996; Mahmood et al., 1997).
83
Controls on denitrification in the rhizosphere are likely to be driven not only by
84
increased C availability but also the form this C takes. The range of rhizodeposited
85
compounds is broad and comprises sugars, organic acids and amino acids (Nguyen,
86
2003), which are highly labile and can have half-lives as short as minutes (Paterson
87
et al., 2008).
88
89
Studies have demonstrated differences in the rates and potential rates of
90
denitrification as well as in the reduction of N2O to N2 between different LMW-C
91
compound amendments to soil (Morley et al., 2014; Murray et al., 2004; Dendoovan
92
et al., 1996). Morley et al. (2014) found the addition of organic acids to soil resulted in
93
higher N2O-to-N2 ratios than sugars or amino acids and suggested that there was
94
variation in the efficiency of nitrate metabolism by nitrate reductase with different
95
LMW-C compounds. However efficiency of C compound use is likely to be one of a
96
number of complex interacting controls on the effects of substrate dependence on
97
denitrification and may act through alteration of microbial community dynamics either
98
in terms of structure or abundance. Environmental variables are known to be
99
important controls on process rates but the composition of the microbial community
100
has also been shown to be an important predictor (Graham et al. 2016), so to lower
101
net N2O emissions from soils by promoting reduction to N2 (Richardson et al., 2009),
102
it is important to understand the drivers shaping the denitrifier community and how
103
this relates to denitrification N2O-to-N2 product ratios.
104
5
The community may play a key role in determining the effects of different C106
compounds by controlling the efficiency with which soil substrates can be used and
107
subsequently the fate of soil C. Studies on aerobic respiration have shown
108
differences in the partitioning of C compounds between growth and respiration
109
(Fischer et al., 2010). Greater substrate use efficiency promotes growth in
110
microorganisms (Manzoni et al., 2012; Sinsabaugh et al., 2013), which can lower the
111
C available for respiration. A similar mechanism is likely to affect denitrification with
112
compounds that promote growth lowering the C and N available for respiration via
113
denitrification and thus lowering the rates of denitrification and the reduction of NO3
-114
to N2O and N2. However, C form may provide a selective pressure for the microbial
115
community, selecting communities able to most efficiently utilise the C compound
116
added; consequently the addition of different forms of C is known to result in the
117
formation of C compound specific communities (Fierer et al., 2007; Eilers et al.,
118
2010). It remains unclear whether, under conditions that induce denitrification,
119
increased substrate use efficiency and lower C availability could alter rates of
120
denitrification and N2O-to-N2 ratios and if this is driven bythe presence of
121
communities more able to rapidly utilize the form of available C.
122
123
Different LMW-C additions have been found to lead to varying abundances of narG,
124
encoding for nitrate reductase and nosZ encoding for N2O reductase (Henry et al.,
125
2008). This initial finding suggests that LMW-C compounds have the ability to select
126
for organisms able to carry out specific denitrification steps. Whilst relationships have
127
been found between denitrifier abundance and both potential denitrification rates and
128
N2O fluxes (Petersen et al. 2012; Lammel et al. 2015), the high functional
129
redundancy involved in denitrification (Wallenstein et al., 2006), the facultative nature
130
of the process and competition for LMW-C within the soil community as a whole may
131
limit the relationship between denitrifiers and net N2O emission. This necessitates
132
6
dynamics as well as N2O production and reduction in order to better understand the134
complex interaction between LMW-C, the microbial community and resulting net N2O
135
emission.
136
137
The objectives of our study were 1) to determine if the addition of 3 different
138
commonly rhizodeposited LMW-C compounds result in differences in N2 and N2O
139
emissions from soil incubated under controlled conditions, 2) to identify relationships
140
between N2, N2O and CO2 emissions and 16SrDNA gene copy number, as an
141
indirect measure of substrate use efficiency and C partitioning, 3) to determine if
142
changes in the bacterial community as measured by T-RFLP on 16SrDNA fragments
143
and abundance of denitrifiers are more important regulators of N2O emissions than
144
the substrate use efficiency and C partitioning of the initial soil community. We
145
hypothesised that a) addition of C would increase N2O emissions compared with the
146
un-amended control, and there would be differences in the quantity of N2 and N2O
147
produced between each of the C treatments; b) the structure of the microbial
148
community would change following addition of C, but that this change would be
149
slower than the production of N2O so the substrate use efficiency of the initial soil
150
community and C partitioning between growth and respiration would be the main
151
determinates of N2O and N2 emissions.
152
153
2. Materials and methods
154
2.1 Experimental set-up
155
The soil used was an agricultural Dystric Cambisol soil (sandy loam) from Insch
156
Aberdeenshire, North East Scotland (57°33 N; 2°63 W) and was selected as it
157
represented a typical Scottish agricultural soil which had been well characterised and
158
used in other studies (Morley et al., 2014). The soil had a starting pH of 6.7 and was
159
comprised of 57.7% sand, 30.8% silt and 11.5% clay (Morley et al., 2014). Soil was
160
7
cm high, 5.75 cm diameter), and packed to a bulk density of 0.64 g cm-3. The soil162
water-filled pore space (WFPS) was brought to 90 % and maintained by watering to
163
weight daily, to ensure the soil maintained anaerobic conditions.
164
165
Treatments consisted of an addition of 100 mg N kg-1 dry weight soil, added as 15
N-166
labeled KNO3 (19 atom % 15N excess) and 250 mg C kg-1 dry weight soil as glucose,
167
glutamine or citric acid (69.4, 83.3 and 69.4 mM, respectively), representing one of
168
each of the most commonly rhizodeposited groups of C compounds; sugars, amino
169
acids and organic acids (Nguyen, 2003). A control was established with the same N
170
addition but no C added. Treatments and control were replicated five times for each
171
time point (0, 12, 24, 36, 48, 72, 96, 120 and 144 hours after amendment). At time 0
172
N and C compounds were added by mixing 5 ml of a combined C and N solution
173
described above with the soil whilst maintaining water contents at 90% WFPS.
174
Samples for 14+15N-N2O and C-CO2 analysis were taken every 12 hours from time 0,
175
and pots for molecular analyses, 15N-N2, 15N-N2O, N-NO3-, DOC and pH analyses
176
were destructively sampled every 24 hours.
177
178
2.2 Gas sampling and analysis
179
Gas samples were taken by placing pots into 500 cm3 gas-tight Kilner jars, allowing
180
gas to accumulate in the closed head space for an hour. Linearity of gas
181
accumulation over this time period had previously been determined. At each
182
designated gas sampling time point one 12 ml gas sample was taken from the
183
headspace of the Kilner jar (5 replicates per treatment), using a gas-tight syringe,
184
and stored in an evacuated 12 ml gas vial (Labco) prior to 14+15N-N2O and C-CO2
185
analyses. Every 24 hours an additional 120 ml gas sample was taken from each jar
186
and stored in a He-flushed, pre-evacuated 120 ml bottle (Supelco) for 15N-N2 and
187
15
N-N2O analysis.
188
8
14+15N-N2O and C-CO2 concentrations were determined on an Agilent 6890 gas
190
chromatograph, fitted with a flame ionization detector, an electron capture detector
191
and a methaniser. The column was a Haysep Q, with N2 carrier gas and an oven
192
temperature of 100 ºC. CO2 was converted to CH4 in the methaniser followed by
193
detection on the flame ionization detector. The 120 ml gas samples were analysed
194
for 15N enrichment of N2 andN2O using a Sercon Ltd isotope ratio mass spectrometer
195
following cryofocusing in an ANCA TGII gas preparation module. The concentration
196
of 15N-N2Owas taken as indicative of N2O production from nitrate reduction, primarily
197
denitrification (Baggs et al., 2003), while 14+15N-N2O concentrations were
198
representative of both nitrate reducing and ammonia oxidizing processes.
199
200
2.3 Soil mineral N, DOC and pH determination
201
Every 24 hours individual pots that had been sampled for 15N-N2, 15N-N2O, 14+15
N-202
N2O and C-CO2 were homogenized by mixing and subsequently destructively
203
sampled (5 replicates per treatment). NO2- and NO3- were extracted from 20 g of soil
204
using 1 M KCl and measured on a Fiastar 500 Flow Injection Analyser (Foss
205
Analytical Ltd, Warrington UK). The 15N enrichment of NO3- in these extracts was
206
determined by analysis on the isotope ratio mass spectrometer following gas
207
diffusion (Brooks et al., 1989). From the same pot of soil, a separate 20 g sample of
208
soil was taken for determination of DOC. DOC was extracted in 0.5 M K2SO4 and
209
measured on a LABTOC analyser (Pollution and process monitoring Ltd, Nottingham
210
UK). The pH was determined from soil suspended in 0.01 M CaCl2 (F.8L, Horiba Ltd,
211
Kyoto Japan).
212
213
2.4 Relative real time PCR and 16SrDNA TRFLP
214
At 12, 36, 60, 96 and 120 hours 5 replicate pots for each treatment were sampled for
215
14+15
N-N2O and CO2 before being destructively sampled as described above. 0.5 g of
216
9
and stored at - 80 °C prior to analysis. Nucleic acid was extracted from the 0.5 g soil218
samples using a phenol chloroform extraction (Deng et al., 2010) with 1 x 10⁸ copies
219
of a mutated DNA spike added to the lysis buffer to act as an internal standard for
220
relative real time-PCR (Daniell et al., 2012).
221
222
The gene copy number of the mutated spike standard, 16SrDNA gene, nirK, nirS and
223
nosZ was quantified using relative real time-PCR (Light cycler 480, Roche, Basel,
224
Switzerland) using primers and conditions listed in Table 1. For all four primers 2 µl
225
of template was added to 6 µl of sterile milli Q water, 10 pmol of each of the forward
226
and the reverse primers and 10 µl of SYBR green I master mix (Roche).
227
228
T-RFLP was performed on the 16SrDNA gene. The fluorescently labelled 16F27 –
229
FAM AGAGTTTGATCCTGGCTCAG and 1392R – HEX ACGGGCGRTGTGT ACA
230
primers were used (Blackwood et al., 2003) as were the following conditions 94 oC for
231
4.5 min, 30 cycles of 94 oC for 30 s, 57 oC for 30 s, 68 oC for 90 s and a final step of
232
68 oC for 10 min. T-RFLP digests were performed as described in Deng et al. (2010).
233
234
2.5 Statistical analyses
235
Data were analysed using the R statistical language in the R base environment
236
(version 3.0.1). As pots were destructively sampled at each time point, data were
237
assumed to be independent. Differences in means between grouping variables were
238
tested using ANOVA, the presence of linear relationships between variables were
239
tested using correlations and linear regression depending on whether a causative
240
relationship was assumed. All data were checked for normality and homogeneity of
241
variance. T-RFLP data were processed using GeneMapper (Applied Biosystems,
242
Paisley, UK) after which peaks that contributed less than 1 % of the fluorescence in
243
each sample were removed. The resulting data were Hellinger transformed and used
244
10
mean PC scores between grouping variables (Deng et al., 2009). Gas samples were246
initially collected as rate measurements this was converted to total concentrations of
247
15
N-N2,14+15 N-N2O, 15N-N2O and C-CO2 by plotting graphs of rate of gas production
248
against time in Microsoft Excel and calculating the area under the graphs.
249
250
3 Results
251
3.1 Emissions of 14+15N-N2O, 15N-N2O, 15N-N2 and C-CO2
252
At 144 hours the cumulative concentration of 14+15N-N2O was significantly higher than
253
the control in all 3 C treatments, while both glucose and glutamine treatments had
254
significantly higher concentrations of 14+15N-N2O than citric acid treatments (P <
255
0.001). 15N-N2O produced in the glucose treatments was significantly higher ( P <
256
0.05) than those of the control, with the citric acid and glutamine treatments
257
intermediate but not significantly different from the control (Fig. 1a). Concentrations
258
of 15N-N2 at 144 hours were significantly higher than the control in all three C
259
treatments (P < 0.05) (Fig. 1b), while ratios of 15N-N2O-to-15N-N2 were significantly
260
higher than the control in the glucose and glutamine treatments (P < 0.05) (Fig. 1c).
261
The emissions of 15N-N2O were lower than that of 15N-N2 in all treatments, making
262
15
N-N2 the predominant product of denitrification in this experiment. Concentrations of
263
C-CO2 at 144 hours were significantly greater (P < 0.001) than the control in all three
264
C treatments but did not differ between the C treatments (Fig. 1d). In all three C
265
treatments the concentrations of 14+15N-N2O, 15N-N2O, 15N-N2 increased over time
266
(glucose; 14+15N-N2O P < 0.001, 15N-N2O P < 0.005, 15N-N2P < 0.01, citric acid;
267
14+15
N-N2O P < 0.001, 15N-N2O P < 0.01, 15N-N2P < 0.005, glutamine; 14+15N-N2O P <
268
0.001, 15N-N2O P < 0.005, 15N-N2P < 0.001). This was not the case in control
269
treatments where only 14+15N-N2O showed a significant increase in concentrations
270
over time (P < 0.001) (data not shown).
271
11
There were positive relationships between the concentrations of 14+15N-N2O andC-273
CO2 in all C treatments (Table 2), with the greatest increase in 14+15N-N2O per unit
274
increase in C-CO2 in the glucose treatment and lowest in citric acid treatments.
275
Similarly there were significant linear relationships between 15N-N2 and C-CO2 in both
276
glucose and citric acid treatments (Table 2).
277
278
3.2 Soil DOC concentrations, N-NO3- concentrations and soil pH
279
Soil DOC concentrations decreased over time in all three C treatments. The most
280
rapid decrease occurred between 0 and 24 hours in the C treatments (Fig. 2). At 144
281
hours there was no significant difference in DOC concentrations between any of the
282
C treatments or the control suggesting that all added C had been utilized by the end
283
of the experiment. DOC concentrations remained raised for longest in the citric acid
284
treatments. Regression analysis showed that DOC concentrations were significantly
285
related to 14+15N-N2O concentrations in the glutamine treatment and to 15N-N2 in all
286
the C treatments (Table 2). Neither the soil NO3- concentrations nor the DOC-to-NO3
-287
significantly correlated with concentrations of C-CO2, 14+15N-N2O, 15N-N2O or 15N-N2.
288
289
At 24 hours soil pH varied between treatments (P < 0.001), with both glucose and
290
citric acid treatment showing a significantly lower pH than the control (glucose 5.64 ±
291
0.05, citric acid 5.35 ± 0.15). By 144 hours there was no difference in pH between
292
any of the treatments. Regression analysis showed that pH did not significantly
293
correlate with concentrations of 14+15N-N2O, 15N-N2O, 15N-N2 and C-CO2.
294
295
3.316SrDNA, nirK, nirS and nosZ gene copy number and 16SrDNA T-RFLP
296
The 16SrDNA gene copy number increased linearly over time in the citric acid (P <
297
0.001, R2 = 55 %) and glutamine (P < 0.05, R2 = 42 %) treatments in contrast to the
298
gene copy numbers of nirK, nirS and nosZ which did not increase linearly over time
299
12
changes in these gene copy numbers over the course of the experiment. In both301
glucose and citric acid treatments there was a significant dip in the gene copy
302
numbers of nirK. This occurred at 96 hours in the glucose treatment when copy
303
numbers were lower than at 12 and 120 hours (P < 0.05) and at 60 hours in the citric
304
acid treatment when copy numbers were lower than at 12, 36 or 120 hours (P <
305
0.05). In both cases the population of nirK containing organisms recovered by 120
306
hours. In addition, the ratio of 16SrDNA-to-nirK increased with time in both citric acid
307
(P < 0.05, R2 = 31 %) and glutamine treatments (P < 0.05, R2 = 36 %).
308
309
More dramatic changes in gene copy number were observed with nirS where
310
glutamine and citric acid drove higher counts of this gene at 120 hours (citric acid P <
311
0.05, glutamine P < 0.05). nosZ gene copy numbers also showed a significant
312
increase in the glutamine treatment where they increased over time, with the
313
exception of 96 hours, and were higher at 120 hours than at 12 or 36 hours (P <
314
0.05).
315
316
PCA of the 16SrDNA T-RF’s and an ANOVA on the resulting PC scores for
317
components 1 and 2 indicated that differences in T-RF profiles were driven by both
318
compounds and time and the interaction between them (Fig. 4) (PC 1 P < 0.005, PC
319
2 P < 0.001). There was no shift in PC scores in the control treatment. In contrast the
320
citric acid treatment changed along PC 1 from 36 to 60 hours and when compared to
321
the control showed the greatest difference in T-RF profiles at 60 hours. By 96 hours
322
community composition appeared to be reverting back to the composition found in
323
the control. Glucose and glutamine treatments initially showed a shift in T-RF profiles
324
along PC 2, although this shift occurred faster in the glutamine treatment. T-RF
325
profiles were most different from the control at 12 hours in the glutamine treatment
326
13
RF profiles closer to that of the control suggesting community composition changes328
were transient.
329
330
4. Discussion
331
The quantity of N2O and N2 produced and the 15N-N2O-to-15N-N2 ratio varied between
332
the C treatments applied in this study, indicating the importance of considering the
333
form of C as a control on denitrification. In many studies available soil C is
334
considered as a single compound and glucose is often used as the sole
335
representative of LMW-C (Dandie et al., 2007; Miller et al., 2008), despite plant roots
336
being able to produce a complex mix of LMW-C compounds that, within soil, can vary
337
over small spatial and temporal scales (Giles et al., 2012). While there is growing
338
recognition of compound dependent effects on denitrification, that have been found
339
to vary from responses to glucose (Murray et al., 2004; Henry et al., 2008; Morley et
340
al., 2014), little consideration has been given to the cause of these effects. Here we
341
found relationships between DOC, CO2, N2O and N2 which varied between LMW-C
342
compounds suggesting that the efficiency with which the soil community is able to
343
use a C compound and the control that exerts on partitioning C between assimilatory
344
and dissimilatory processes may be one of a number of interacting factors that
345
determine LMW-C compound driven differences in N2 and N2O emissions. The
346
addition of LMW-C did select for nirS and nosZ containing denitrifiers but only in two
347
of three C treatments and the response of N2O and N2 production to a single C input
348
event was not commensurate in time with the shift in denitrification genes. The
349
control exerted by the microbial community is likely to be greater over larger time
350
scales and where more continuous C addition occurs such as in the rhizosphere.
351
Here, where C was in a single addition, the efficiency of C use and its fate was a
352
strong control on the response of denitrification to different C compounds.
353
354
14
14+15N-N2O production from the glucose and glutamine treatments fell within the
356
range of N2O concentration found in similar studies, with comparable conditions
357
where glucose was used as a C source (Murray et al., 2004; Miller et al., 2008;
358
Henderson et al., 2010). In this study N2 was the predominant product of
359
denitrification and in all three C treatments there was between 10-100 times greater
360
emission of N2 than N2O. Consequently there were also differences in the 15N-N2
O-361
to-15N-N2 ratios between C treatments, indicating compound dependent differences in
362
the reduction of N2O to N2. Citric acid, an organic acid, was the most efficient
363
compound at reducing N2O. Differences in N2 and N2O emissions between LMW-C
364
compounds occurred in spite of equal amounts of C being present in the glucose,
365
citric acid and glutamine treatments. The reasons for compound dependent
366
differences in N2 and N2O emissions are likely to be complex and driven by N
367
limitation, the way C is used for competing processes and the interaction of C with
368
both the wider soil matrix and the microbial community present in it. Morley et al.
369
(2014) suggested that controls exerted by the form of C were caused by compound
370
dependent differences in the efficiency of the nitrate reductase. If NO3- becomes
371
limiting to denitrification it is advantageous for denitrifiers to undertake N2O reduction
372
to N2, the least energetically favorable of the denitrification reduction steps (Blackmer
373
and Bremner, 1978). The availability of NO3- will not only be limited by the efficiency
374
of uptake but also by whether NO3- is used in assimilatory or dissimilatory processes.
375
Where NO3- is used for processes such as growth it may result in increased C-to-N
376
ratios which promote the reduction of N2O.
377
378
Soil communities are known to exhibit different C substrate use efficiencies, relating
379
to their ability to use a given substrate for growth as well as cell maintenance. A
380
community with a greater substrate use efficiency will show greater growth per unit
381
consumption of C than a community where low efficiency means that C is
382
15
there is also evidence that the form of LMW-C can affect the fate of C, with Fischer et384
al. (2010) finding that C was partitioned between growth and respiration differently
385
between diverse LMW-C substrates. Here in both glutamine and citric acid
386
treatments, C appeared to be being used for growth with16SrDNA gene copy
387
numbers in these treatments increasing over the course of the experiment. However
388
the NO3- concentrations at the end of the experiment differed between these two
389
treatments with 70 µg N-NO3- per g dry weight soil less in the citric acid treatment
390
than in the glutamine treatment. As growth requires N, NO3- limitation in the citric acid
391
treatment may have resulted in the lower 15N-N2O-to-15N-N2 ratio, while growth in the
392
glutamine treatment did not become N-limited most likely because of the presence of
393
the amine group in glutamine, resulting in higher 15N-N2O-to-15N-N2 ratios despite
394
growth in the bacterial community. The efficiency of a community is believed to be
395
affected by the composition of soil dissolved organic matter (DOM) (Manzoni et al.,
396
2012; Bölscher et al., 2016) with the C-to-N ratio of DOM thought to be responsible
397
for substrate based differences in use efficiencies (Sinsabaugh et al., 2013).
398
Differences in substrate use efficiency in this study are indicated by the variation in
399
the amount of DOC required to support N2 productionin the LMW-C treatments; for
400
every 0.1 mg decrease in DOC concentration there was a 46.7g increase in 15N-N2
401
emission in the citric acid treatment, while this was 175.7g 15N-N2 in the glutamine
402
and 177.3 g 15N-N2 in the glucose treatments. As 15N-N2 emissions at 144 hours
403
were similar between all three LMW-C treatments this strongly indicates that C was
404
not solely being used for denitrification. The presence of higher CO2 emissions and
405
highest production of 15N-N2 per g C-CO2 in the citric acid treatment highlights the
406
importance of considering the fate of C when identifying compound driven differences
407
in denitrification. The role of substrate use efficiency has not been expressly looked
408
16
differences in the efficiency with which different LMW-C compounds are used when410
denitrification is the predominant respiratory pathway.
411
412
Soil is a complex environment and biological, chemical and physical controls will all
413
act in conjunction with each other to determine process rates. Consequently
414
substrate use efficiency will be one of a number of controls on denitrification that will
415
include both the microbial community and the interaction of C compounds with the
416
soil matrix. The interaction of these controls could be seen in the speed at which
417
DOC was depleted; of the three C treatments citric acid was utilised the most slowly.
418
The slow depletion of citric acid is likely linked to the adsorption of citrate ions to soil
419
particles and from studies on aerobic respiration it is known that sorption of organic
420
acids to soil particles can lower their availability for microbial consumption (Van Hees
421
et al., 2003; Osburger et al., 2011).
422
423
4.2 The microbial community as a driver of N2O production
424
The measured bacterial community response differed between the four treatments. In
425
the glucose treatment where there was a lower increase in the bacterial population,
426
there was the slowest shift in the community structure of all the C treatments, the
co-427
occurrence of these two responses may suggest that there was a link between the
428
substrate use efficiency and consequently the partitioning of C between growth and
429
respiration which was important in determining how fast community structure
430
changed in response to a C input.
431
432
It is likely the shifts in bacterial community as measured by16SrDNA represent the
433
formation of communities able to reproduce quickly by rapidly utilising the added C
434
and N (Eilers et al., 2010; Blagodatskaya et al., 2014; Cederlund et al., 2014).It is
435
probable that the effect of changing community structure had only a limited effect on
436
17
in one pulse. Denitrifiers in the glucose treatment were able to rapidly produce N2O438
despite showing the slowest community shift.
439
440
With the exception of nosZ gene copy numbers in the glutamine treatment, over the
441
first 96 hours of the experiment there was no indication for an increase in denitrifier
442
population size, as measured by the gene abundance of the denitrification genes
443
nirK, nirS or nosZ. It is also possible that nirK containing denitrifiers were
444
outcompeted by other members of the heterotrophic community as ratios of
445
16SrDNA-to-nirK decreased over time. While initially it appears that glucose, citric
446
acid and glutamine failed to provide sufficient selective pressure for denitrifiers, by
447
120 hours there was an increase in the abundance of nirS in the citric acid treatment
448
and nirS and nosZ in the glutamine treatment. The response of denitrifiers to a single
449
C input occurred 96 hours after the addition of C when soil DOC concentrations had
450
returned to their pre-experiment levels and at a point in time when the majority of
451
N2O and N2 had already been produced. This slow response may have been due to
452
the presence of residual O2 in soil micropores that is likely to have been consumed
453
by 120 hours, but there is also known to be the potential for a disconnect in time
454
between soil environmental conditions and the structure of the microbial community
455
present. This is most markedly seen in the form of soil legacy effects (Marschner et
456
al., 2015; Banerjee et al., 2016), where historical soil conditions can shape current
457
microbial communities. This temporal disconnect may account for failure to create a
458
selective pressure for denitrifiers on the same time scale to 15N-N2 and N2O
459
emissions. However, it is important to note that the speed or magnitude of change in
460
nosZ may have altered if nosZ clade II containing denitrifiers had also been included
461
in this study (Domeignoz-Horta et al., 2015). Several studies have found no link
462
between denitrification measures and the abundance of denitrification genes (Dandie
463
et al., 2007; Miller et al., 2008; Henderson et al., 2010).
464
18
The short time period of this experiment may in part explain the failure to link466
changes in community dynamics to denitrification although shifts in community size
467
were observed late in the time course; this may be indicative of a mismatch between
468
the time of most rapid nutrient utilisation and the point where community dynamics
469
were changed. This is not always the case and Henry et al., (2008) found that the
470
copy numbers of narG and nosZ varied between treatments amended with artificial
471
rhizodeposits formed of different C compounds added over several days. While it is
472
likely that the form of C can exert a control over denitrification by affecting the rate of
473
community change and selection for denitrifiers, the effects of this may not be seen
474
where C inputs are an isolated event and used rapidly because of the slower
475
response from denitrifiers. In such cases the substrate use efficiency of the initial soil
476
bacterial community and the partitioning of C will play a stronger role in determining
477
compound dependent differences in N2 and N2O emissions.
478
479
The differences in the emission of N2 and N2O following addition of LMW-C
480
compounds highlights the importance of considering the composition of DOC when
481
predicting its effects on denitrification. This is of special importance in the biologically
482
active rhizosphere where plant roots contribute a wide range of rapidly utilised
LMW-483
C compounds to soil (Nguyen 2003). Understanding which C compounds promote
484
the reduction of N2O and the mechanisms by which they do this may help in the
485
selection of crop cultivars with rhizodeposit biochemical compositions that promote
486
the reduction of N2O. However an understanding of how LMW-C compounds
487
influence the microbial community over longer time scales is needed.
488
489
Our results show that compound dependent differences in N2 and N2O emissions are
490
potentially linked to the differences in the substrate use efficiency of initial microbial
491
community between C compounds. Compounds that promote growth resulted in
492
19
controls exerted by different C compounds are also influenced by their interaction494
with the soil matrix. LMW-C compounds that stimulated growth resulted in faster
495
community change, but selection for nirS and nosZ containing denitrifiers occurred
496
after LMW-C additions had been utilised and therefore were unlikely to affect N2 and
497
N2O emissions. It is likely that the mechanisms by which the form of LMW-C
498
influences denitrification will be dependent on the type of C input and in this study
499
where C addition was as a single event, the substrate use efficiency of the initial
500
microbial community was a more important control on the N2O-to-N2 ratio, 15N-N2 and
501
N2O emissions than compound driven differences in the selection for denitrifiers.
502
503
504
Acknowledgements
505
MG was funded by an open CASE doctoral training grant [NE/F013876/1] from the
506
Natural Environment Research Council. The James Hutton Institute was partly
507
funded by the Rural and Environment Science and Analytical Services Division of the
508
Scottish Government. We thank Mrs Janet Woo for assistance with the isotope
509
analyses. TJD is partly funded by the HEFCE N8 Agrifood programme.
510
511
512
References
513
Baggs, E.M., Richter, M., Cadisch, G., Hartwig, U.A., 2003. Denitrification in grass
514
swards is increased under elevated atmospheric CO2. Soil Biology and Biochemistry
515
35, 729-732.
516
517
Banerjee, S., Helgason, B., Wang, L., Winsley, T., Ferrari, B.C., Siciliano, S.D., 2016.
518
Legacy effects of soil moisture on microbial community structure and N2O emissions.
519
Soil Biology and Biochemistry 95, 40-50.
520
20
Blackmer, A.M., Bremner, J.M., 1978. Inhibitory effect of nitrate on reduction of N2O522
to N2 by soil-microorganisms. Soil Biology & Biochemistry 10, 187-191.
523
524
Blagodatskaya, E., Blagodatsky, S., Anderson, T.H., Kuzyakov, Y., 2014. Microbial
525
growth and carbon use efficiency in the rhizosphere and root-free soil. PLoS One 9,
526
e93282.
527
528
Bölscher, T., Wadsö, L., Börjesson, G., Herrmann, A.M., 2016. Differences in
529
substrate use efficiency: impacts of microbial community composition, land use
530
management, and substrate complexity. Biology and Fertility of Soils 52, 547-559.
531
532
Bouwman, A.F., Beusen, A.H., Griffioen, J., Van Groenigen, J.W., Hefting, M.M.,
533
Oenema, O., Van Puijenbroek, P.J., Seitzinger, S., Slomp, C.P., Stehfest, E., 2013.
534
Global trends and uncertainties in terrestrial denitrification and N2O emissions. Philos
535
Trans R Soc Lond B Biol Sci 368, 20130112.
536
537
Brooks, P.D., Stark, J.M., McInteer, B.B., Preston, T., 1989. Diffusion method to
538
prepare soil extracts for automated nitrogen-15 analysis. Soil Science Society of
539
America Journal 53, 1707-1711.
540
541
Cederlund, H., Wessén, E., Enwall, K., Jones, C.M., Juhanson, J., Pell, M., Philippot,
542
L., Hallin, S., 2014. Soil carbon quality and nitrogen fertilization structure bacterial
543
communities with predictable responses of major bacterial phyla. Applied Soil
544
Ecology 84, 62-68.
545
546
Cooper. J.M., Burton, D., Daniell, T.J., Griffiths, B.S, Zebarth, B.J., 2011. Carbon
547
mineralization kinetics and soil biological characteristics as influenced
21
by manure addition in soil incubated at a range of temperatures. Eur J Soil Sci 47,549
392-399.
550
551
Dandie, C.E., Miller, M.N., Burton, D.L., Zebarth, B.J., Trevors, J.T., Goyer, C., 2007.
552
Nitric oxide reductase-targeted real-time PCR quantification of denitrifier populations
553
in soil. Appl Environ Microbiol 73, 4250-4258.
554
555
Daniell, T.J., Davidson, J., Alexander, C.J., Caul, S., Roberts, D.M., 2012. Improved
556
real-time PCR estimation of gene copy number in soil extracts using an artificial
557
reference. J Microbiol Methods 91, 38-44.
558
559
Dendooven, L., Splatt, P., Anderson, J.M., 1996. Denitrification in permanent pasture
560
soil as affected by different forms of C substrate. Soil Biology and Biochemistry 28,
561
141-149.
562
563
Deng, H., Zhang, B., Yin, R., Wang, H.l., Mitchell, S.M., Griffiths, B.S., Daniell, T.J.,
564
2009. Long-term effect of re-vegetation on the microbial community of a severely
565
eroded soil in sub-tropical China. Plant and Soil 328, 447-458.
566
567
Domeignoz-Horta, L., Spor, A., Bru, D., Breuil, M.C., Bizouard, F., Leonard, J.,
568
Philippot, L., 2015. The diversity of the N2O reducers matters for the N2O:N2
569
denitrification end-product ratio across an annual and a perennial cropping system.
570
Frontiers in Microbiology 6.
571
572
Eilers, K.G., Lauber, C.L., Knight, R., Fierer, N., 2010. Shifts in bacterial community
573
structure associated with inputs of low molecular weight carbon compounds to soil.
574
Soil Biology and Biochemistry 42, 896-903.
575
22
Fierer, N., Bradford, M.A., Jackson, R.B., 2007. Toward an ecological classification of577
soil bacteria. Ecology 88, 1354-1364.
578
579
Fischer, H., Eckhardt, K.U., Meyer, A., Neumann, G., Leinweber, P., Fischer, K.,
580
Kuzyakov, Y., 2010. Rhizodeposition of maize: Short-term carbon budget and
581
composition. Journal of Plant Nutrition and Soil Science 173, 67-79.
582
583
Forster, P., Ramaswamy,V., Artaxo, P., Berntsen,T., Betts, R., Fahey, D.W., et al.,
584
2007. Changes in Atmospheric Constituents and in Radiative Forcing. In: Solomon,
585
S., Qin, D., Manning, M., Chen, Z., Marquis, M., Averyt, K. B., Tignor, M., Miller, H.L.
586
(Eds.), Climate Change 2007: The Physical Science Basis. Contribution of Working
587
Group I to the Fourth Assessment Report of the Intergovernmental Panel on Climate
588
Change. Cambridge University Press, Cambridge.
589
590
Giles, M., Morley, N., Baggs, E.M., Daniell, T.J., 2012. Soil nitrate reducing
591
processes drivers, mechanisms for spatial variation, and significance for nitrous
592
oxide production. Frontiers in Microbiology 3, 1-16.
593
594
Graham, E.B., Knelman, J.E., Schindlbacher, A., Siciliano, S., Breulmann, M.,
595
Yannarell, A., Beman, J.M., Abell, G., Philippot, L., Prosser, J., Foulquier, A., Yuste,
596
J.C., Glanville, H.C., Jones, D., Angel, R., Salminen, J., Newton, R.J., Bürgmann, H.,
597
Ingram, L.J., Hamer, U., Siljanen, H.M., Peltoniemi, K., Potthast, K., Bañeras, L.,
598
Hartmann, M., Banerjee, S., Yu, R.-Q., Nogaro, G., Richter, A., Koranda, M., Castle,
599
S., Goberna, M., Song, B., Chatterjee, A., Nunes, O.C., Lopes, A.R., Cao, Y.,
600
Kaisermann, A., Hallin, S., Strickland, M.S., Garcia-Pausas, J., Barba, J., Kang, H.,
601
Isobe, K., Papaspyrou, S., Pastorelli, R., Lagomarsino, A., Lindström, E., Basiliko, N.,
602
23
community structure enhance predictions of ecosystem processes? Frontiers in604
Microbiology 7.
605
606
Hallin, S., Jones, C.M., Schloter, M., Philippot, L., 2009. Relationship between
N-607
cycling communities and ecosystem functioning in a 50-year-old fertilization
608
experiment. ISME J 3, 597-605.
609
610
Henderson, S.L., Dandie, C.E., Patten, C.L., Zebarth, B.J., Burton, D.L., Trevors,
611
J.T., Goyer, C., 2010. Changes in denitrifier abundance, denitrification gene mRNA
612
levels, nitrous oxide emissions, and denitrification in anoxic soil microcosms
613
amended with glucose and plant residues. Appl Environ Microbiol 76, 2155-2164.
614
615
Henry, S., Bru, D., Stres, B., Hallet, S., Philippot, L., 2006. Quantitative detection of
616
the nosZ gene, encoding nitrous oxide reductase, and comparison of the
617
abundances of 16S rRNA, narG, nirK, and nosZ genes in soils. Appl Environ
618
Microbiol 72, 5181-5189.
619
620
Henry, S., Texier, S., Hallet, S., Bru, D., Dambreville, C., Cheneby, D., Bizouard, F.,
621
Germon, J.C., Philippot, L., 2008. Disentangling the rhizosphere effect on nitrate
622
reducers and denitrifiers: insight into the role of root exudates. Environ Microbiol 10,
623
3082-3092.
624
625
Højberg, O., Binnerup, S.J., Sørensen, J., 1996. Potential rates of ammonium
626
oxidation, nitrite oxidation, nitrate reduction and denitrification in the young barley
627
rhizosphere. Soil Biology and Biochemistry 28, 47-54.
628
629
Kuzyakov, Y., Blagodatskaya, E., 2015. Microbial hotspots and hot moments in soil:
630
24
632
Lammel, D.R., Feigl, B., Cerri, C.C., Nüsslein, K., 2015. Specific microbial gene
633
abundances and soil parameters contribute to C, N, and greenhouse gas process
634
rates after land use change in Southern Amazonian Soils. Frontiers in Microbiology
635
6.
636
637
Mahmood, T., Ali, R., Malik, K.A., Shamsi, S.R.A., 1997. Denitrification with and
638
without maize plants (Zea mays L) under irrigated field conditions. Biology and
639
Fertility of Soils 24, 323-328.
640
641
Manzoni, S., Taylor, P., Richter, A., Porporato, A., Agren, G.I., 2012. Environmental
642
and stoichiometric controls on microbial carbon-use efficiency in soils. New Phytol
643
196, 79-91.
644
645
Marschner, P., Hatam, Z., Cavagnaro, T.R., 2015. Soil respiration, microbial biomass
646
and nutrient availability after the second amendment are influenced by legacy effects
647
of prior residue addition. Soil Biology & Biochemistry 88, 169-177.
648
649
Michotey, V., Mejean, V., Bonin, P., 2000. Comparison of methods for quantification
650
of cytochrome cd1-denitrifying bacteria in environmental marine samples. Appl
651
Environ Microbiol 66, 1564-1571.
652
653
Miller, M.N., Dandie, C.E., Zebarth, B.J., Burton, D.L., Goyer, C., Trevors, J.T., 2012.
654
Influence of carbon amendments on soil denitrifier abundance in soil microcosms.
655
Geoderma 170, 48-55.
656
25
Miller, M.N., Zebarth, B.J., Dandie, C.E., Burton, D.L., Goyer, C., Trevors, J.T., 2008.658
Crop residue influence on denitrification, N2O emissions and denitrifier community
659
abundance in soil. Soil Biology and Biochemistry 40, 2553-2562.
660
661
Morley, N.J., Richardson, D.J., Baggs, E.M., 2014. Substrate induced denitrification
662
over or under estimates shifts in soil N2/N2O ratios. PLoS One 9, e108144.
663
664
Murray, P.J., Hatch, D.J., Dixon, E.R., Stevens, R.J., Laughlin, R.J., Jarvis, S.C.,
665
2004. Denitrification potential in a grassland subsoil: effect of carbon substrates. Soil
666
Biology & Biochemistry 36, 545-547.
667
668
Muyzer, G., Dewaal, E.C., Uitterlinden, A.G., 1993. Profiling of complex
669
microbialpopulations by denaturing gradient gel electrophoresis analysis of
670
polymerase chain reaction-amplified genes coding for 16S rRNA. Appl Environ
671
Microbiol 59, 695-700.
672
673
Nguyen, C., 2003. Rhizodeposition of organic C by plants: mechanisms and controls.
674
Agronomie 23, 375-396.
675
676
Oburger, E., Kirk, G.J.D., Wenzel, W.W., Puschenreiter, M., Jones, D.L., 2009.
677
Interactive effects of organic acids in the rhizosphere. Soil Biology & Biochemistry 41,
678
449-457.
679
680
Paterson, E., Osler, G., Dawson, L.A., Gebbing, T., Sim, A., Ord, B., 2008. Labile
681
and recalcitrant plant fractions are utilised by distinct microbial communities in soil:
682
Independent of the presence of roots and mycorrhizal fungi. Soil Biology &
683
Biochemistry 40, 1103-1113.
684
26
Petersen, D.G., Blazewicz, S.J., Firestone, M., Herman, D.J., Turetsky, M., Waldrop,686
M., 2012. Abundance of microbial genes associated with nitrogen cycling as indices
687
of biogeochemical process rates across a vegetation gradient in Alaska. Environ
688
Microbiol 14, 993-1008.
689
690
Sinsabaugh, R.L., Manzoni, S., Moorhead, D.L., Richter, A., 2013. Carbon use
691
efficiency of microbial communities: stoichiometry, methodology and modelling. Ecol
692
Lett 16, 930-939.
693
694
Smith, P., Martino, D., Cai, Z., Gwary, D., Janzen, H., Kumar, P., et al., 2007
695
“Agriculture,”. In: Metz, B., Davidson, O.R., Bosch, P.R., Dave, R., MeyerL.A. (Eds),
696
Climate Change 2007: Mitigation. Contribution of Working Group III to the Fourth
697
Assessment Report of the Intergovernmental Panel on Climate Change. Cambridge
698
University Press, Cambridge UK.
699
700
Throback, I.N., Enwall, K., Jarvis, A., Hallin, S., 2004. Reassessing PCR primers
701
targeting nirS, nirK and nosZ genes for community surveys of denitrifying bacteria
702
with DGGE. FEMS Microbiol Ecol 49, 401-417.
703
704
van Hees, P.A.W., Jones, D.L., Godbold, D.L., 2002. Biodegradation of low
705
molecular weight organic acids in coniferous forest podzolic soils. Soil Biology &
706
Biochemistry 34, 1261-1272.
707
708
Wallenstein, M.D., Myrold, D.D., Firestone, M., Voytek, M., 2006. Environmental
709
controls on denitrifying communities and denitrification rates: Insights from molecular
710
methods. Ecological Applications 16, 2143-2152.
711
27
Weier, K.L., Doran, J.W., Power, J.F., Walters, D.T., 1993. Denitrification and the713
dinitrogen nitrous-oxide ratio as affected by soil-water, available carbon, and nitrate.
714
Soil Science Society of America Journal 57, 66-72.
715
716
zu Schweinsberg-Mickan, M.S., Joergensen, R.G., Muller, T., 2010. Fate of 13C- and
717
15
N-labelled rhizodeposition of Lolium perenne as function of the distance to the root
718
surface. Soil Biology & Biochemistry 42, 910-918.
719
720
Zumft, W.G., 1997. Cell biology and molecular basis of denitrification. Microbiology
721
28
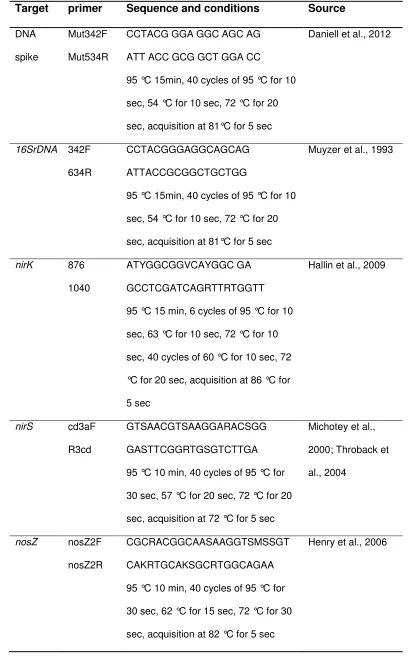
Table 1 – Gene amplified, sequence and source of primers used in RT-PCR723
724
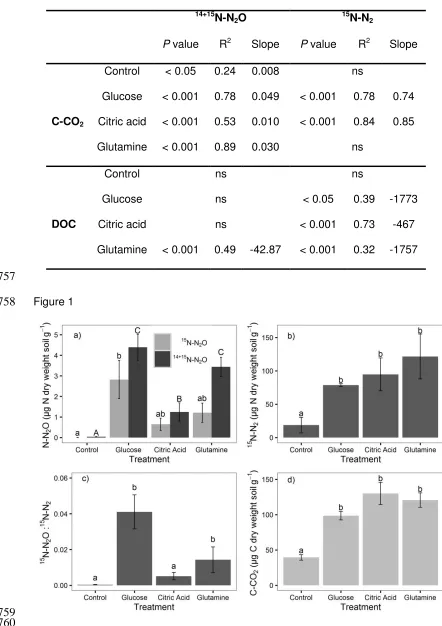
Table 2 – Results of regression analysis (P value, R2 and slope) for 14+15N-N2O and
725
15
N-N2 emissions against C-CO2 emissions and DOC concentrations in soil treated
726
with 250 mg C kg-1 dry weight soil in the form of either glucose, citric acid and
727
glutamine treatments and the control soil.
728
29
730
Figure 1 - a) Total 14+15N-N2O and 15N-N2O emissions produced by 144 hours, b)
731
total 15N-N2 emissions produced by 144 hours, c) 15N-N2O-to- 15N-N2 at 144 hours
732
and d) total C-CO2 emissions produced by 144 hours in soil treated with 250 mg C
733
kg-1 dry weight soil in the form of either glucose, citric acid and glutamine and the
734
control soil. Data shown are mean ± one SE. Columns with different letters denote
735
significant differences (P < 0.05) between treatments.
736
737
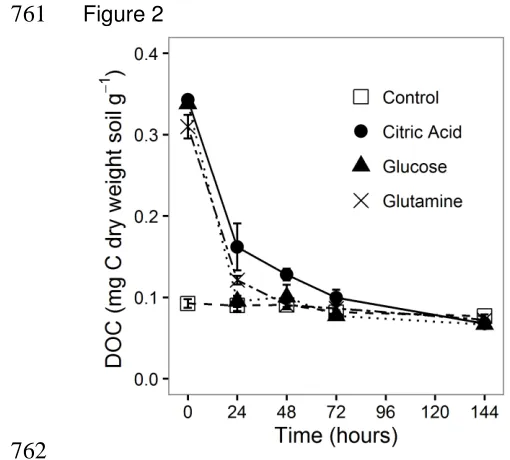
Figure 2 - Dissolved organic C (DOC) concentrations over 144 hours in soil treated
738
with 250 mg C kg-1 dry weight soil of either glucose, citric acid or glutamine and in
739
control soil treatments.Data shown are mean ± one SE.
740
741
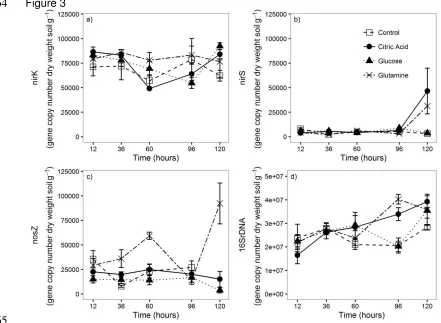
Figure 3 - Gene copy numbers of a) nirK b) nirS c) nosZ and d) 16SrDNA in soil
742
treated with 250 mg C kg-1 dry weight soil of either glucose, citric acid or glutamine
743
and in control soil treatments. Data shown are mean ± one SE.
744
745
Figure 4 - Principal component scores for control, glucose, citric acid and glutamine
746
treatments at 12, 36, 60 and 96 hours after carbon addition. Means for each
747
treatment and time combination are displayed and the overall least significant
748
difference for each dimension represented by a cross. PCA was performed on
749
16SrDNAT-RFLP fragments. Shade denotes the sampling time, while the shape
750
denotes the treatment.
751
30
Table 1.754
Target primer Sequence and conditions Source
DNA
spike
Mut342F
Mut534R
CCTACG GGA GGC AGC AG
ATT ACC GCG GCT GGA CC
95 °C 15min, 40 cycles of 95 °C for 10
sec, 54 °C for 10 sec, 72 °C for 20
sec, acquisition at 81°C for 5 sec
Daniell et al., 2012
16SrDNA 342F
634R
CCTACGGGAGGCAGCAG
ATTACCGCGGCTGCTGG
95 °C 15min, 40 cycles of 95 °C for 10
sec, 54 °C for 10 sec, 72 °C for 20
sec, acquisition at 81°C for 5 sec
Muyzer et al., 1993
nirK 876
1040
ATYGGCGGVCAYGGC GA
GCCTCGATCAGRTTRTGGTT
95 °C 15 min, 6 cycles of 95 °C for 10
sec, 63 °C for 10 sec, 72 °C for 10
sec, 40 cycles of 60 °C for 10 sec, 72
°C for 20 sec, acquisition at 86 °C for
5 sec
Hallin et al., 2009
nirS cd3aF
R3cd
GTSAACGTSAAGGARACSGG
GASTTCGGRTGSGTCTTGA
95 °C 10 min, 40 cycles of 95 °C for
30 sec, 57 °C for 20 sec, 72 °C for 20
sec, acquisition at 72 °C for 5 sec
Michotey et al.,
2000; Throback et
al., 2004
nosZ nosZ2F
nosZ2R
CGCRACGGCAASAAGGTSMSSGT
CAKRTGCAKSGCRTGGCAGAA
95 °C 10 min, 40 cycles of 95 °C for
30 sec, 62 °C for 15 sec, 72 °C for 30
sec, acquisition at 82 °C for 5 sec
Henry et al., 2006
31
Table 2.756
14+15
N-N2O 15N-N2
P value R2 Slope P value R2 Slope
C-CO2
Control < 0.05 0.24 0.008 ns
Glucose < 0.001 0.78 0.049 < 0.001 0.78 0.74
Citric acid < 0.001 0.53 0.010 < 0.001 0.84 0.85
Glutamine < 0.001 0.89 0.030 ns
DOC
Control ns ns
Glucose ns < 0.05 0.39 -1773
Citric acid ns < 0.001 0.73 -467
Glutamine < 0.001 0.49 -42.87 < 0.001 0.32 -1757
757
Figure 1