Replication and validation of higher order models demonstrated
that a summary score for the EORTC QLQ-C30 is robust
Johannes M. Giesinger
a,1, Jacobien M. Kieffer
a,1, Peter M. Fayers
b,c, Mogens Groenvold
d,e,
Morten Aa. Petersen
d, Neil W. Scott
b, Mirjam A.G. Sprangers
f, Galina Velikova
g,
Neil K. Aaronson
a,*
, on behalf of the EORTC Quality of Life Group
aDivision of Psychosocial Research and Epidemiology, The Netherlands Cancer Institute, Plesmanlaan 121, 1066 CX Amsterdam, The Netherlands
b
Institute of Applied Health Sciences, University of Aberdeen, Foresterhill Road, AB25 2ZD Aberdeen, UK
cDepartment of Cancer Research and Molecular Medicine, Faculty of Medicine, Norwegian University of Science and Technology, Postboke 8905, N-7491
Trondheim, Norway
dThe Research Unit, Department of Palliative Medicine, Bispebjerg Hospital, Bispebjerg Bakke 23, 2400 Copenhagen, Denmark eDepartment of Public Health, University of Copenhagen, Øster Farimagsgade 5, 1014 Copenhagen, Denmark
fDepartment of Medical Psychology, Academic Medical Centre, University of Amsterdam, Meibergdreef 9, 1105 AZ Amsterdam, The Netherlands gLeeds Institute of Cancer and Pathology, St James’s Institute of Oncology, University of Leeds, Beckett Street, LS9 7TF Leeds, UK
Accepted 21 August 2015; Published online 28 September 2015
Abstract
Objective: To further evaluate the higher order measurement structure of the European Organisation for Research and Treatment of Cancer (EORTC) Quality of Life Questionnaire Core 30 (QLQ-C30), with the aim of generating a summary score.
Study Design and Setting: Using pretreatment QLQ-C30 data (N53,282), we conducted confirmatory factor analyses to test seven previously evaluated higher order models. We compared the summary score(s) derived from the best performing higher order model with the original QLQ-C30 scale scores, using tumor stage, performance status, and change over time (N5244) as grouping variables.
Results: Although all models showed acceptable fit, we continued in the interest of parsimony with known-groups validity and respon-siveness analyses using a summary score derived from the single higher order factor model. The validity and responrespon-siveness of this QLQ-C30 summary score was equal to, and in many cases superior to the original, underlying QLQ-QLQ-C30 scale scores.
Conclusion: Our results provide empirical support for a measurement model for the QLQ-C30 yielding a single summary score. The availability of this summary score can avoid problems with potential type I errors that arise because of multiple testing when making comparisons based on the 15 outcomes generated by this questionnaire and may reduce sample size requirements for health-related quality of life studies using the QLQ-C30 questionnaire when an overall summary score is a relevant primary outcome. Ó 2016 The Authors. Published by Elsevier Inc. This is an open access article under the CC BY-NC-ND license (http://creativecommons. org/licenses/by-nc-nd/4.0/).
Keywords:Health-related quality of life; Questionnaires; EORTC QLQ-C30; Measurement model; Higher order factor scores; Confirmatory factor analysis
1. Introduction
Patient-reported outcome measures (PROMs) are currently seen as important outcomes in both observational studies and clinical trials. They represent the patients’ voice in determining the burden of disease and its treatment. One
of the most widely used PROMs in oncology is the Euro-pean Organisation for Research and Treatment of Cancer (EORTC) Quality of Life Questionnaire Core 30 (QLQ-C30) [1]. The QLQ-C30 is a multidimensional health-related quality of life (HRQOL) questionnaire composed of six functional scales, three symptom scales, and a num-ber of additional single item scales (15 outcomes, in total). Although the QLQ-C30 provides a wealth of informa-tion about the HRQOL of patients, it also presents an ana-lytic challenge because of the multiple outcomes it generates, and the concomitant risk of committing a type I error due to multiple testing [1,2]. In some studies, it is Funding: The work of J.M.G. was supported by a grant from the
Austrian Science Fund (FWF J3353).
1
Shared first authorship.
* Corresponding author. Plesmanlaan 121, 1066 CX Amsterdam, The Netherlands. Tel.:þ31-20-5122481; fax:þ31-20-5122322.
E-mail address:[email protected](N.K. Aaronson).
http://dx.doi.org/10.1016/j.jclinepi.2015.08.007
0895-4356/Ó2016 The Authors. Published by Elsevier Inc. This is an open access article under the CC BY-NC-ND license (http://creativecommons.org/ licenses/by-nc-nd/4.0/).
What is new?
Key findings
We found a robust single higher order factor model to be the best performing measurement model for the European Organisation for Research and Treat-ment of Cancer (EORTC) Quality of Life Ques-tionnaire Core 30 (QLQ-C30).
The resulting QLQ-C30 summary score exhibits equal or superior known-groups validity and responsiveness to change over time as compared to the individual QLQ-C30 scales.
What this adds to what was known?
The results support the robustness of a single-factor higher order measurement model for the QLQ-C30.
The validity and responsiveness of the QLQ-C30 summary score is equal to, and in many cases su-perior to the original, underlying QLQ-C30 scale scores.
What is the implication and what should change now?
The EORTC Quality of Life Group recommends using the QLQ-C30 summary score to supplement the 15-outcome profile generated by the QLQ-C30.
The availability of a summary score can facilitate more reliable hypothesis testing analyzing QLQ-C30 data.
If the QLQ-C30 summary score is chosen as the primary focus of a study, then its use can reduce the risk of type I errors that can occur when mak-ing comparisons based on the original 15 outcomes generated by the QLQ-C30. Thus, it may be possible to reduce sample size requirements for health-related quality of life studies using the QLQ-C30 questionnaire.
possible to reduce the number of statistical tests performed by defining a limited set of QLQ-C30 scales that are of primary interest. Preferably this is done on an a priori basis to avoid selective, post-hoc reporting of results[3,4]. How-ever, in many studies, it may be difficult to prespecify which QLQ-C30 scales are of most interest. In such cases, investigators frequently rely on the two-item scale assess-ing overall quality of life[5e8].
The disadvantage of this very brief two-item overall quality of life scale is that it may have less measurement precision than is desired for detecting group differences over time. In addition, it may not be a conceptually
appropriate summary of the QLQ-C30, which contains a relatively large number of symptom scales and items[9,10]. On the basis of such considerations, Hinz et al. and Nordin et al. introduced and investigated summary scores for the QLQ-C30. Hinz et al.[11]used a total score derived from summing up all 30 items of the questionnaire and two separate summary scores based on the sum of all items of the functioning domains and of the symptom domains, respectively. Nordin et al. [12] investigated the known-groups validity of the two-item global quality of life scale and three alternative scoring algorithms for the QLQ-C30 based on (1) the 15 QLQ-C30 scale means; (2) the sum of all individual QLQ-C30 items (except for the item on financial problems); and (3) the sum of the scales assessing physical function, emotional function, quality of life, fa-tigue, nausea/vomiting, pain, appetite, and diarrhea. For all proposed summary measures, change was categorized in one way or the other into improved, unchanged, and worse. The three alternative scoring approaches performed considerably better than the original, two-item quality of life scale. Although this study documented that the QLQ-C30 global quality of life scale may not be particularly well suited for detecting changes between patient groups and/or changes over time, the alternative summary scoring algo-rithms proposed were generated in an ad hoc manner, without rigorous empirical testing of hypothesized mea-surement models.
Cognizant of the need to have a solid empirical basis for any proposed higher summary score for the QLQ-C30, Gundy et al.[10]used structural equation modeling to test seven alternative higher order measurement models for the QLQ-C30. All models exhibited a moderate-to-good model-data fit. The model that showed the best statistical fit (slightly better that the other models) was a two-factor model of physical and mental health. This is conceptually similar to the SF-36 Health Survey component scores, and the factor structure of the PROMIS domain mapping project [10,13e16] Although appealing conceptually,
Gundy et al. questioned if this advantage outweighs the model’s relatively complex nature, and if perhaps a more parsimonious and simpler model would be more suitable.
The aims of the present study were to (1) identify the best performing higher order model among those suggested by Gundy et al.[10]; (2) test the validity and responsiveness of the best performing higher order factor score(s) as compared to that of the underlying individual scales of the QLQ-C30; and (3) develop an additional scoring algo-rithm for summary score(s) for the QLQ-C30 on the basis of a higher order measurement model.
2. Methods
2.1. Data source
The QLQ-C30 data used for these analyses were collected originally for the EORTC Quality of Life
Cultural Meta-Analysis Group (see Appendix at www. jclinepi.com) and have been described in detail elsewhere [10,17,18]. Briefly, the pooled database was formed from 124 individual data sets from 48 countries. In addition to the QLQ-C30, the data set also incorporated patient and clinical characteristics, including age, sex, country, lan-guage of administration, primary disease site, and stage of disease. The database consisted of 38,000 respondents, of whom more than 30,000 completed baseline (pretreat-ment) questionnaires. Of these 30,000 respondents, 9,044 completed the most recent version (3.0) of the QLQ-C30 [10]. For their study, Gundy et al. [10] selected a 50% random sample of the 9,044 respondents who completed the QLQ-C30, version 3.0. In the present study, we used the remaining 50% of that sample but restricted ourselves to those patients for whom tumor stage was known (N53,282). For the longitudinal analysis, we included pa-tients for whom both pretreatment and on-treatment QLQ-C30 data and information on the type of treatment received were available (N5811).
2.2. The EORTC QLQ-C30
The 30-item EORTC QLQ-C30 version 3.0 [1,2] con-sists of five multi-item function scales (physical [PF], role [RF], cognitive [CF], emotional [EF], and social [SF]), three multi-item symptom scales (fatigue [FA], nausea and vomiting [NV], and pain [PA]), six single-item symp-tom scales (dyspnea [DY], insomnia [SL], appetite loss [AP], constipation [CO], diarrhea [DI], and financial impact [FI]), and a two-item global quality of life scale (QL).
The questionnaire has a 1-week time frame and uses a four-point response format (‘‘not at all,’’ ‘‘a little,’’ ‘‘quite a bit,’’ and ‘‘very much’’), with the exception of the global QL scale, which has a seven-point response format. For the functioning and the QL scales, a higher score indicates bet-ter health. For the symptoms scales, a higher score indicates a higher level of symptom burden.
2.3. Models tested
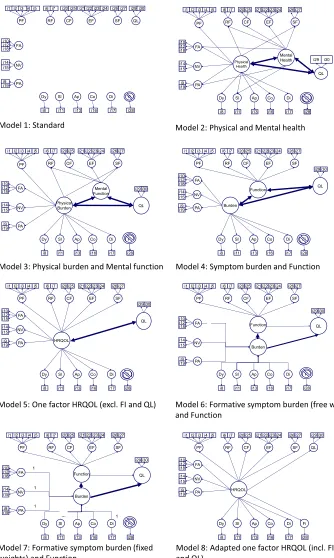
In the current analysis, we tested the seven HRQOL higher order measurement models evaluated by Gundy et al. [10]. For a graphical representation of the models, seeFig. 1.
(1) The Standard 14 dimensional QLQ-C30 model, the original measurement model of the QLQ-C30, which formed the basis for all of the other models described here.
(2) The two-factor, Physical health and Mental health
model, in which the original QLQ-C30 scales RF, SF, FA, PA, and SL load on both the mental as well as the physical higher order factor. The remaining scales load only on the physical higher order factor (PF, NV, DY, AP, CO, and DI scale) or on the mental higher-order factor (EF and CF scale).
(3) ThePhysical burden and Mental function model, in which PF, FA, NV, PA, DY, SL, AP, CO, and DI load on the Physical burdenfactor. The functional scales EF and CF load on the Mental function factor, and RF and SF load on both factors.
(4) The Symptom burden and Function model [19], in which PF, SF, RF, CF, and EF load on Function, and FA, NV, PA, DY, SL, AP, CO, and DI load on
Burden.
(5) The one-factor HRQOL model[20], in which all orig-inal QLQ-C30 scales (with the exception of the QL scale) load on HRQOL.
(6) & (7) The FormativeSymptom burden and Function
model[21,22], in which FA, NV, PA, DY, SL, AP, CO, and DI function are seen as formative indicators of
Burden,and PF, SF, RF, CF, and EF function as reflec-tive indicators ofFunction.In model 6, the weights of the formative scales are estimated freely, and in model 7, they are fixed to 1.0.
In all the previously mentioned models, FI is omitted, and the QL scale is correlated with, but not subsumed by any higher order factor. This is in line with the approach followed by Gundy et al.[10]. However, for completeness, we also show inFig. 1 an 8th modelda one-factor model using all 30 items of the QLQ-C30.
2.4. Statistical analyses
Descriptive statistics were used to characterize the sample in terms of sociodemographic and clinical vari-ables. For replication purposes, the modeling procedures were identical to those used in the study of Gundy et al. [10]. In short, we used pretreatment QLQ-C30 data and carried out higher order confirmatory factor analyses (CFAs) in Mplus, version 6.12[23]. We modeled the orig-inal QLQ-C30 subscales as first-order factors. The QL scale was also modeled as a first-order factor and was al-lowed to correlate with all other higher order factors but remained distinct from them. To be able to identify the models, we fixed one of the item loadings to a value of 1.0. Both loadings of items corresponding to the QL latent variable were also fixed. As in the study of Gundy et al. [10], we fixed the residual variances for the single-item first-order factors to be equal, at 20% of the total variance for these factors, on the basis of testeretest correlations reported elsewhere [24].
We used pair-wise deletion, and a weighted least squares estimator with adjustment for means and variance, which takes into account deviations from normality [25,26]. To test goodness of fit, we used the Comparative Fit Index and the Tucker-Lewis Index. For both, values0.95 indi-cate a good fit, and values O0.90 an acceptable fit [27]. We also used the Root Mean Square Error of Approxima-tion as an indicator of model fit, with values !0.05 indi-cating a good fit, and between 0.05 and 0.08 an
acceptable fit[28]. These fit indices are sensitive to model complexity, paradoxically generating better fit indices for less complex models. Therefore, selected models were required to have at least an acceptable fit according to the
[image:4.594.117.451.60.618.2]threshold values. Furthermore, all standardized factor load-ings were required to be greater than 0.4 and statistically significant [29]. Given that the data set included different sources of data, we adjusted for the possible variability in Fig. 1. Higher order models for the EORTC QLQ-C30 (models 1e7 was taken from Gundy et al., model 8 was created ad hoc). AP, appetite loss; CF, cognitive function; CO, constipation; DI, diarrhea; DY, dyspnea; EF, emotional function; EORTC QLQ-C30, European Organisation for Research and Treatment of Cancer, Quality of Life Questionnaire Core 30; FA, fatigue; FI, financial impact; HRQOL, health-related quality of life; NV, nausea and vomiting; PA, pain; PF, physical function; QL, global quality of life; RF, role function; SF, social function; SL, insomnia.
populations and procedures by taking cluster sampling into account[10].
We used analysis of variance (ANOVA) to examine known-groups validity, that is, the ability of the factor score(s) derived from the best fitting higher order model, and of the original QLQ-C30 scale scores to distinguish be-tween groups known to be clinically different. We used tu-mor stage (local vs. advanced) and performance status (Karnofsky score 0-80 vs. 90-100) as grouping variables. We evaluated responsiveness by comparing pretreatment versus on-treatment QLQ-C30 scores. We calculated effect sizes (ESs) using Cohen’s d statistic (mean difference divided by the pooled standard deviation). These provide a distribution-based estimate of the magnitude of mean dif-ferences, where an ES of 0.2 is considered small, 0.5 mod-erate, and 0.8 large[30].
We also generated relative validity (RV) estimates by comparing the performance of higher order factor score(s) with the original QLQ-C30 scale scores. The RV is the ratio of the F-statistics derived from analysis of variance comparing groups or time points. The RV indicates the rela-tive difference in sample size needed to detect a statistically significant difference in mean scores using the two measures. More specifically, if the statistic ratio, in which the F-statistic of the comparative scale is the numerator and the F-statistic of a reference scale is the denominator (Fcomp :-Fref), is greater than 1, then the comparative measure is judged as performing better than the reference measure. In the context of RV, ‘‘better performance’’ means that a small-er sample size is required to detect a mean diffsmall-erence[31,32].
3. Results
3.1. Patient characteristics
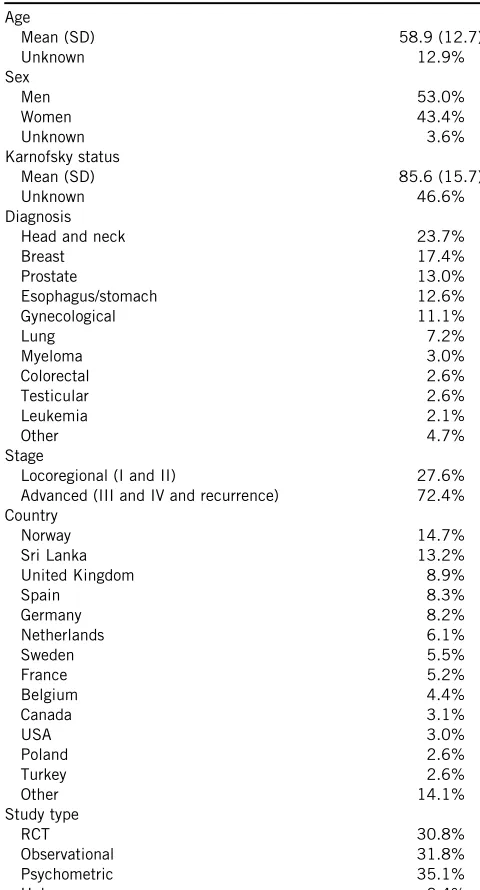
Pretreatment data were available from 3,282 patients (53.0% men; mean age 58.9 years). The most frequent di-agnoses were head-and-neck cancer (23.7%), breast cancer (17.4%), and prostate cancer (13.0%). Most patients (72.4%) had an advanced tumor stage (UICC stage III or IV). Pretreatment Karnofsky performance status data were available for 53.5% of the sample (mean 5 85.6; SD 15.7). For further details, seeTable 1.
Both pretreatment and on-treatment QLQ-C30 data and information on the type of treatment were available for 811 patients (73.2% men; mean age 61.3 years). Of these pa-tients, 35.1% were treated with chemotherapy, 30.0% with radiotherapy, 28.6% had surgery, and 6.3% had another type of treatment. Most common diagnoses were head-and-neck cancer (31.6%), prostate cancer (34.6%), and ovarian cancer (11.0%).
3.2. Modeling
Table 2 presents the fit indices for the seven models tested. All models showed an acceptable fit, with the
[image:5.594.309.549.84.529.2]standard model showing a good fit. With the exception of the standard model, models 2 and 3 showed the best fit. However, examination of the parameter estimates in model 2 indicated that the standardized factor loadings for the SL scale on physical health, and for the RF, FA, and PA scale on mental health, were below the 0.4 threshold (0.02, 0.16, 0.15, and 0.16, respectively). For model 3, the standardized factor loading of RF was below 0.4 (0.255). These low factor loadings indicate that these first-order factors might have to be excluded from the model. In models 4 and 5, all factor loadings were statistically significant and of moderate to strong magnitude, providing support for the models. All Table 1. Patient characteristics at baseline (before treatment; n53,282)
Age
Mean (SD) 58.9 (12.7) Unknown 12.9% Sex
Men 53.0%
Women 43.4% Unknown 3.6% Karnofsky status
Mean (SD) 85.6 (15.7) Unknown 46.6% Diagnosis
Head and neck 23.7% Breast 17.4% Prostate 13.0% Esophagus/stomach 12.6% Gynecological 11.1%
Lung 7.2%
Myeloma 3.0% Colorectal 2.6% Testicular 2.6% Leukemia 2.1% Other 4.7% Stage
Locoregional (I and II) 27.6% Advanced (III and IV and recurrence) 72.4% Country
Norway 14.7% Sri Lanka 13.2% United Kingdom 8.9% Spain 8.3% Germany 8.2% Netherlands 6.1% Sweden 5.5% France 5.2% Belgium 4.4% Canada 3.1%
USA 3.0%
Poland 2.6% Turkey 2.6% Other 14.1% Study type
RCT 30.8%
Observational 31.8% Psychometric 35.1% Unknown 2.4%
Abbreviations: SD, standard deviation; RCT, randomized-controlled trial.
standardized factor loadings for the function factor of model 6 were greater than 0.4 and statistically significant. However, for the formative symptom burden factor, only FA had a standardized regression weight greater than 0.4. When fixing the weights for the formative scales on the burden factor (model 7), all standardized regression weights were far below the 0.4 threshold. In addition, in both models, we found large correlations between the higher order factors (Table 2), and in model 7, we found a negative residual variance for item 19 (‘‘Did pain inter-fere with your daily activities?’’; 0.009), which could indicate identification problems suggesting the inappropri-ateness of the model.
As in Gundy’s study, the modification indices (that esti-mate the decrease in model chi square when freeing a fixed parameter [33]) showed that item 22 (‘‘Did you worry?’’) caused problems when fitting the models. We also observed that the EF scale was associated with other scales not captured by the fitted models.
When taking both fit indices and magnitude of factor loadings into account, models 4 and 5 were the most prom-ising. In the interest of parsimony and for conceptual rea-sons (ie, function scales such as EF and CF include items assessing symptoms), we decided to continue the analysis with the less complex, single higher-order factor model 5 (Fig. 1andTable 3).
Having selected the single-factor HRQOL model, we investigated further if the model fit would be acceptable if we were to include all 15 scales of the QLQ-C30 in the model, including the global QL scale and the FI scale that were excluded a priori by Gundy et al. (model 8 in Fig. 1). Although this model showed an acceptable fit (Table 2) and statistically significant standardized factor loadings greater than 0.4, the results confirmed identifica-tion problems (ie, a negative residual variance for one of the items (‘‘Have you felt nauseated ?’’; 0.010), indi-cating that the model does not work well.)
On the basis of these results, we generated a QLQ-C30 summary score, calculated as the mean of the combined 13 QLQ-C30 scale scores included in model 5 (excluding FI and QL). For this purpose, all included scale scores were
reversed so that higher scores represent better outcomes (ie, better functioning or fewer symptoms).
3.3. Known-group comparisons and responsiveness
We investigated the ability of the QLQ-C30 summary score to distinguish between groups formed on the basis of tumor stage (stage IeII vs. IIIeIV) and Karnofsky per-formance status (0e80 vs. 90e100), as compared to the original 15 scale scores of the QLQ-C30. To calculate RV, we used the QLQ-C30 summary score as the reference value (ie, the denominator of this ratio).
[image:6.594.52.543.75.193.2]Using tumor stage (Table 4) as the grouping variable, the QLQ-C30 summary score showed the highest ES (0.65) and RV, together with the fatigue scale (ES 5 0.64, Table 2.Approximate goodness-of-fit indices for the higher order measurement models of the EORTC QLQ-C30
Model CFI TLI RMSEA Remarks
1. Standard 0.969 0.979 0.047
2. Physical/mental health and QL 0.943 0.971 0.056 Correlation between physical health and mental health50.786 3. Physical burden/mental function and QL 0.944 0.970 0.057 Correlation between physical burden and mental function50.424 4. Symptom burden, function and QL 0.932 0.966 0.061 Correlation between burden and function50.564
5. HRQOL and QL 0.931 0.965 0.061 6. Formative symptom burden (free weights),
function, and QL
0.938 0.966 0.061 Correlation between formative burden and function50.953
7. Formative symptom burden (fixed weights), function, and QL
0.934 0.964 0.062 Correlation between formative burden and function50.938
8. HRQOL including QL and FI 0.919 0.966 0.055
Abbreviations: CFI, Comparative Fit Index; EORTC QLQ-C30, European Organisation for Research and Treatment of Cancer Quality of Life Ques-tionnaire Core 30; FI, financial impact; HRQOL, health-related quality of life; RMSEA, root mean square error of approximation; TLI, Tucker-Lewis Index; QL, global quality of life.
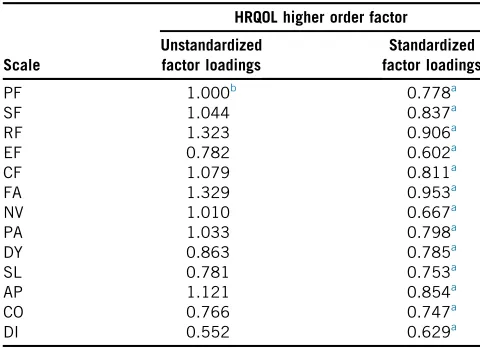
Table 3. (Un)standardized factor loadings for first-order factors (EORTC QLQ-C30 scales) on the HRQOL higher order factor
Scale
HRQOL higher order factor
Unstandardized factor loadings
Standardized factor loadings
PF 1.000b 0.778a SF 1.044 0.837a RF 1.323 0.906a EF 0.782 0.602a CF 1.079 0.811a FA 1.329 0.953a NV 1.010 0.667a PA 1.033 0.798a DY 0.863 0.785a SL 0.781 0.753a AP 1.121 0.854a CO 0.766 0.747a DI 0.552 0.629a
Abbreviations: AP, appetite loss; CF, cognitive function; CFA, confirmatory factor analysis; CO, constipation; DI, diarrhea; DY, dys-pnea; EF, emotional function; EORTC QLQ-C30, European Organisa-tion for Research and Treatment of Cancer Quality of Life Questionnaire Core 30; FA, fatigue; HRQOL, health-related quality of life; NV, nausea and vomiting; PA, pain; PF, physical function; QL, global quality of life; RF, role function; SF, social function; SL, insomnia.
a
P!0.01.
b Unstandardized factor loadings were fixed to 1.0 for model
identification.
[image:6.594.306.546.448.622.2]RV5 0.97). The two-item global QL scale showed a sub-stantially lower ES of 0.47 and an RV of 0.51 when compared to the QLQ-C30 summary score. Mean differ-ences between patients with stage IeII and stage IIIeIV were statistically significant for all scales (all P
values!0.001).
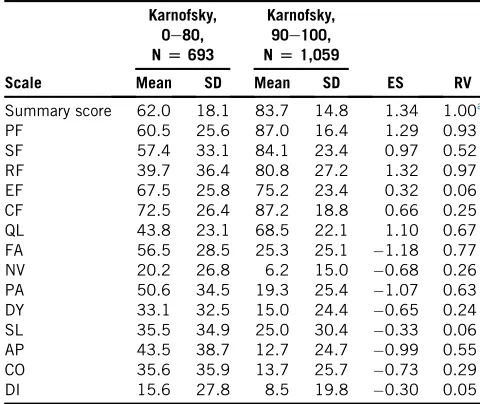
A similar pattern of results was found using performance status as the grouping variable (Table 5). In this compari-son, the QLQ-C30 summary score had the highest ES (1.34), with the Role Functioning scale (ES 5 1.32, RV 5 0.97) and the Physical Functioning scale (ES51.29, RV50.93) performing nearly as well. Again, the global QL scale was less discriminating, with an ES of 1.10 and an RV of 0.67. Mean differences between patients with a low and high performance status (0e80 vs. 90e100) were again statistically significant for all scales (all P
values!0.001).
In the longitudinal responsiveness analysis, only small changes in HRQOL were observed in the 811 patients with known-treatment type and pretreatment and on-treatment QLQ-C30 data. With the exception of nausea/vomiting (ES 5 0.34), all mean changes had ES’s less than 0.30 (with the lowest change found for global QL:
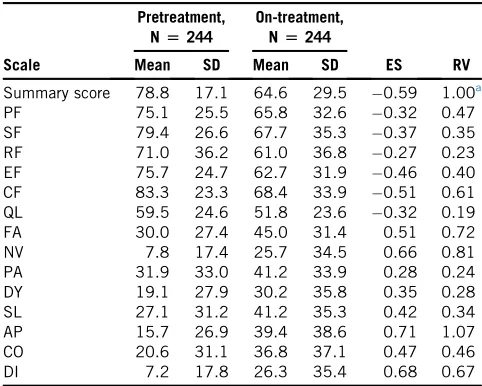
ES 5 0.01). On the basis of these findings, we conducted further responsiveness analyses for the radiotherapy group only (n 5 244), as this group exhibited the most pro-nounced score changes between the pretreatment and on-treatment assessment (Table 6) and thus was considered the most suitable subsample for this type of analysis. In this radiotherapy group, the mean age was 65.6 years and 74.6% were female. Most common diagnoses were head-and-neck cancer (33.3%), prostate cancer (37.9%), and breast cancer (14.8%).
The comparison of patients before and during radio-therapy showed the highest ES’s for individual symptom scale scores (appetite loss ES 5 0.71; diarrhea ES 5 0.68; nausea/vomiting, ES 5 0.66). The QLQ-C30 summary score had a somewhat lower ES (0.59) and RV (1.00) compared to that of appetite loss RV (1.07), but higher RV than that of nausea/vomiting (RV 5 0.81) and diarrhea (RV 5 0.67). The global QL scale exhibited substantially poorer responsiveness (ES 5 0.32, RV50.19). Changes in mean scores between the two time points were statistically significant for all scales (all P
[image:7.594.309.549.95.297.2]values!0.001). Table 4.Effect sizes and relative validities for the scales and summary
score of the EORTC QLQ-C30 using the known-group comparison for tumor stage
Scale
Stage IeII,
N[907
Stage IIIeIV,
N[2,375
ES RV Mean SD Mean SD
Summary score 84.2 14.3 73.0 18.3 0.65 1.00a PF 84.4 18.7 73.6 24.1 0.47 0.53 SF 86.6 21.0 69.4 30.7 0.61 0.87 RF 81.5 26.4 61.3 35.5 0.61 0.88 EF 76.0 23.1 69.6 24.3 0.27 0.17 CF 86.2 19.0 80.6 22.4 0.26 0.16 QL 66.7 23.1 55.4 24.6 0.47 0.51 FA 23.5 23.5 40.9 28.7 0.64 0.97 NV 5.4 14.2 12.4 21.4 0.36 0.30 PA 18.0 23.2 35.4 31.9 0.58 0.81 DY 14.6 24.8 22.8 29.4 0.29 0.20 SL 24.2 29.8 31.6 32.7 0.23 0.13 AP 13.5 25.0 28.7 34.8 0.47 0.53 CO 13.5 23.3 23.7 32.0 0.34 0.27 DI 7.5 18.4 10.6 22.6 0.14 0.05 Abbreviations: AP, appetite loss; CF, cognitive function; CO, con-stipation; DI, diarrhea; DY, dyspnea; EF, emotional function; EORTC QLQ-C30, European Organisation for Research and Treatment of Can-cer Quality of Life Questionnaire Core 30; ES, effect size; FA, fatigue; NV, nausea and vomiting; PA, pain; PF, physical function; QL, global quality of life; RF, role function; RV, Relative validity: performance of the measures indicated as the ratio of the sample sizes required to detect a mean difference with the measures being compared (ie, scores less than 1.0 indicate better performance for the QLQ-C30 summary score); SD, standard deviation; SF, social function; SL, insomnia.
a
Reference score for calculating relative validity (ie, the ratio of the F-statistics of the comparative score [numerator] and the refer-ence score [denominator]).
Table 5.Effect sizes and relative validities for the scales and summary score of the EORTC QLQ-C30 using the known-group comparison for performance status
Scale
Karnofsky, 0e80,
N[693
Karnofsky, 90e100,
N[1,059
ES RV Mean SD Mean SD
Summary score 62.0 18.1 83.7 14.8 1.34 1.00a PF 60.5 25.6 87.0 16.4 1.29 0.93 SF 57.4 33.1 84.1 23.4 0.97 0.52 RF 39.7 36.4 80.8 27.2 1.32 0.97 EF 67.5 25.8 75.2 23.4 0.32 0.06 CF 72.5 26.4 87.2 18.8 0.66 0.25 QL 43.8 23.1 68.5 22.1 1.10 0.67 FA 56.5 28.5 25.3 25.1 1.18 0.77 NV 20.2 26.8 6.2 15.0 0.68 0.26 PA 50.6 34.5 19.3 25.4 1.07 0.63 DY 33.1 32.5 15.0 24.4 0.65 0.24 SL 35.5 34.9 25.0 30.4 0.33 0.06 AP 43.5 38.7 12.7 24.7 0.99 0.55 CO 35.6 35.9 13.7 25.7 0.73 0.29 DI 15.6 27.8 8.5 19.8 0.30 0.05 Abbreviations: AP, appetite loss; CF, cognitive function; CO, con-stipation; DI, diarrhea; DY, dyspnea; EF, emotional function; EORTC QLQ-C30, European Organisation for Research and Treatment of Can-cer Quality of Life Questionnaire Core 30; ES, effect size; FA, fatigue; NV, nausea and vomiting; PA, pain; PF, physical function; QL, global quality of life; RF, role function; RV, Relative validity: performance of the measures indicated as the ratio of the sample sizes required to detect a mean difference with the measures being compared (ie, scores less than 1.0 indicate better performance for the QLQ-C30 summary score); SD, standard deviation; SF, social function; SL, insomnia.
a
Reference score for calculating relative validity (ie, the ratio of the F-statistics of the comparative score [numerator] and the refer-ence score [denominator]).
[image:7.594.47.288.95.286.2]4. Discussion
From the higher order HRQOL models originally intro-duced by Gundy et al. [10], we have identified a single higher-order factor model based on 27 of the 30 items of the QLQ-C30 (excluding QL and FI) that exhibits good model-data fit. The QLQ-C30 summary score derived from this model is better than the original QLQ-C30 scales in discriminating between groups known to be clinically different. On the basis of the total patient sample, we were unable to demonstrate that the summary scale performed equally well or better than the individual QLQ-C30 scales in terms of responsiveness to change over time. This was likely due to the fact that, for the entire sample, it was diffi-cult to detect significant change in QLQ-C30 scores over time, regardless of which measure was used (the summary scale or the original, individual scales). We were, however, able to identify a subsample of patients, those receiving radiotherapy, where significant change in the original QLQ-C30 scale scores was observed. The observed respon-siveness in the radiotherapy setting is something that one would expect a priori. In the context of that subgroup anal-ysis, the responsiveness of the summary scale was equal to
or better than that of the original, individual scales of the questionnaire.
The availability of this summary score for the QLQ-C30 provides a psychometrically more robust alternative to the two-item overall QL scale score that is used frequently as the primary HRQOL endpoint in observational studies and clinical trials in oncology settings. Although model-data fit was acceptable to good for all models proposed by Gundy et al.[10], most two-factor models fell short of the additional criterion we posed in this analysis, namely, requiring the loadings to be greater than 0.40. The single-factor HRQOL model including QL and FI exhibited acceptable fit. Although this model may seem intuitively attractive, it exhibited identification problems. These iden-tification problems reflect the remark of Gundy et al.[10] that including the two-item quality of life scale as an explicit element of a higher order model is problematic conceptually, and that the FI item should be omitted because it is often excluded from analysis and reporting of QLQ-C30 results. As pointed out in the results section, the single higher order factor model, excluding QL and FI, was preferred for statistical and conceptual reasons. It also deals best with the potential problem of alpha error inflation. In known-group comparisons and analysis of responsiveness the newly developed QLQ-C30 summary score outperformed or performed equally well as the indi-vidual QLQ-C30 scales.
[image:8.594.43.284.94.287.2]In an earlier attempt to develop a summary score for the QLQ-C30, Hinz et al. [11] compared a functioning and symptom summary score (comparable to our model 4) against a single summary score comprising all 30 items. On the basis of known-group comparisons, a single sum-mary score was favored. As noted in the introduction, Nordin et al.[12]found that the two-item QLQ-C30 quality of life scale was not sensitive enough to detect group differ-ences over time as opposed to three alternative summary measures based on all or part of the QLQ-C30. However, neither Hinz et al. nor Nordin et al. based their proposed, alternative scoring algorithms on explicit conceptual con-siderations; nor did they conduct formal testing of measure-ment models using structural equation modeling or other statistical techniques. In our view, a particular problem with the scoring algorithm proposed by Hinz et al. is that it is based on the scores of all individual items of the QLQ-C30, rather than on scale scores. By doing so, they implic-itly weighted the summary score such that those scales with more items contributed more to the summary score than those scales with fewer items. In contrast, our scoring approach calculates the scale scores as the mean of the summed items in a scale rather than as the sum of the items in that scale. In this way, all scales are given equal weight (importance). This scoring algorithm reflects the EORTC Quality of Life Group’s decision to weigh all QLQ-C30 scales equally, regardless of the number of items in a scale. The fact that some QLQ-C30 scales contain more items than others reflects the complexity of the domain being Table 6.Effect sizes and relative validities for the scales and summary
score of the EORTC QLQ-C30 for responsiveness to change in patients before and during radiotherapy
Scale
Pretreatment, N[244
On-treatment, N[244
ES RV Mean SD Mean SD
Summary score 78.8 17.1 64.6 29.5 0.59 1.00a PF 75.1 25.5 65.8 32.6 0.32 0.47 SF 79.4 26.6 67.7 35.3 0.37 0.35 RF 71.0 36.2 61.0 36.8 0.27 0.23 EF 75.7 24.7 62.7 31.9 0.46 0.40 CF 83.3 23.3 68.4 33.9 0.51 0.61 QL 59.5 24.6 51.8 23.6 0.32 0.19 FA 30.0 27.4 45.0 31.4 0.51 0.72 NV 7.8 17.4 25.7 34.5 0.66 0.81 PA 31.9 33.0 41.2 33.9 0.28 0.24 DY 19.1 27.9 30.2 35.8 0.35 0.28 SL 27.1 31.2 41.2 35.3 0.42 0.34 AP 15.7 26.9 39.4 38.6 0.71 1.07 CO 20.6 31.1 36.8 37.1 0.47 0.46 DI 7.2 17.8 26.3 35.4 0.68 0.67 Abbreviations: AP, appetite loss; CF, cognitive function; CO, con-stipation; DI, diarrhea; DY, dyspnea; EF, emotional function; EORTC QLQ-C30, European Organisation for Research and Treatment of Can-cer Quality of Life Questionnaire Core 30; ES, effect size; FA, fatigue; NV, nausea and vomiting; PA, pain; PF, physical function; QL, global quality of life; RF, role function; RV, relative validity: performance of the measures indicated as the ratio of the sample sizes required to detect a mean difference with the measures being compared (ie, scores less than 1.0 indicate better performance for the QLQ-C30 summary score); SD, standard deviation; SF, social function; SL, insomnia.
a
Reference score for calculating relative validity (ie, the ratio of the F-statistics of the comparative score [numerator] and the refer-ence score [denominator]).
assessed (eg, emotional functioning being a more complex domain than constipation), but not the importance attached to the domain. Finally, as we noted in the methods section, we initially examined an additional, 8th measurement model for the QLQ-C30 that included all 15 scales. Howev-er, those data could not be fitted into a single higher order factor model.
The FACT-G, another widely used HRQOL question-naire, also has a summary (or total) score. To the best of our knowledge, the FACT-G total score is not based on the results of higher order CFA. Nonetheless, known-group comparisons and analyses of responsiveness comparing the FACT-G total score to its individual scales showed similar results to those of our study comparing the C30 summary score with the individual QLQ-C30 scale scores[34,35].
King et al.[5]reported that the FACT-G total score out-performed the two-item QLQ-C30 global QL scale score in terms of both RV (0.31) and responsiveness to change over time. In our analysis of responsiveness, the QLQ-C30 Global QL scale had an RV of only 0.18 when compared to the QLQ-C30 summary score, suggesting a major gain in responsiveness when using the summary score. These re-sults are not surprising given that the FACT-G total score and the QLQ-C30 summary score summarize data from a larger set of items (both 27 items), whereas the EORTC global QL scale score is based on only two items. It would be of interest to compare the RV and responsiveness of the FACT-G total score and the QLQ-C30 summary score.
The generalizability of our results is enhanced by the fact that we had a very large and heterogeneous sample of patients drawn from a number of participating countries. There was some imbalance in the sample with regard to diagnosis. However, as diagnosis was linked directly to the patient samples contributed by the participating coun-tries, we were able to compensate for this to some degree by taking cluster sampling into account. Nevertheless, we acknowledge that some patient populations (eg, head-and-neck cancer) were overrepresented, and others may have been underrepresented in our sample.
Conclusion
In conclusion, our results provide empirical support for a measurement model for the QLQ-C30 that yields a single summary score based on 13 scales (27 items). The validity and responsiveness of the new summary score is equal to, and in many cases superior to the original, underlying QLQ-C30 scale scores. Although not being a substitute for the individual scales, the availability of the QLQ-C30 summary score can reduce the risk of type I errors that can occur when making comparisons on the basis of the 15 outcomes generated by this questionnaire. In addition, use of the QLQ-C30 summary score can reduce sample size requirements. At the same time, there is some debate about
the appropriateness of using summary scores in certain research contexts, for example, in confirmatory clinical tri-als conducted to support product labeling claims [36,37]. However, these concerns may be more justified when a summary score is created on an ad hoc basis for a particular clinical trial. Ultimately, the research question and context should drive decisions regarding the optimal level of ques-tionnaire data aggregation or disaggregation.
Although further testing and use in both observational studies and clinical trials is encouraged, the EORTC Qual-ity of Life Group considers the current results to be suffi-ciently robust to recommend, provisionally, the use of the QLQ-C30 summary score to supplement the 15-outcome profile generated by the QLQ-C30. The exact scoring algo-rithm for generating the QLQ-C30 summary score is avail-able via the group’s Web site,http://groups.eortc.be/qol.
Acknowledgments
The authors would like to express their gratitude to many individuals who provided the data used in these ana-lyses, and to Chad Gundy (deceased) who played a key role in the design and execution of the original study investi-gating the higher order scale structure of the QLQ-C30.
Supplementary data
Supplementary data related to this article can be found at http://dx.doi.org/10.1016/j.jclinepi.2015.08.007.
References
[1] Aaronson N, Ahmedzai S, Bergman B, Bullinger M, Cull A, Duez N, et al. The European Organization for Research and Treatment of Can-cer QLQ-C30: a quality-of-life instrument for use in international clinical trials in oncology. J Natl Cancer Inst 1993;85:365e76. [2] Fayers PM, Aaronson NK, Bjordal K, Groenvold M, Curran D,
Bottomley A, et al. EORTC QLQ-C30 Scoring Manual. 3rd ed. Brus-sels: EORTC; 2001.
[3] Freemantle N. Interpreting the results of secondary end points and subgroup analyses in clinical trials: should we lock the crazy aunt in the attic? BMJ 2001;322:989e91.
[4] Simmons JP, Nelson LD, Simonsohn U. False-positive psychology: undisclosed flexibility in data collection and analysis allows present-ing anythpresent-ing as significant. Psychol Sci 2011;22:1359e66. [5] King MT, Bell ML, Costa D, Butow P, Oh B. The Quality of Life
Questionnaire Core 30 (QLQ-C30) and Functional Assessment of Cancer-General (FACT-G) differ in responsiveness, relative effi-ciency, and therefore required sample size. J Clin Epidemiol 2014; 67:100e7.
[6] Cella D, Pickard AS, Duh MS, Guerin A, Mishagina N, Antras L, et al. Health-related quality of life in patients with advanced renal cell carcinoma receiving pazopanib or placebo in a randomised phase III trial. Eur J Cancer 2012;48:311e23.
[7] Ludwig H, Viterbo L, Greil R, Masszi T, Spicka I, Shpilberg O, et al. Randomized phase II study of bortezomib, thalidomide, and dexa-methasone with or without cyclophosphamide as induction therapy in previously untreated multiple myeloma. J Clin Oncol 2013;31: 247e55.
[8] Burris HA, Lebrun F, Rugo HS, Beck JT, Piccart M, Neven P, et al. Health-related quality of life of patients with advanced breast cancer treated with everolimus plus exemestane versus placebo plus exemes-tane in the phase 3, randomized, controlled, BOLERO-2 trial. Cancer 2013;119:1908e15.
[9] Raykov T. Behavioral scale reliability and measurement invariance evaluation using latent variable modeling. Behav Ther 2004;35: 299e331.
[10] Gundy CM, Fayers PM, Groenvold M, Petersen MA, Scott NW, Sprangers MA, et al. Comparing higher order models for the EORTC QLQ-C30. Qual Life Res 2012;21:1607e17.
[11] Hinz A, Einenkel J, Briest S, Stolzenburg JU, Papsdorf K, Singer S. Is it useful to calculate sum scores of the quality of life questionnaire EORTC QLQ-C30? Eur J Cancer Care (Engl) 2012;21:677e83. [12] Nordin K, Steel J, Hoffman K, Glimelius B. Alternative methods of
interpreting quality of life data in advanced gastrointestinal cancer patients. Br J Cancer 2001;85:1265e72.
[13] Ware JE Jr, Kosinski M, Gandek B, Aaronson NK, Apolone G, Bech P, et al. The factor structure of the SF-36 Health Survey in 10 countries: results from the IQOLA Project. J Clin Epidemiol 1998;51:1159e65.
[14] G€uthlin C, Walach H. MOS-SF 36: structural equation modeling to test the construct validity of the second-order factor structure. Eur J Psychol Assess 2007;23(1):15e23.
[15] Hays R, Bjorner J, Revicki D, Spritzer K, Cella D. Development of physical and mental health summary scores from the patient-reported outcomes measurement information system (PROMIS) global items. Qual Life Res 2009;18:873e80.
[16] Cella D, Yount S, Rothrock N, Gershon R, Cook K, Reeve B, et al. The patient-reported outcomes measurement information system (PROMIS): progress of an NIH Roadmap cooperative group during its first two years. Med Care 2007;45:S3e11.
[17] Scott NW, Fayers PM, Bottomley A, Aaronson NK, Graeff A, Groenvold M, et al. Comparing translations of the EORTC QLQ-C30 using differential item functioning analyses. Qual Life Res 2006;15:1103e15.
[18] Scott NW, Fayers PM, Aaronson NK, Bottomley A, Graeff A, Groenvold M, et al. The use of differential item functioning analyses to identify cultural differences in responses to the EORTC QLQ-C30. Qual Life Res 2007;16:115e29.
[19] Wilson IB, Cleary PD. Linking clinical variables with health-related quality of life: a conceptual model of patient outcomes. JAMA 1995; 273:59e65.
[20] Pagano IS, Gotay CC. Modeling quality of life in cancer patients as a unidimensional construct. Hawaii Med J 2006;65:76e80. 82-5. [21] Boehmer S, Luszczynska A. Two kinds of items in quality of life
in-struments: ’indicator and causal variables’ in the EORTC qlq-c30. Qual Life Res 2006;15:131e41.
[22] Fayers PM, Hand DJ. Factor analysis, causal indicators and quality of life. Qual Life Res 1997;6:139e50.
[23] Muthen LK, Muthen BO. Mplus User’s Guide. 6th ed. Los Angeles, CA: Muthen & Muthen; 1998-2007.
[24] Hjermstad MJ, Fossa SD, Bjordal K, Kaasa S. Test/retest study of the European Organization for Research and Treatment of Cancer Core Quality-of-Life Questionnaire. J Clin Oncol 1995;13: 1249e54.
[25] Muthen B, du Toit S, Spisic D. Robust Inference using Weighted Least Squares and Quadratic Estimating Equation in Latent Variable Modeling with Categorical and Continuous Outcomes 1997. Avail-able at http://www.statmodel.com/bmuthen/articles/Article_075.pdf
Accessed January 8, 2015.
[26] Flora D, Curran P. An empirical evaluation of alternative methods of estimation for confirmatory factor analysis with ordinal data. Psychol Methods 2004;9:466.
[27] Hu Lt, Bentler PM. Cutoff criteria for fit indexes in covariance struc-ture analysis: conventional criteria versus new alternatives. Struct Equ Modeling 1999;6:1e55.
[28] Schermelleh-Engel K, Moosbrugger H, M€uller H. Evaluating the fit of structural equation models: tests of significance and descriptive goodness-of-fit measures. Meth Psychol Res 2003;8(2):23e74. [29] Ferguson E, Cox T. Exploratory factor analysis: a Users’ Guide. Int J
Select Assess 1993;1:84e94.
[30] Cohen J. Statistical power analysis for the behavioural sciences. New York: Academic Press; 1977.
[31] Fayers P, Hays R. Assessing quality of life in clinical trialsdmethods
and practice. Oxford: Oxford University Press; 2005.
[32] Raczek AE, Ware JE, Bjorner JB, Gandek B, Haley SM,
Aaronson NK, et al. Comparison of Rasch and summated rating scales constructed from SF-36 physical functioning items in seven countries: results from the IQOLA Project. J Clin Epidemiol 1998; 51:1203e14.
[33] Lei P-W, Wu Q. Introduction to structural equation modeling: issues and practical considerations. Educ Meas 2007;26(3):33e43. [34] Costet N, Lapierre V, Benhamou E, Le Gales C. Reliability and
val-idity of the Functional Assessment of Cancer Therapy General (FACT-G) in French cancer patients. Qual Life Res 2005;14: 1427e32.
[35] Dapueto J, Francolino C, Servente L, Chang C-H, Gotta I, Levin R, et al. Evaluation of the functional assessment of Cancer Therapy-General (FACT-G) Spanish Version 4 in South America: classic psychometric and item response theory analyses. Health Qual Life Outcomes 2003;1:32.
[36] US Department of Health and Human Services. Guidance for industry. Patient-reported outcome measures: use in medical product develop-ment to support labeling claims 2009. Available at www.fda.gov/ downloads/Drugs/GuidanceComplianceRegulatory/Information/Guida nces/UCM193282.pdfAccessed January 8, 2015.
[37]DeMuro C, Clark M, Doward L, Evans E, Mordin M, Gnanasakthy A. Assessment of PRO label claims granted by the FDA as compared to the EMA (2006-2010). Value Health 2013;16:1150e5.