2014
Generating a framework for the evaluation of
structural layout preferences within e-commerce
websites
Bennett Stone
Iowa State University
Follow this and additional works at:https://lib.dr.iastate.edu/etd
Part of theAdvertising and Promotion Management Commons,Art and Design Commons,
Communication Technology and New Media Commons,Digital Communications and Networking Commons,Marketing Commons, and theSocial Media Commons
This Thesis is brought to you for free and open access by the Iowa State University Capstones, Theses and Dissertations at Iowa State University Digital Repository. It has been accepted for inclusion in Graduate Theses and Dissertations by an authorized administrator of Iowa State University Digital Repository. For more information, please [email protected].
Recommended Citation
Stone, Bennett, "Generating a framework for the evaluation of structural layout preferences within e-commerce websites" (2014).
Generating a framework for the evaluation of structural layout preferences within e-commerce websites
by
Bennett Stone
A thesis submitted to the graduate faculty
in partial fulfillment of the requirements for the degree of
Master of Science
Major: Human Computer Interaction
Program of Study Committee: Debra Satterfield, Major Professor
Sunghyun Kang Stephen Gilbert
Iowa State University Ames, Iowa
2014
TABLE OF CONTENTS
Page
LIST OF FIGURES ... iv
LIST OF TABLES... vi
NOMENCLATURE ... ix
ABSTRACT ... x
CHAPTER 1. BACKGROUND... 1
Research Goals ... 3
Hypothesis ... 4
CHAPTER 2. LITERATURE REVIEW... 5
Web Atmospherics ... 6
Website Design Features ... 7
Website Appeal and Loyalty ... 8
Gender and Consumer Decision-Making in E-Commerce Sites ... 9
Cross-Cultural Comparisons of Aesthetics of E-Commerce Sites ... 10
Website Attraction and Cross-Cultural Differences... 12
CHAPTER 3. METHODOLOGY... 14
Introduction ... 14
Background... 14
Evaluation of Existing Websites... 16
Preparation of Scripts and Graphics for Analysis ... 18
Preparation of Test Websites... 25
Data Collection Objectives... 30
Data Collection Procedures ... 31
User Profile Questions... 33
Online Purchasing Related Questions ... 34
CHAPTER 4. DISCUSSION ... 39
Pilot Study Results... 41
Overview of Participant Demographics ... 42
Grouped Preferential Analysis... 45
Demographic Results Analysis... 46
Analysis of Layout Preferences... 47
Analysis of Advertising Preferences ... 51
Analysis of Logo Placement Preferences ... 53
Analysis of Primary Navigation Preferences... 55
Analysis of Secondary Navigation Preferences... 57
CHAPTER 5. SUMMARY AND CONCLUSIONS... 60
Limitations of Research... 61
Conclusions ... 62
Future Research ... 63
REFERENCES ... 65
APPENDIX A LIST OF ANALYSIS WEBSITES... 71
APPENDIX B ONLINE RECRUITMENT MESSAGE... 73
APPENDIX C ANALYSIS SCRIPT ... 74
APPENDIX D INFORMED CONSENT ... 77
APPENDIX E RGB ASSIGNMENTS FOR ANALYSIS ... 80
LIST OF FIGURES
Page
Figure 1: Typical E-Commerce Structure ... 3!
Figure 2: Atypical E-Commerce Structure... 3!
Figure 3: Amazon.com pre-overlay state ... 20!
Figure 4: Amazon.com post-overlay state... 20!
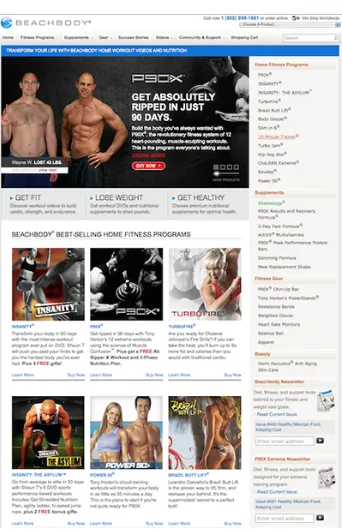
Figure 5: Beachbody.com pre-overlay state ... 20!
Figure 6: Beachbody.com post-overlay state ... 20!
Figure 7: Amazon.com post-processed ... 21!
Figure 8: BedBathandBeyond.com post-processed... 21!
Figure 9: Initial Template 1 ... 27!
Figure 10: Initial Template 2 ... 27!
Figure 11: Product Shape Replacement... 28!
Figure 12: Example Logo Evaluation Screen... 30!
Figure 13: Online Purchase Options... 35!
Figure 14: Preparatory question instruction for participants ... 36!
Figure 15: Countdown Timer ... 37!
Figure 16: Final format of preference evaluation screens ... 38!
Figure 17: Reported Participant Employment Status ... 44!
Figure 18: Reported Participant Relationship Statuses ... 44!
Figure 19: Reported Participant Ages ... 45!
Figure 21: Structure Gender Analysis ... 48!
Figure 22: Structure Income Analysis Results ... 50!
Figure 23: Full advertising analysis for all profiles... 52!
Figure 24: Full logo placement analysis for all profiles... 54!
Figure 25: Full primary navigation analysis for all profiles... 56!
LIST OF TABLES
Page
Table 1: Example Comparison of E-Commerce Structures ... 3!
Table 2: Preliminary Website Coding ... 20!
Table 3: Example of Post Processed Graphics ... 21!
Table 4: Sample Analysis Output... 23!
Table 5: Analysis of Logo Placement... 24!
Table 6: Analysis of Primary Navigation Placement ... 24!
Table 7: Analysis of Layouts... 24!
Table 8: Average Occupied Space for All Variables ... 25!
Table 9: Initial Templates... 27!
Table 10: Example Specifications for Logo Evaluation... 29!
Table 11: Logo Locations... 39!
Table 12: Primary Navigation Locations... 40!
Table 13: Secondary Navigation Locations... 40!
Table 14: Layout Analysis... 40!
Table 15: Reported Participant Income ... 42!
Table 16: Structure Gender Preference ... 48!
Table 17: Structure Educational Analysis ... 49!
Table 18: Structure Employment Analysis... 49!
Table 20: Structure Frequency Analysis ... 51!
Table 21: Structure Spending Analysis ... 51!
Table 22: Advertising Age Analysis ... 52!
Table 23: Advertising Gender Analysis ... 52!
Table 24: Advertising Educational Analysis ... 52!
Table 25: Advertising Educational Analysis ... 53!
Table 26: Advertising Income Analysis ... 53!
Table 27: Advertising Frequency Analysis ... 53!
Table 28: Advertising Spending Analysis ... 53!
Table 29: Logo Placement by Gender ... 54!
Table 30: Logo Placement by Education... 54!
Table 31: Logo Placement by Employment ... 54!
Table 32: Logo Placement by Income... 55!
Table 33: Logo Placement by Frequency ... 55!
Table 34: Logo Placement by Spending... 55!
Table 35: Primary Navigation by Gender... 56!
Table 36: Primary Navigation by Education ... 56!
Table 37: Primary Navigation by Employment... 56!
Table 38: Primary Navigation by Income ... 57!
Table 39: Primary Navigation by Frequency ... 57!
Table 40: Primary Navigation by Spending ... 57!
Table 42: Secondary Navigation by Education ... 58!
Table 43: Secondary Navigation by Employment... 58!
Table 44: Secondary Navigation by Income ... 59!
Table 45: Secondary Navigation by Frequency ... 59!
NOMENCLATURE
SOC United States Standard Occupational Classification System
ISCO International Standard Classification of Occupations
UNSD United Nations Statistics Division
B2C Business to Consumer
ABSTRACT
Global businesses are increasingly reliant on sales through electronic channels,
and the importance of aesthetic satisfaction for e-commerce visitors is crucial to
survival. A study by Kogaonkar and Wolin (Korgaonkar et al., 1999) shows that
consumers are motivated to make purchases online based on "the aesthetic enjoyment
and positive experience of emotion online," enhancing the need for websites that appeal
to a visitors aesthetic preferences. Pursuing a competitive foothold within a shifting
global marketplace, companies often seek out new visual bases for web presences,
generating web designs based on perceived preferences of design. These designs are
often assumed to be attractive to visitors, which may be inaccurate.
The goal of this research is to generate a framework that analyzes target audience
structural design preferences for e-commerce websites. This study hypothesizes that
clearly identifiable structural design preferences exist within e-commerce applications,
and can be generalized within individual demographic profiles.
Forty-four websites were selected from publicly available listings of the most
frequently visited global e-commerce websites. Service, rental, and listing websites
were excluded from this research. A full size website image was taken using automated
processing software for each website, and each image was analyzed to obtain a list of
common features including: primary navigation, secondary navigation, company
products. A secondary script was created to analyze each image that calculated the exact
number of pixels, location, and percentage of space dedicated to each feature.
A global pool of participants completed a user profile survey, an online
purchasing evaluation assessing current and past online purchase behavior, and then
were presented a series of questions. Each question screen evaluated only a single
feature, and included between 2 - 6 variations of images of a custom e-commerce
website created specifically for this study.
Results showed that clearly identifiable structural design preferences could be
analyzed, that preferences could be generalized within both grouped profiles, and
individual demographic profiles, and variable connections did travel together with
CHAPTER I
BACKGROUND
According to many sources, it all began with a single sale of a compact disc;
Sting’s “Ten Summoners Tales” to be specific (Gilbert, 2004). From such humble
beginnings, to the current state of electronic commerce (e-commerce) with nearly $74
million in transactions per day, and quarterly sales in only the first quarter of 2014 of
$66.9 billon, or 6.2% of total sales for just the United States (Thomas, 2014),
e-commerce is beyond comparison when evaluating the size and volume of electronic
usage expansion. An ever-increasing volume of research is performed continually
around the topic of e-commerce, however, only limited research has been performed on
the topic of how the structural design of an e-commerce website affects consumer
purchasing behavior. Also, to extend the topic further, limited research exists on how
demographic variables affect consumer purchase behavior based on the structural
designs of e-commerce websites.
Businesses are increasingly reliant on sales through electronic channels, and the
importance of overall aesthetic satisfaction for e-commerce visitors is crucial in the
survival of companies, and in particular- companies without a large brick-and-mortar
presence. A 1999 study by Kogaonkar and Wolin (Korgaonkar et al., 1999) shows that
consumers are largely motivated to make purchases online based on "the aesthetic
enjoyment and positive experience of emotion online," further enforcing the need for
effective and competitive pricing structures. Pursuing a competitive foothold within this
constantly shifting global marketplace, companies and individuals often seek out new
visual bases for their web presence, generating web designs based on perceived
preferences of design and layout. These designs are often assumed to be attractive to
visitors, however, without statistically sound analysis, these assumed designs are capable
of alienating or driving away large segments of their target markets in an environment
where "only 36 percent of pure internet sellers, have profitable online businesses"
(Quick, 2000).
This research was designed to determine variables specific to structural design
within e-commerce websites, as opposed to the purely artistic taste and general
appreciation of beauty commonly known as aesthetics. As the study of pure aesthetics is
vast and contains an infinite number of possible variables for analysis, the term
“structural design” seeks to determine the underlying factors altering preference and
appreciation through evaluation of factors that are capable of being analyzed and
quantified across any number of same-type entities; in this case e-commerce websites.
This particular area of evaluation however, is not without its inconsistencies and
idiosyncrasies, many of which may be seen in the websites used in this research. Alexa’s
list of top visited shopping websites (Alexa Top Sites, 2014) consistently lists Amazon
(amazon.com), and EBay (ebay.com) within the top 5 most visited e-commerce websites
in the world, however, a brief visual comparison of either site to other websites in the
aesthetic of each site- potentially leading to confusion when performing visual
[image:15.612.109.530.175.313.2]references (See Table 1: Example Comparison of E-Commerce Structures for example).
Table 1: Example Comparison of E-Commerce Structures
Figure 1: Typical E-Commerce Structure Figure 2: Atypical E-Commerce Structure
Research Goals
The primary goal of this research was to determine if there are variances in
structural design preferences specific to e-commerce shopping that might be associated
with core demographic variables. The secondary goal of this research was to generate a
reliable framework by which structural design preferences for e-commerce websites
could be grouped based on target audience demographic variables, and recreated as web
development trends and designs change. For example, an e-commerce website
specializing in clothes for middle-aged Japanese men would most likely have different
requirements than an online marketplace for indoor lighting fixtures for commercial
properties in order to provide a level of visual satisfaction for a sale to occur. The
placement, promotional, and color-based recommendations for a wide range of targeted
e-commerce platforms to further enable customer engagement. Furthermore, the
recommendations provided by this analysis are designed to be updated periodically using
easily updated scripts, and would be well suited for usage within a web-based service for
designers, web developers, and business owners.
Hypothesis
This study makes hypothesizes that clearly identifiable structural design
constants exist within e-commerce applications, and user preference for each variance
CHAPTER 2
LITERATURE REVIEW
The growth of online shopping is fueled by its advantages (Eroglu, Machleit, &
Davis, 2001). Thus, firms are increasingly relying on ecommerce solutions to reach
their project objectives (Freemantle, 2002). Unfortunately, many websites fail to help
companies reach these objectives. Kearney (2001) found that 82% of online shoppers
drop out of their shopping carts without completing the purchase. Another study found
that websites fail to generate satisfying shopping experiences (Kane, 1999). Several
studies contend that these failures are the result of neglected consumer needs (Neilson,
2000; Rosen and Purinton, 2004). Richard (2005) likened web design to store
atmospherics and supported its criticality in determining effectiveness. Song and Zahedi
(2005) argue that little is known about how websites should be designed to optimize the
consumer experience. Rather than create virtual spaces that enhance the online
shoppers’ experience, companies often chose to either copy successful sites or construct
websites that mirror their offline stores (Rosen & Purinton, 2004).
Unlike traditional information systems, e-commerce systems contain
characteristics of both an information system and a marketing channel, thereby involving
both machine and human elements contained within the human-computer interface.
Effective web design requires looking at both of these factors from the user’s viewpoint
Web Atmospherics
In traditional retailing, form and content of store atmospherics have become an
established field of research study. There is wide acceptance of the importance of the
retail environment (Bitner, 1992) and physical form of a product (Bloch, 1995) in
creating certain effects in buyers (Kotler, 1973–1974; Bitner, 1992). However, there is a
relatively small body of literature on web atmospherics (Lavie and Tractinsky, 2004).
Retail customer interface, commonly termed store atmospherics, may account for
up to two-thirds of in-store purchases (Bandyopadhyay,Wieragama, and Khuller, 2000).
In e-commerce web sites, atmospherics are included in the computer interface, yet little
is currently known about how this interface affects consumers' purchase intentions
(Richard, 2005). Web atmospheric research studies that have been conducted have been
anchored in one or more number of traditions:
1) The tradition of ‘experimental aesthetics’ (Berlyne, 1974). This seeks to
identify the isolated elements in the evaluated objects that elicit particular
reactions. Schenkman and Jonsson (2000) tested the importance of different
measures in the experience of a web page, finding a combination of pictures and
beauty to be important constituents in appeal.
2. The exploratory tradition. This evaluates complete and natural stimuli rather
than manipulated and artificial ones (Nasar, 1988). Schenkman and Jonsson
(2000) used 13 commercial websites as stimuli while Lavie and Tractinsky
3. The Kantian view of aesthetics. This assumes aesthetic preferences to be
universal. Given the presumption of universally held values, a number of studies
of web aesthetics seek universal rather than segmented values (Schenkman and
Jonsson, 2000; van der Heijden, 2003; Lavie and Tractinsky, 2004).
4. The interactionist position. This sees aesthetic perceptions as a function of
individual perception (Porteous, 1990) rather than universal values leading to the
search for segmented values (Leong, 1997; Miller and Arnold, 2000; Flanigan
and Metzger, 2003; Oser, 2003). This position takes the perspective that
products should be shaped around the ‘unique and particular needs’ of the
customer (Hammer, 1995). In the field of branding, it translates into the view
that there should be congruence between the brand personality and the
consumer’s self-concept on the basis that purchases are thought to offer a vehicle
for self-expression (Karande et al., 1997).
Website Design Features
Within the Web environment, computer factors are those whose presence
provides functionality (Liang and Lai, 2001). These are characterized by Richard (2005)
as high task relevant. These elements include: technical aspects, navigation,
impartiality, and information content, as computer factors. The human factors are those
hedonic elements that add value to the Website by contributing to user satisfaction
These categories of human factors on the Web include enjoyment, cognitive
outcome, user empowerment, credibility, visual appearance, and organization of
informational content. These correspond well with Richard's (2005) low task relevant
features.
Website Appeal and Loyalty
Several researchers have suggested that specific features including, download
speed, reputation of merchant, variety of products available) have an impact upon
website appeal because they perform particular underlying roles or functions.
Srinivasan, Anderson, and Donnavolu (2002) found eight functions of site features that
impact customer loyalty to a retail site: 1) customization, 2) interactivity, 3) "cultivation"
(i.e., provision of information and incentives to extend customer purchasing over time),
4) "care" (operationally, features that keep customers informed of the availability of
preferred products and of the status of their orders, or features that minimize disruption
in service), 5) "community" (i.e., provision of a structure to facilitate the exchange of
user opinions and information about offered products/services), 6) "choice" (variety of
products), 7) convenience, and 8) "character" (i.e., text/graphics/slogans, etc., projecting
an image or personality of the web merchant). All of the aforementioned features except
convenience were found to enhance customer loyalty.
Other researchers have considered the perceptual or evaluative dimensions a
consumer uses in assessing the appeal of a website. Chen and Wells (1999) suggested
informative, and how organized it is. Yoo and Donthu (2001) noted that users evaluate
the quality of a site along four dimensions: ease of use, aesthetic design, processing
speed, and security. From the perspective of consumer motives, Keeney (1999) derived
25 categories of online consumer shopping objectives. Objectives were categorized as
means-oriented (e.g., maximize product information) or fundamentally ends oriented
(e.g., maximize product quality). Parsons (2002) provided a taxonomy of online shopper
motives, differentiating among the functional (e.g., convenience), the personal
nonfunctional (e.g., diversion from daily routine), and the social non-functional (e.g.,
communication with like-minded others) motives.
Impulse Purchasing on E-Commerce Web Sites
Chen et al. (2002) argue that e-retailers must do the following to create more
effective online shopping experiences: 1) make users feel comfortable, 2) create sites
that are fun to use, 3) entice consumers to spend more time and revisit, and 4) increase
the likelihood of a purchase. However, this framework lacks the specificity necessary to
determine the suitability of specific design elements (Hausman & Siekpe, 2009). This
list is comparable to Srinivansan, Anderson, and Donnavolu’s (2002) functions of a site
to impact customer loyalty, as well as overlapping with Yoo and Donthu’s (2001) list.
Gender and Consumer Decision-Making in E-Commerce Sites
Not surprisingly, data reveals that both men and women to are important users of
(Jupiter communications, 2002), with women accounting for about 51% of the total
online adult population. European usage reported female usage of the web to be an
average of 38% (Jupiter communications, 2002) with usage at 42% in the UK. This
average is higher in Sweden (at 46%) but lower in Germany and France (at 39%), Italy
(31%) and Spain (29%).
Moss et al. (2006) investigated the differences between male and female in their
website preferences. In this study, they found statistically significant differences in 13
out of the 23 factors analyzed. Most of the significant differences occurred in the areas
of visuals and language, with one difference occurring in the area of navigation. The
four factors of self-denigration, expert language, the use of particular text color, and the
use of horizontal layout produced the largest statistical difference between the two
genders. Also differences centered on the use of blue/black typography, abbreviations,
informal language and the formality of the images, and centered on the use of crest, a
male figure, and formal typography.
Cross-Cultural Comparisons of Aesthetics of E-Commerce Sites
With increases in technological advancement and the growth of e-commerce and
a global marketplace, businesses must have a better understanding of how to more
effectively cater to global consumers. These consumers differ in nation, creed, gender
and task use. The United States is still currently the biggest exporter in the world with
80% of all software development (O’Sullivan, 2003), however, American companies are
that this is due to a lack of understanding of local customers culture. The impact of new
technologies shows user resistance and that these users reject products with Western
metaphors in favor of products that are localized according to their cultural customs
(Zahedi, Van Pelt & Song, 2000). This problem has spurred research into the cultural
aspects of interface design (Marcus, 2001).
Based on the definitions of existing cultural models, Marcus and Gould (2001)
have tried to create localized interfaces for national cultures. They believe that
“companies that want to do international business on the web should consider the impact
of culture on the understanding and use of Web-based communication, content and
tools.” They suggest cross-referencing existing works on culture from Edward T. Hall,
David Victor, Fons Trompenaars and Geert Hofstede. Hofstede (1991) identified
patterns in the way people act, feel and think and formulated a theory by defining 5
dimensions of culture. These were collectivism vs. individualism, femininity vs.
masculinity, long vs. short-term orientation, power distance and uncertainty avoidance.
Based on these dimensions, Marcus and Gould (2001) introduce guidelines for web site
design for distinct countries that fall into the different categories. Jagne et al. (2006)
argue that these guidelines are questionable since 1) no usability studies were provided
from users from the various countries, 2) users originating from the same country do not
necessarily fit into the cultural mold laid out by Hofstede, and 3) no other factor of web
However, Jagne et al. (2006) and Hall (2001) note that one apparent reason why
classic cultural models have not been effective in the implementation of cross cultural
interface models is that these existing cultural models were designed for different
purposes and not for e-commerce applications.
Website Attraction and Cross-Cultural Differences
Given that nations and cultures differ in media perceptions (e.g., Rice &
D'Ambra,1998; Ross, 2001), it is not surprising that they have been found to differ in the
role played by website features in attracting shoppers. Lynch et al., (2001) noted that
nations differ in the role played by trust, site quality, and elicited affect in producing
purchase intent and site loyalty. Jarvenpaa and Tractinsky (1999) determined that
cultures vary in consumer expectations of what makes a web merchant trustworthy and
in the consequences of those judgments of trustworthiness. Unfortunately, beyond work
such as the above, there has been limited empirical and theoretical analysis of the nature
of national differences in the drawing power of specific website features. More
critically, there has not emerged a common conceptual framework for quantitatively
assessing such differences.
Blake et al. (2004) presented a framework to identify the nature of cross-national
differences in the appeal of online shopping site features. The objective of the
framework or model was to identify the nature of cross-national differences in the appeal
of online shopping site features. As clarified by Kollman (2001), the features are
(e.g., interactivity, flow). This was done to make the framework more actionable for
practitioners without loss of value to researchers interested in theory development, as
well as making it possible for study respondents to grasp more clearly the issue they
were asked to evaluate.
The model included three "Types" of national differences in feature appeal—
“Elevation”, “Differentiation”, and “Priority”. Elevation is the overall demand for, or
responsiveness to, website features in general. Differentiation is the variability in the
appeal of the various features in the eye of each individual shopper. Priority if the
relative appeal of a feature compared to the appeals of the other features in the eyes of a
particular shopper.
These national differences can occur at two levels, Individual and Societal. The
framework assumed that the assessment of national differences in feature appeal is
conducted in a hierarchical fashion, going from the most to the least general for the
Types and from the more specific to the more abstract for the Levels. In each case, the
examination begins with the most fundamental indicator(s) and builds from one level to
CHAPTER 3
METHODOLOGY
Introduction
As the core purpose of this research was to determine if structural design
variances existed that could affect consumer preference, this Thesis focuses primarily on
the methodology used to perform effective and detailed analysis on existing websites; as
well as post processing and image analysis. These procedures were used throughout the
course of this research, with each step being equally as important as the preceding steps.
The procedures detailed below are the final procedures used for data collection and
analysis, all of which were reviewed for accuracy and presentation upon tentative
completion of each, until it was determined that the expected presentation and potential
for analysis was correct.
Background
Prior to beginning any formal evaluation, it was determined that a reliable list of
the most visited e-commerce sites must be located; and that the list should be available
as a global list as opposed to a geographically restricted list to provide an effective
starting point for future studies with a global participant pool. The websites used for
reference and evaluations were to be selected solely on standing within this global list of
secondary features was to be based solely on the presence of those features, and not
factors such as: country of popularity, country of ownership, or position on the list.
A reliable, and regularly updated list of e-commerce sites was located at Alexa
(Alexa Top Sites, 2014), and a criterion was created in order to ensure consistency of
items used from this list. This criterion was secondarily generated in order to facilitate
continued analysis while ensuring the same usable criteria for evaluation.
Of the compiled list, 44 E-commerce websites were selected from within the top
200, as ranked by number of visitors. Websites with business models based on selling
services, rentals, or classifieds listings were excluded from this research as sales for
those entities may be based on factors outside the control of the website, and as such;
only e-commerce websites which directly, or as a third-party sell products (B2C or C2C)
qualified for inclusion. Each website was further segregated into two distinct categories
for the purposes of extended analysis as necessary based on the following types:
1. Specialty Group websites, defined as e-commerce websites, which sell either
their own brand, or an individual product. For example, CD universe sells
only CD's and music, HM sells only HM brand clothing and accessories
2. Assorted Group websites, defined as e-commerce websites selling a wide
assortment of products with limited exclusions. Examples include
amazon.com and buy.com which sell any number of categorical items to
appeal to a wider range of consumers, with products provided either by the
Evaluation of Existing Websites
Once a preliminary list of websites for evaluation was generated (Appendix A),
automated processing software was used to output a high-resolution TIFF (tagged image
file format). Each website image was processed using matched parameters; websites
were allocated 60 seconds to load, with an additional 10 seconds to enable any deferred
JavaScript requests that could impact the structure or aesthetic features within the
viewport. Traditionally, screenshots are taken to represent only a constrained viewport1,
with a current average screen resolution of 1366 pixels in width and 768 pixels in
height2. The images for this study were, however, processed to the full available height
and width of each individual website- with an average height of 1850.2px, and an
average width of 985.1px so that a more reliable and comprehensive advanced graphical
analysis could be completed based on actual intended presentation (Appendix A).
All collected images were checked for consistency, and cross-referenced with the
associated e-commerce website to ensure that all applicable features and items had been
collected for analysis in the image. Each image was then screened manually to evaluate
common features, and determine whether those common features were applicable to
inclusion. For example, some common features such as links in a footer were deemed
unnecessary for the scope of this research due to the lack of variation in structure and
content, while the features evaluated in this Thesis were highly visible and capable of
altering the user’s experience of the website. The following features were evaluated in
this study:
1. Primary Navigation: List of links presented in varying ways providing visitors a
direct and readily accessible means of accessing other main pages internal to the
website
2. Secondary Navigation: List of links presented in varying ways providing visitors
direct and readily accessible means of accessing other sub-pages internal to the
website such as sub-level category pages
3. Company Promotions: Prominently featured blocks of space allocated to
internally promoting sales, or non-product-specific items available on the current
website
4. Logo Size: Actual height and width in pixels of the logo. Refers specifically to
the height and width of the logo as presented on the website, and not the native
height and width of the graphic itself
5. Logo Placement: Though many websites feature a logo placed on the top-left,
several had alternating positions, and as such this feature was deemed applicable
for inclusion
6. External Advertising: Prominently featured advertising that does not provide any
value-add for visitors, links to external locations, and serves as a added revenue
source for the e-commerce website
7. Featured Products: Similar to Company Promotions, but focusing on specific
8. Background Color: Although the majority of the e-commerce websites evaluated
for the purposes of this study had white or light colored backgrounds,
background color was added for evaluation as an extra measure both in image
analysis, and presentation within the Preparation of Test Websites as a secondary
point of evaluation
9. Layout: Specifically referring to the total number of vertical columns in which
content may be presented
It is important to note that a study performed by Madhavaram and Laverie
(Madhavaram et al., 2004) exploring stimuli associated with impulse purchasing in
online environments showed that aesthetics as well as price were critical within the
context of these variables, so while the features evaluated and noted within this Thesis
are core structural design features common across the evaluated websites, price and
pricing competitiveness is an outlying factor which was not evaluated for the purposes of
this research, and is addressed in greater depth in the Limitations section.
Preparation of Scripts and Graphics for Analysis
Prior to any image alteration, manipulation, or analysis, each of the core features
was assigned a fixed RGB value for future reference within automated script analysis,
with each RGB value being distinct with no cross referencing in order to ensure the
Photoshop, and a transparent overlying layer was applied to contain the color-coded
blocks representing each fixed feature while retaining the integrity of the collected
image. Images were then enlarged to view the contents at a 1px to 1px level
comparison3, and the RGB color-coded blocks were applied over each area designated
for evaluation with the same level of precision as the zoom level (1 to 1 ratio).
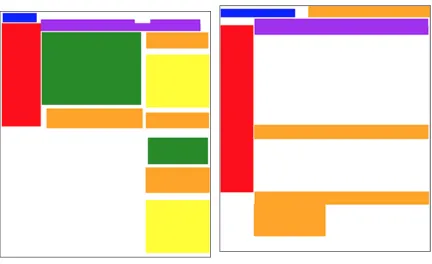
A sample of initial and post-blocked representation states can be seen in Table 2:
Preliminary Website Coding. Great care was taken to ensure that the overlaying boxes
were drawn to the exact measurements of each corresponding area, and multiple manual
crosschecks were implemented at the tentative completion of each alteration to each
generated image, as any irregularities may have otherwise altered the results for each
subsequent step of this research. As shown by the height decrease toward the middle in
Figure 4 of the secondary navigation section (shown in purple), areas containing
line-denoted or block-separated spaces were accounted for in addition to selectable
navigation items in order to ensure full and complete analysis of the areas denoted by
each colored block. The RBG specifications may be located in Appendix F.
Table 2: Preliminary Website Coding
Figure 3: Amazon.com pre-overlay state Figure 4: Amazon.com post-overlay state
[image:32.612.343.513.105.365.2] [image:32.612.116.287.398.663.2] [image:32.612.341.515.399.664.2]Once all applicable evaluative areas were correctly represented by the overlaid
color coded blocks in all 44 images, the original layer containing the actual website
contents was removed, and only the layer containing the overlaying blocks was exported
as a second graphic in high resolution TIFF format for automated script processing as
[image:33.612.101.533.269.533.2]shown in the table below.
Table 3: Example of Post Processed Graphics
Figure 7: Amazon.com post-processed Figure 8: BedBathandBeyond.com
post-processed
After all of the images were processed and checked for accuracy, a Python
programming script was coded specifically for the purposes of this study, and included
Glob functions to analyze the contents of a specific directory, and Image extensions in
well as adding capabilities to perform RGB and dimensional analysis. The script
performed the following series of functions4:
1. Scanning a predefined directory for TIFF files, and creating a list of the
files to be used
2. Iterating through each image individually
3. For each image, the script determined:
a. Actual pixel size in height and width
b. Total number of distinct RGB values
c. Matched number of RGB values associated with a fixed series of
values which correspond with the fixed color schema assigned to
each feature of each e-commerce website
d. Compared the dimensions of the matched RGB value to the total
image size
e. Calculated the exact number of pixels were occupied by each
RGB value
4. For the group, the script determined averages for each RGB assignment,
as well as minimums, maximums, and total values for all images and
collective values
5. At script completion, the results were written to a CSV file for further
analysis
The script used was altered multiple times throughout the image analysis process
to ensure the most accurate results possible, and the final script was determined to be
fully accurate at performing and calculating the steps above. After results of the image
analysis were generated and placed into a spreadsheet, the data was reviewed again for
accuracy, as well as being compared to manual measurements of the images used for this
study. A sample of the raw output is in Table 4 below:
Table 4: Sample Analysis Output
Area: RGB: Total pixels:
Total Image
Size: Percent Area:
Company
Promotions 255 165 0 90207 px 1924000 px 4.68851351351% 5 Featured
Products 34 139 34 383957 px 1924000 px
% 19.9561850312
Primary Nav 255 0 0 25284 px 1924000 px
% 1.31413721414
Secondary Nav 160 32 240 215504 px 1924000 px
% 11.2008316008
Logo 0 0 255 16951 px 1924000 px
% 0.881029106029
The final step of analysis for existing e-commerce websites was to prepare the
data for usage as a set of guidelines within the Preparation of Test Websites, which were
used for data collection. This step added data that was determined to not be available
programmatically such as: 1) logo placement within analysis websites, and percentage
featuring a left, center, or right aligned logo, 2) primary and secondary navigation
placement within analysis websites that were placed on the top, left, right, center, or
5 Analysis values were not rounded, but it should be noted that pixels may only be
bottom of the website, and 3) number of columns within the layouts of each analyzed
e-commerce website. The information gathered in this step was crucial to the test website
creation step, as it added in valuable representative structural information by which new
‘e-commerce websites’ could be created.
Table 5: Analysis of Logo Placement
Logo Location: Count Total Sites Percentage
Left 40 43 93.1%
Right 0 43 0.0000%
Center 3 43 6.9%
Table 6: Analysis of Primary Navigation Placement
Primary Navigation Location: Count
Total
Sites Percentage
Top 35 43 81.4%
Left 8 43 18.6%
Right 0 43 0%
Center 0 43 0%
Table 7: Analysis of Layouts
Layout (Columns) Count
Total
Sites: Percentage
1 column 12 43 27.9%
2 column 22 43 51.2%
3 column 8 43 18.6%
Table 8: Average Occupied Space for All Variables
Feature Percent of Total
Advertising: 0.66%
Company Promotions: 12.02%
Featured Products: 12.04%
Logo Size: 0.78%
Primary Navigation: 2.9%
Secondary Navigation: 4.14%
Preparation of Test Websites
After a full analysis had been completed of existing websites, a structure was
created from the collected data to ensure a strict set of guidelines by which the example
e-commerce sites used for data collection could be generated, and a distinct separate set
of guidelines was generated for each of the areas analyzed during the image analysis.
Average values from analysis data was used in order to create a structure of familiarity,
while providing participants with fewer possible points of evaluation than may have
otherwise been generated through the creation of entirely original example websites.
The guidelines generated provided structure for designs to evaluate the following areas
individually while remaining within the fixed size and placement guidelines:
1. Logo placement: left, center, or right with two fixed sizes: 189px X 78px
and 80px X 177px6 with a fixed maximum total pixel size of 14,742px
2. Site layout: 1 column, 2 columns, or 3 columns with a maximum
represented width of 985px, and fixed height of 1850px including
example footer content
3. Primary navigation location: top, left, or right aligned with a fixed
number of pixels totaling 54,175px and alternating height to width size of
985px X 55px vs. 55px X 985px
4. Secondary navigation location: top, left, right, or site-center
5. Advertising. All in same location with three variants: two 78px X 78px
advertisements, one 156px X 156px advertisement, and no advertisement
6. Featured products. Matched locations with four variants, each populated
with example items:
a. Eight separate 29px X 29px blocks
b. Four separate 117px X 117px blocks
c. Two 234px X 234px blocks
d. One 468px X 468px block
7. Company Promotions. Represented by three varying size blocks:
a. One 985px X 222px
b. Two 492px X 444px
c. Four 246px X 222px
8. Background Color. Evaluated using only solid primary colors- white,
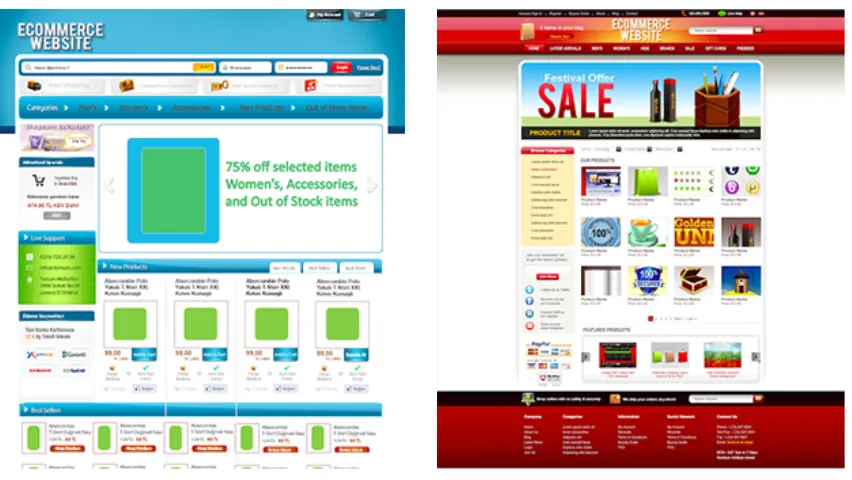
In total, 29 example websites were created using two different commercially
available Adobe Photoshop templates, both designed specifically to be generic regarding
product placement, and were carefully chosen to be industry agnostic. Both
starting-point designs also featured basic column structures, clearly defined placement locations,
[image:39.612.105.531.270.510.2]and color palettes that made use of primary colors with minimal variation.
Table 9: Initial Templates
Figure 9: Initial Template 1 Figure 10: Initial Template 2
After selection of the initial templates, both were adjusted to be exactly the same
height and width of 985px wide, and 1200px tall. Both templates were also stripped of
any visual representation of a physical or digital product to prevent any possible biases
background images, textures, and patterns were removed, and all text was overwritten to
be as generic as possible while still maintaining an indication of each applicable area.
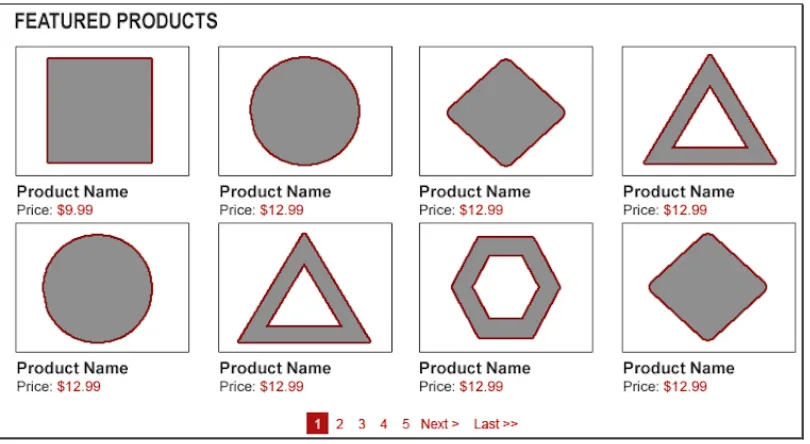
All product images were replaced with simple shapes such as triangles, squares, circles,
or rectangles depending on the area specified for presentation of the ‘item’ to prevent
any possible product preference that may have caused bias by participants. Once the
templates had been generalized, they were separated into two distinct categories (see
Background), and then subcategories to match each of the areas for evaluation described
above prior to further alteration to ensure separation of contents and any subsequent
[image:40.612.102.507.365.587.2]cross-referencing of the items being evaluated in each.
Each individual graphic was then altered to match the specifications for the area
being evaluated (Table 9), and the contents were saved as a PNG7 image file for use
within the survey software.
Initial review of the graphics within the context of the survey software presented
the potential for participant confusion in determining which area of each graphic was
being evaluated, specifically when preference was evaluated for the presence or absence
of advertising, and the placement of both primary and secondary navigation. As the
issue could have resulted in random selection by participants vs. the desired intentional
selection, areas in the aforementioned e-commerce website representations that were not
being evaluated had an opaque layer applied to reduce their visual notability and place a
[image:41.612.100.548.432.636.2]small amount of added emphasis on the areas that were being evaluated.
Table 10: Example Specifications for Logo Evaluation
Logo size: 14206px 189x78 Logo Left
Width: 985px OR
Logo Center
Height: 1200 px 80x177 Logo Right
Background: #ffffff
Layout 2 Column
Prmary Nav: Top 52307.85px 985x55
Secondary Nav: Top
75492px 206x362
(left/right)
985x76 (top)
Advertising: 12078px 245x50
Featured
Products: 219441px 234x234 (4)
Co. Promotions: 219083px
Data Collection Objectives
The data collection objectives for this thesis were designed to evaluate the
hypothesis that “user preference for each variance may be generalized within global
demographic subsets” as applicable to structural variances within the websites utilized
for evaluation.
Data collection procedures as outlined below were designed to collect data to
support or reject the hypothesis for analysis regarding the nine core structural design
variables addressed in Evaluation of Existing Websites8, with specific support for
fine-grained analysis in the areas of demographic profiles and/or possible cultural variances
within grouped user preference.
Figure 12: Example Logo Evaluation Screen
8 Primary navigation, secondary navigation, company promotions, logo size, logo
Data Collection Procedures
Data for this study was collected using self-hosted survey software called
Limesurvey9. Limesurvey was chosen as the survey application for this research for its
flexibility- both in number of respondents, and question formatting. Limesurvey is also
open source, which provided the option of extending the survey tool, which was
determined as a necessity in order to alter graphic presentation formatting. Due to the
goal of this research providing a supporting structure for global preferences, a local or
strictly collegiate sample of research participants would not have yielded relevant
responses, and as such- no research participants for this study completed the study
in-person. Research participants were recruited from a large sample set using an online
research participant recruitment service10, with a recruitment message sent to 150
potential participants (Appendix B). Recipients of the recruitment message were
selected for potential inclusion to fulfill the following criteria:
1. Participants must be geographically diverse. The ideal locations for
participants involved in data collection for this Thesis consisted of (at a
minimum) participants from the following countries: United States,
China, Japan, Germany, India, Brazil, the United Kingdom, South Korea,
France, and Italy, as ranked by worldwide internet usage statistics
2. Participants must include a wide range of ages
3. Participants should be gender agnostic, with an ideal total collected
sample of equal percentages Men and Women
4. Participants should have a diverse yearly income as income directly
affects purchasing power, which was relevant to the data collection for
this study
Outside of the system-sent recruitment message, no participants were contacted
directly, and all participants who indicated willingness to participate were directed by
the recruitment message to proceed directly to the online survey software. Participants
arriving at the online study were first presented with a copy of the informed consent
document, after which upon agreement, they were directed to complete 4 distinct groups
of questions. Participants who did not agree to the informed consent document were
shown a page thanking them for their interest, and were not allowed to participate in this
study.
Question groups were separated into four primary sections, and inner questions
were carefully phrased and evaluated to remove any implied perception of preference by
the researcher, or any suggested action/selection by the participant. All individual
questions, and question group responses were also timed in milliseconds by the survey
software for analysis with regard to determinants of potential impulse purchase behavior.
Upon completion of the study, participants were invited to provide their email address in
order to be entered into a random drawing upon study completion. Any email addresses
provided were entered as distinct values not stored with actual participant data to ensure
User Profile Questions
Questions for this section were designed to gather core demographic information
on each participant. Questions covered only core demographics, and included: age,
gender11, primary language, current country of residence, highest level of education
received, current relationship status, current employment status, and current yearly
income5. The options and presentation of these questions within this section were based
on, and adapted from both the United Nations Statistics Division (UNSD) (United
Nations Statistics Division, 2014), and the United States Statistics Divisions (USSD)
(United States Census Bureau, 2010) information used to collect demographic profile
information on individuals globally. Only minimal adaptations were made to available
option format in order to present the data in a web-compatible format, including the
addition of “Other” selections where users were asked to make a choice from a select
menu, or where an alternate input may have been necessary or desired. Age selections
were presented in range format, with a minimum selectable range of 18-20, and a
maximum selectable range of “Over 85”. Yearly income selections were also presented
in range format with $9,999 ranges for each option; for example, “$20,000 - $29,999”,
with a minimum of “Under $10,000”, and a maximum of “Over $350,000”. Yearly
income, and gender selections included “Rather Not Say” in order to prevent the
possible exclusion of participation by users uncomfortable with providing their financial
information or gender determination.
Online Purchasing Related Questions
Questions created to evaluate individual high-level web behavior such as total
amount of time each participant had been an Internet user, how many hours each week
spent online, frequency of online purchases and average self-reported amount on a
per-online-purchase basis. Other questions in this question group were designed to evaluate
the frequency and types of websites and/or e-commerce sites most frequently used by the
participant. Responses for all questions in this section were provided in a fixed format
(Select menu, selection array, or radio button option), with the exception of “How often
do you buy things online” which did present an “Other” option to allow free-input.
Other questions were designed to evaluate individual types of online-behavior for
future analysis regarding potential non-purchase behavior preferences, and determine on
a more granular level how general internet usage ties into preference within the
structural preference evaluation questions. These questions included:
• “How long have you been using the internet (including web-based email,
shopping online, etc…)?”- Time range selection
• “How many hours did you spend on using the Internet last week?”- Time
range selection
• “Indicate how often you visited the following during the past month:”-
This option was presented as an array to evaluate types of websites
ranging from email providers to photo sharing sites, and allowed possible
selections of:
o Daily
o Weekly
o Monthly
o Yearly
o Never
• “How often do you buy things online?”- Time range selection
• “In the past year, what have you bought online?”- Multiple-selection
checkboxes (Figure 11)
• “On average, how much do you spend on a single online purchase?”-
Numeric input
Figure 13: Online Purchase Options
Preference Evaluation Questions
During the preference evaluation section of the study, respondents were
presented with twelve question screens, preceded by a ‘throw away’ preliminary
question screen used to demonstrate how subsequent question screens would be
Figure 14: Preparatory question instruction for participants
Each question screen presented participants with between three and six variations
of the graphics prepared to represent simulated websites12. As two distinct sets of
simulated websites were prepared, participants were presented with randomized variants
of each, however, only graphics for a single simulated website were presented on each
screen to prevent any possible confusion in the comparison of features. The order of all
graphics across all preference evaluation questions was also randomized to prevent
positional biases. All questions in this group followed a strict format, and all verbiage
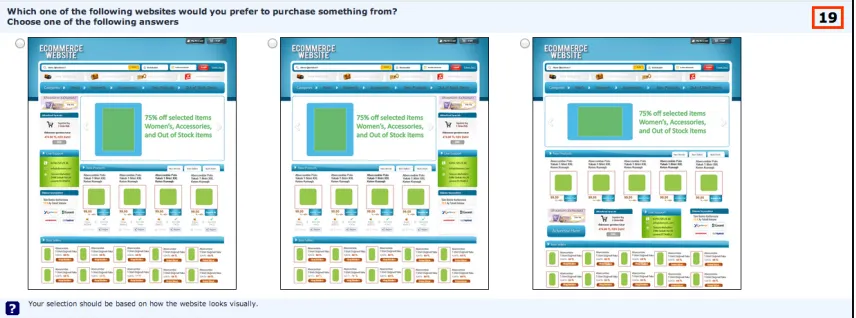
was the same across all questions. Each screen asked the user “Which one of the
following websites would you prefer to purchase something from?” and had no written
reference to which visual feature was being evaluated on each question screen. Help text
was added at the bottom of each question screen as a result of preliminary participant
questions which stated only, “Your selection should be based on how the website looks
visually,” as initially participants indicated product, price, and other feature seeking
behavior which was not desired for this study.
A prominent, bold-text, red-bordered box with a countdown timer was presented
on the top-right of all question screens for this section in order to reduce the time spent
by participants, and all question screens began with 30 seconds on the timer, however,
there was no penalty for failing to make a selection prior to the expiration of the timer.
The determination to add a countdown timer was based on observation of preliminary
in-person test participants13, and the otherwise extended durations spent on a per-question
basis as well as the acquisition of data to be used for impulsivity analysis. Average time
for selection across the question screens for preference evaluation was 15.908 seconds,
and is discussed in greater detail in the Pilot Study Results section.
Figure 15: Countdown Timer
The presentation of preference evaluation questions went through multiple
iterations before it was determined that the verbiage presented to users was clear enough
to be evaluated, and each question choice was able to be selected with minimal action on
the part of the participant. As only a single selection was allowed per screen group,
radio button selection options were the desired presentation, however, this initially
restricted the ease of preference selection by participants, as preliminary tests showed
13 In person test participant data was not used for evaluation, and was only used to refine
that users preferred to click the mouse cursor on the graphic as opposed to the radio
button, so additional custom JavaScript code was added to the survey software to enable
the expected behavior by participants. One-pixel wide solid black borders were also
added to all images to reduce the likelihood of any visual carryover between the
[image:50.612.103.531.257.416.2]selections shown on each screen (Figure 16).
Figure 16: Final format of preference evaluation screens
The preference evaluation section of the data collection was crucial to this
research, as in conjunction with the user profile data, it allowed for deeper analysis of
preferences based on each of the 8 demographic data points collected for each
participant, and each group of participants, and allowed for analysis to support or reject
the hypothesis of this research14.
14 1) Clearly identifiable aesthetic and structural constants exist within e-commerce
CHAPTER 4
DISCUSSION
At its core, the nature of this research was based on the theory that there are
distinct patterns and structures that may be evaluated15, and this was proven true. 93%
of all evaluated websites had logos or company names placed in the top left of the
website (Table 10), 81% presented primary navigation above other content (Table 11),
and 74% presented secondary navigation within close proximity to primary navigation
(Table 12). There was a wide spread of background colors used, with the majority being
solid white (51%), and another four with white variants. Additionally, 51% of all
analysis websites featured a two-column layout, while another 27% used only a single
column (Table 13). Overall, a minimal number of quantifiable variants for each section
of structural analysis were located throughout the analysis of existing and frequently
visited e-commerce websites, with or without specific regard to the countries of
popularity.
Table 11: Logo Locations
Logo Location: Count Sites Percentage
Left 40 43 93.02%
Right 0 43 0.0000%
Center 3 43 6.98%
15 Hypothesis 1: clearly identifiable structural design preferences exist within
Table 12: Primary Navigation Locations
Primary Navigation Location: Count Sites Percentage
Top 35 43 81.4%
Left 8 43 18.6%
Right 0 43 0%
Center 0 43 0%
Table 13: Secondary Navigation Locations
Secondary Navigation: Count Sites Percentage
Top 32 43 74.4%
Left 7 43 16.3%
Right 1 43 2.3%
Center 2 43 4.7%
Bottom 1 43 2.3%
Table 14: Layout Analysis
Layout (Columns) Count
Total
Sites: Percentage
1 column 12 43 27.9%
2 column 22 43 51.2%
3 column 8 43 18.6%
4 column 1 43 2.3%
The results of the analysis of existing e-commerce websites was also notable as
though an infinite number of possible structures, columns, and layout types may be
utilized, only a very select number of patterns were found to be implemented throughout
the evaluated websites. This supports the observation that "the difference between one
page design and another [...] falls in the subtle difference in type, layout, and color
properties" used in each site (Park, 2007), and may direct ideal patterns by designers
more toward adaptation within commonly used constraints.
The process of exploration within the field of web design, specific to structural
published on related topics such as how design affects task efficiency (Michalski et al.,
2006), how attitude toward usage affects actual usage (Van der Heijden, 2003), and the
creation of cultural models by which websites ‘may’ be designed (Jagne et al., 2004),
however, a more statistically based analysis of the features and their impacts within
existing e-commerce sites as it relates to demographic profiles was not located, and as
such was deemed to be a useful contribution to the field for the purposes of this research.
Pilot Study Results
A random sample of 20 participants16 was selected from a data set of 110
collected from participants, and consisted of ten US, and ten CA participants. After
preliminary examination of the data collected from all participants, several rows of data
were eliminated from possible analysis based on invalid or unusual patterns in data. For
example, the question regarding average self-reported purchase price per-e-commerce
purchase contained a value of $50,000 for a single user, whereas the average reported
single-transaction purchase price for all other participants ranged from $20 - $100.
After screening the available data from the pilot study results, it was determined
that only enough participants were available for selection and randomization from
Canada and the United States, as data was selected for usage based on quantity of
participants in country so that demographic profiles including country of residence could
be used for analysis with regard to preference.
After completion of initial data screening, 42 data sets from the United States
participants, and 41 data sets from Canadian participants were selected for
randomization. Randomization of participants was achieved by adding two columns to
separate spreadsheets containing responses for each country, populating the first new
column with Microsoft Excel’s “=RAND()” function, copying the values to the second
blank column, and sorting the values. After sorting by the randomized column values,
the top 10 rows of records were selected from each of the two country-specific data sets,
and moved to a new spreadsheet for further analysis.
It is important to note that the analysis of results within this Pilot Study are used
to show that the methodology will collect the necessary data to perform more advanced
analysis, and the pilot study was designed to evaluate connections between variables to
determine if a meaningful outcome could be analyzed in future studies based on the
structural design guidelines methodology.
Overview of Participant Demographics
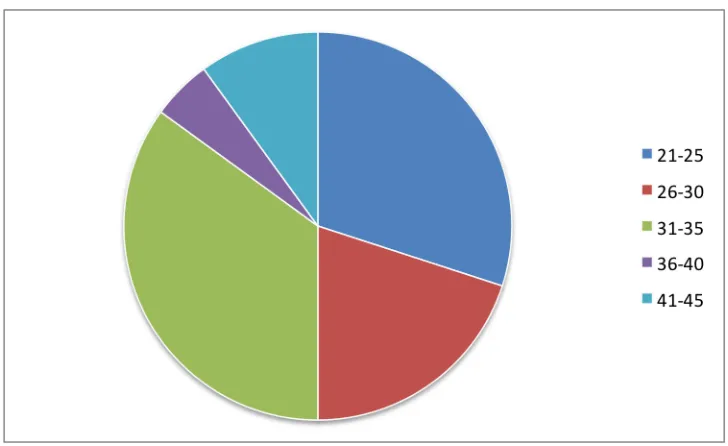
The pilot study data for analysis was composed of 10 Canadian participants, and
10 United States participants, with 9 male, and 11 female participants between the ages
of 21 and 45 (Figure 19). Eighteen of the twenty participants selected for analysis
indicated 7 or more years of experience using the Internet, while one participant
indicated less than 6 months, and one participant indicated 1-2 years. The reported
participant income was evenly distributed among selection options, with 30% reporting
Table 15: Reported Participant Income
Reported Income Number Percentage
Under $10,000 5 25%
$10,000 - $19,999 4 20%
$30,000 -$39,999 6 30%
$50,000 - $74,999 3 15%
$151,000 - $200,000 1 5%
Not Disclosed 1 5%
Of the selected sample, the average reported amount per individual online
purchase was $45.00, which was higher than expected, but consistent with other
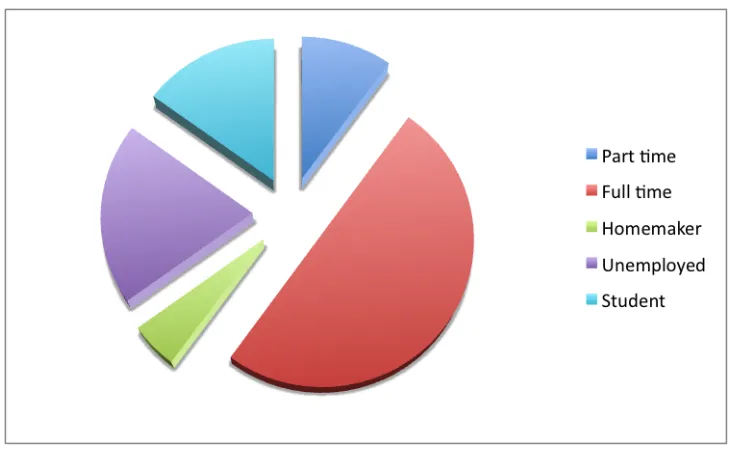
participant data that was not used for this analysis. 50% of the random sample also
indicated an employment status of full-time, which was also higher than expected,
although results were unknown as to the exact sample population based on the
recruitment method (Figure 17). Twelve of the twenty participants indicated a
relationship status of “Single”, with an additional 5 reporting “domestic partnership”
(Figure 18).
The recruited sample set did fulfill the criteria for data collection for the purposes
of a pilot study for this research with regard to age, income, and employment status;
however, the data collected did not fully fulfill the ideal sample population with regard
Pilot study data analysis was segregated into two distinct categories of analysis;
1) grouped preferential analysis, with no evaluation of demographic variables, rather
seeking total preference determinations, and 2) demographic preference analysis on a
per-profile basis.
[image:56.612.132.499.224.449.2]Figure 17: Reported Participant Employment Status
Figure 19: Reported Participant Ages
Grouped Preferential Analysis
Preliminary data analysis was performed on the pilot study data as a set,
evaluating the collective preference without any regard to demographic profiling. The
data set was tabulated for each of the following areas of preference analysis: 1) the
presence of advertising, 2) the layout of the website, 3) the location of primary
navigation, 4) the location of secondary navigation, and 5) the placement of the logo
within the top bar. The results are as follows:
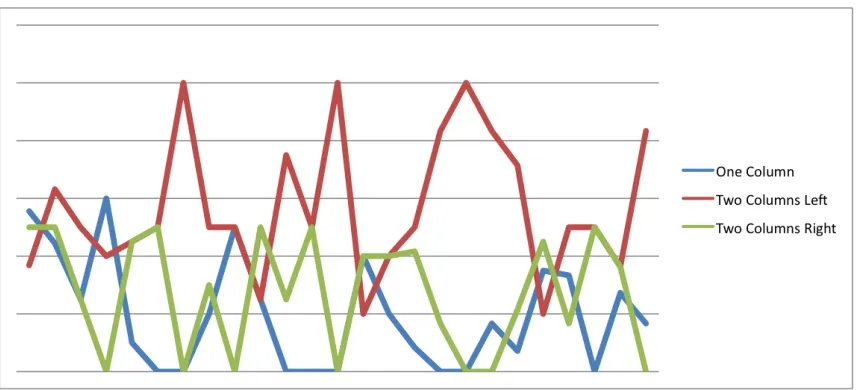
• 52.5% of users indicated a preference for the example e-commerce
website that did contain an advertising feature
• 47.5% of users indicated a preference for layout represented by a large
30% indicated preference for a large left column, and 22.5% were
preferential towards a single large column with no sidebar
• 50% indicated preference for a left aligned logo, while 30% selected right
aligned, and the remaining 20% selected centered logo as the preference
• 45% indicated preference for left aligned primary navigation, 30%
preferred top aligned primary navigation, and 25% preferred right aligned
primary navigation
• 52.5% indicated preference for left aligned secondary navigation, while
27.5% preferred top aligned, and 20% preferred right aligned navigation
The overall results of the grouped analysis show a preference for website that
does contain advertising, contains left column primary navigation with a large
right-aligned section for other website content, a left right-aligned logo, and left right-aligned secondary
navigation. As the grouped preference included both primary and secondary navigation
within the left column of the example websites, it could be inferred that the ideal
presentation of both navigation features would be either in a vertical nested arrangement,
or primary navigation above secondary navigation.
Demographic Results Analysis
This section will discuss the more specific analysis of actual statistics based on
demographic profiles, and is broken down into the following sections for more detailed