DELIVERY AND ACTIVATION OF CONTRAST AGENTS FOR MAGNETIC RESONANCE IMAGING
Thesis by Matthew John Allen
In Partial Fulfillment of the Requirements For the Degree of
Doctor of Philosophy
California Institute of Technology Pasadena, California
2004
ii
iii
This thesis is dedicated to my Mom for being my first and greatest teacher. She taught me by example to never stop learning and showed me the true importance of family. A source of unconditional and perpetual love and support, I am deeply sorrowed not to be able to share this experience with her.
iv
Acknowledgements
The work described in this thesis would not have been possible without help from many people. First, I thank my advisor, Tom Meade. Tom enabled me to follow my ideas wherever they led, even back and forth across the boundaries of chemistry and biology. His ability to provide space, funding, and intellectual support is surpassed only by his ceaseless positive perspective. There was rarely a conversation in his office that I didn’t leave inspired and excited to further my research. Tom is an excellent writer, and the writing skills that I acquired from him are invaluable. I would especially like to thank Tom for being understanding of difficult family situations. If I had to start graduate school again, I would choose Tom as an advisor without hesitation.
My second advisor, Scott Fraser, gave me numerous valuable suggestions during our discussions. I appreciate all of the reference letters you wrote for me. Thank you to the rest of my committee: John Bercaw, John Richards, and Harry Gray. It has been an honor to have such a renowned group of scientists on my committee.
not-so-v
witty conversation. Thank you, Jiyoun Lee, for introducing me to ham- n-jam sandwiches. My experiences would not have been as meaningful without the other members of the Meade group: Kylie Barker, Steve Bull, Paul Enders, Ying Song, Alisha Taylor, and Peijiao Wang.
Several good friends have left the Meade group during my tenure. Angie Louie taught me cell culture techniques and constructively critiqued my writing. I thank Brian Johnson for the tour of Heidelberg, our extreme bouts with nature, and the many trips to AM/PM. I’m glad you didn’t die in the desert. Carlo Quinonez gave me many good ideas and suggestions in the lab and memorable trips to Tijuana. I thank Jeremiah Miller for innumerable good times including swimming, lifting weights, and trips to Pat’s Liquor store. My experience would not have been the same without J. C. Olsen, Jeff Smith, and C. J. Yu.
vi
Dian Buchness, who deserves special thanks, particularly for helping me while on detached duty.
vii
Abstract
Magnetic Resonance Imaging (MRI) has become a powerful tool for noninvasive imaging of living specimens. Magnetic resonance contrast agents containing the paramagnetic ion gadolinium(III) are used to enhance regions, tissues, and cells that are magnetically similar but histologically distinct. To increase the effectiveness of contrast agents, agents responsive to biological phenomena and directed to specific regions need to be developed. These two improvements are related in that many biologically significant molecules are located in specific locations. Therefore, the design, synthesis, and testing of advanced contrast agents are described.
Many interesting biological targets for imaging reside inside the cell membrane. As the current generation of contrast agents is strictly extracellular, a method of intracellular delivery is required in the development of MRI contrast agents. I have developed cationic, polyarginine-oligomers to deliver gadolinium(III)-based contrast agents into the interior of cells. Delivery was confirmed and studied using methods including inductively coupled plasma-mass spectrometry, MRI, and two-photon laser microscopy to image lanthanide-based MRI contrast agents.
viii
Table of Contents
Acknowledgements iv
Abstract vii
Table of Contents viii
List of Figures, Schemes, and Tables xiii
Abbreviations xx
Chapter 1: Introduction 1
I. Introduction 2
A. Magnetic Resonance Imaging and Nuclear Spin Relaxation Processes 2
B. Classes of Contrast Agents 14
II. Contrast Agents for Diagnosis 15
A. Cancer 15
1. Gadolinium(III) DTPA and Its Derivatives 15 2. Manganese(II) and Iron Oxide Agents 19
B. Non-Cancer Diseases 20
1. Blood Pool- Related Diseases 20
2. Diseases of the Gastrointestinal Tract 22
3. Skeletal System Diagnosis 22
4. Other Diseases 23
III. Targeted Delivery of Contrast Agents 24
A. Contrast Agent Delivery 24
1. Gadolinium(III)-Containing Agents 24
ix
B. Penetrating the Blood Brain Barrier 26
IV. Imaging Biochemical Events 26
A. Enzymatically Activated Contrast Agents 27
B. Contrast Agents to Detect Biologically Significant Molecules 32
C. pH Sensitive Agents 42
V. Conclusions and Outlook 50
VI. Scope of Thesis 50
VII. References 53
Chapter 2: Synthesis, Visualization, and Delivery Properties of Polyarginine- Labeled Magnetic Resonance Imaging Contrast Agents 64
I. Introduction 65
II. Results 67
A. Synthesis and Physical Characterization 67
B. Cell Studies 72
1. Proliferation and Viability Assays 72
2. Two-Photon Laser Microscopy 73
3. T1 Studies 75
4. Concentration Effects 77
5. Incubation Time 79
6. Washout Studies 79
7. Cell Type Specificity 81
x
III. Discussion 86
A. Physical Characterization 86
B. Cell Studies 87
1. Proliferation and Viability Assays 87
2. Two-Photon Laser Microscopy 87
3. T1 Studies 90
4. Concentration Effects 91
5. Incubation Time and Washout Studies 93
6. Cell Type Specificity 94
C. MR Imaging 94
IV. Conclusion 94
V. Experimental Procedures 95
VI. References 103
Chapter 3: An MR Contrast Agent to Cross Cell Membranes, the Blood Brain
Barrier, and Label Aβ Plaques 106
I. Introduction 107
II. Results 111
A. Synthesis 111
B. Partition Coefficients 111
C. Relaxivities 114
D. UV-Visible and Fluorescence Spectroscopy 114
xi
2. Fluorescence Spectroscopy 114
E. Dynamic Light Scattering 118
F. Cell Studies 119
1. Viability Assays 119
2. Concentration Effects 119
3. Incubation Time 123
4. Washout Studies 123
5. Blood Brain Barrier Model 126
G. Brain Slices 129
III. Discussion 132
A. Synthesis and Physical Properties 132
1. Relaxivities 133
2. Aggregate Sizing 134
3. UV-Visible and Fluorescence Spectroscopy 138
B. Cell Studies 139
1. Viability Assays 139
2. Concentration Effects 139
3. Incubation Time and Washout Studies 140
4. Blood Brain Barrier Model 140
C. Comparison with Polyarginine Cell Culture Properties 142
D. Brain Slices 143
IV. Conclusion 144
xii
VI. Experimental Procedures 146
VII. References 151
Chapter 4: Towards a Matrix Metalloproteinase Sensitive Contrast Agent 154
I. Introduction 155
II. Results and Discussion 157
A. Design and Synthesis 157
B. Determination of q Values 162
C. Aspartic Acid Model Complexes 164
D. Proposed Binding of Amide Carbonyl 169
III. Conclusion 172
IV. Future Directions 172
V. Experimental Procedures 174
xiii
List of Figures
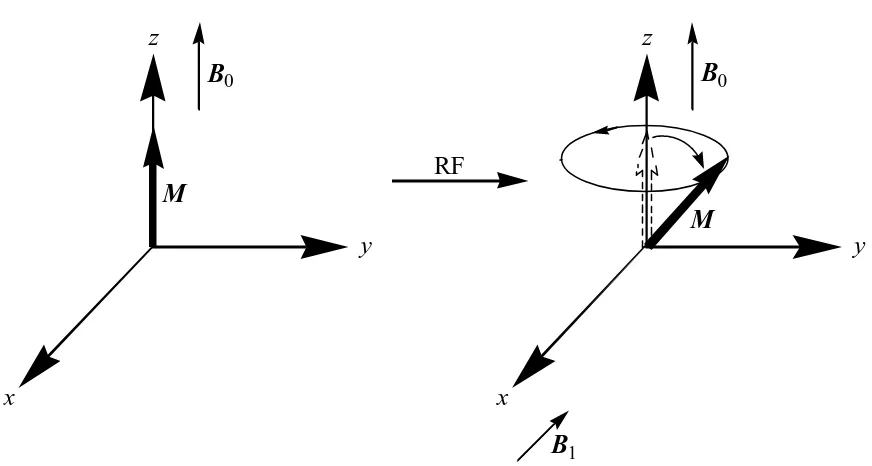
Figure 1.1 Schematic of hydrogen nuclei before and after being placed 4 in a magnetic field B0. Top: Nuclei are randomly oriented
before exposure to B0, then align with and precess about B0
at the Larmor frequency, ωL, after placement in B0. Bottom:
Slightly more spins occupy the lower energy state leading to a net magnetization vector, M.
Figure 1.2 Schematic depicting the behavior of the net magnetization 5 vector, M, upon exposure to an RF pulse. The RF pulse
generates a magnetic field B1 that causes M to flip away
from the z-axis and revolve about B0 in an xy-plane.
Figure 1.3 MRI images of the brain: (a) T1-weighted image; (b) 8
proton-density weighted image; (c) T2-weighted image.
Image reproduced with permission from Reference 1.
Figure 1.4 Positive-contrast enhancement in a brain lesion obtained by 9 using a T1-weighted sequence and a T1 contrast agent: (a)
pre-contrast; (b) post-contrast–the bright ring is the area enhanced with contrast agent. Image reproduced with permission from Reference 1.
Figure 1.5 Schematic depicting the interactions of water molecules 13 with a gadolinium(III) based contrast agent. The five
variables shown have an influence on r1.
Figure 1.6 Common MRI ligands used to coordinate paramagnetic 16 metal ions.
Figure 1.7 MRI contrast agent activated by β-galactosidase. 29 Figure 1.8 DTPA-based carbonic anhydrase sensitive contrast agent 30
(ligand only).
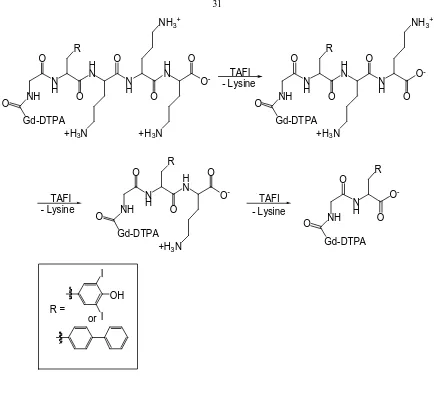
Figure 1.9 Contrast agent sensitive to TAFI. 31
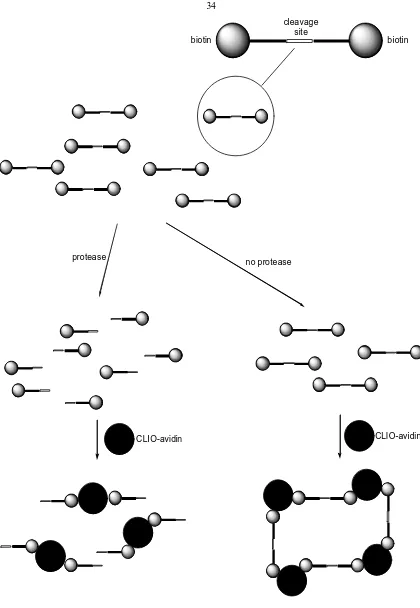
Figure 1.10 Contrast agent that detects DNA cleaving agents. 33 Figure 1.11 CLIO-based contrast agent that is sensitive to the presence 34
of proteases.
xiv
Figure 1.14 Contrast agent that differentiates between oxygenated and 38 deoxygenated hemoglobin (ligand only).
Figure 1.15 Contrast agent that detects specific DNA sequences. 40 Figure 1.16 Contrast agent specific for zinc(II). 41 Figure 1.17 CEST contrast agent (ligand only) sensitive to L- lactate. 43 Figure 1.18 Schematic representation of a liposome based radical- 44
responsive MRI contrast agent.
Figure 1.19 Contrast agent sensitive to pH based on a polyion complex 45 composed of a mixture of two polymers.
Figure 1.20 Contrast agent sensitive to pH based on a squaric ester 46 containing polymer (ligand only).
Figure 1.21 Contrast agent sensitive to pH based on a phosphate 48 containing DOTA derivative (ligand only).
Figure 1.22 Contrast agent sensitive to pH based on ampiphilic 49 molecules (ligand only).
Figure 1.23 Contrast agent sensitive to pH based on CEST effects 51 (ligand only).
Figure 2.1 Schematic of hypothesized mechanism of trans- membrane 68 polyarginine delivery. Inset: Chemical structure of the
putative bidendate hydrogen-bonding interacting proposed between the guanidine headgroup of arginine and the phosphates present in lipid bilayers.
Figure 2.2 Two-photon laser microscopy image (λEX = 750 nm) of 74
NIH/3T3 cells, A: untreated control where signal is due to autofluorescence of the cells, B: cells incubated with 11 for one hour and rinsed prior to imaging, and C: cells
incubated with 9 for one hour and rinsed prior to imaging.
Figure 2.3 Results of T1 study of NIH/3T3 cells incubated with 0.3 mM 78
4, 5, 6, and gadolinium(III) DO3A (1,4,7-tris-carboxy- methyl-1,4,7,10-tetraazacyclododecane). After incubation cells were rinsed with DPBS. T1 values were measured at
60 MHz and 37 °C. The graph depicts the percent change in T1 from untreated NIH/3T3 cells. Error bars represent
xv
Figure 2.4 Demonstration of the dependence of uptake of 4-6 on 80 incubation concentration. After incubation, NIH/3T3 cells
were rinsed with DPBS, treated with trypsin, dissolved in nitric acid, and analyzed with ICP-MS. The graphs show uptake per cell plotted against incubation concentration. Error bars represent one standard deviation.
Figure 2.5 Washout rate of 4-6 from NIH/3T3 cells as a function of the 82 number of rinses. Cells were incubated for one hour and
then medium was changed. After each rinse period the medium was removed and analyzed using ICP-MS. Long incubation times were 24, 48, 72, and 96 hours. Short incubation times were 1, 3, 6, and 10 hours. Error bars represent one standard deviation.
Figure 2.6 Cell type specificity for 7-9. Cells were incubated with 84 compound for one hour and rinsed with DPBS, treated with
trypsin, dissolved in nitric acid, and analyzed with ICP-MS. The graph shows uptake per cell for each cell type plotted against complex. Incubation concentration of 7-9 was constant within each group of cells, but was not constant from compound to compound. Error bars represent one standard deviation.
Figure 2.7 T1-weighted spin-echo MR images of NIH/3T3 cells at 9.4 85
T. Images were obtained using a spin-echo pulse sequence with TR 500 ms, echo delay time (TE) 16 ms: (A) NIH/3T3 cells incubated with 4, (B) Untreated NIH/3T3 cells, (C) Deionized water in a capillary tube as a spatial marker. The scale bar represents 1.2 mm.
Figure 2.8 Schematic demonstrating the difference between the 88 absorption of one and two photons of light leading to
fluorescence in single-photon or two-photon laser microscopy, respectively.
Figure 2.9 Molecular orbital diagram for europium(III) and 89 gadolinium(III) demonstrating the large energy difference
needed to excite gadolinium(III) (273 nm) versus
europium(III) (375 nm). Figure modified from reference 7.
Figure 2.10 Schematic of ICP-MS: Liquid samples are sent through a 92 nebulizer, atomized by the argon plasma, and detected using
xvi
Figure 3.1 Chemical structures of compounds that bind to Aβ plaques: 110 Congo Red, Chrysamine G, Thioflavin S, BSB, and
styrylbenzenes.
Figure 3.2 Dianionic (1), monoanionic (2), and neutral (3) versions of 112 the amyloid targeting MRI contrast agent.
Figure 3.3 Excitation and emission spectra for 1-3. 117 Figure 3.4 A representative autocorrelation function from dynamic 120
light scattering of 1 in MOPS buffer.
Figure 3.5 Dynamic light scattering results showing the size of 121 aggregates at various concentrations in 10% Pluronic F-127
and MOPS buffer.
Figure 3.6 Dynamic light scattering results showing the size of 122 aggregates at various concentrations in 10% Pluronic F-127.
Figure 3.7 Demonstration of the dependence of uptake of 1 on 124 incubation concentration. After incubation, NIH/3T3 cells
were rinsed with DPBS, treated with trypsin, dissolved in nitric acid, and analyzed with ICP-MS. The graph shows uptake per cell plotted against incubation concentration. Error bars represent one standard deviation.
Figure 3.8 Demonstration of the dependence of uptake of 1 on 125 incubation time. After incubation, NIH/3T3 cells were
rinsed with DPBS, treated with trypsin, dissolved in nitric acid, and analyzed with ICP-MS. The graph shows uptake per dish plotted against incubation concentration. Error bars represent one standard deviation.
Figure 3.9 Washout rate of 1 from NIH/3T3 cells as a function of the 127 number of rinses. Cells were incubated for one hour and
xvii
Figure 3.10 Schematic of cell culture well and insert used in BBB model 128 experiment. The base of the insert is a 0.45 mm filter coated
with type 1 rat tail collagen. bMVEC-B cells formed a monolayer over the filter. Contrast agent was added to the insert, and samples of medium were taken from the bottom chamber and analyzed for gadolinium content using ICP-MS.
Figure 3.11 Results of BBB model experiment testing the ability of 130 compounds 1-3, and 6 to permeate the BBB. The graphs
depict the concentration of gadolinium that had crossed the BBB model versus time. Cells were incubated with 3 mM compound in modified EBM-2 medium (top) and modified EBM-2 medium saturated with Pluronic F-127 (bottom).
Figure 3.12 Fluorescence microscopy images of brain slices exposed to 131 complexes 1 and 2. Top: Sections of hippocampus (left)
and midbrain (right) from a PDAPP mouse that were treated with 1. Bottom: Sections of a PDAPP mouse brain that were treated with 1 (left) or 2 (right).
Figure 3.13 Schematic of the proposed explanation for the high 135 relaxivity values caused by an increase in τr resulting from
aggregation. The hydrophobic region of the agents
aggregate leaving the hydrophilic chelates exposed to water. The formation of the large aggregate would slow the
molecular tumbling rate and lead to increased relaxivity values.
Figure 3.14 Structure of Pluronic F-127. 137
Figure 3.15 bMVEC-B cells day 3-4 after confluence. Stained with 141 anti ZO-1, showing tight junctions (bright green). Blue is
the nuclear stain DAPI.
Figure 4.1 Structure of β-galactosidase responsive contrast agent (Top), 158 and MRI of capillary tubes containing the contrast agent and
either active or inactive enzyme (Bottom).
Figure 4.2 Structure of proposed MMP responsive MRI contrast agent. 159 Figure 4.3 Model complexes representing MMP responsive contrast 161
xviii
Figure 4.4 Vibrational quenching of europium(III) emissive state by 165 water. An offset has been applied so that the lowest
vibrational level of OH/OD is shown at the same energy as the highest level of the ground-state manifold of the europium(III) ion. No anharmonicity is assumed in the vibrational ladder, with νOH = 3405 cm-1 and νOD = 2520
cm-1. Figure modified from reference 7.
Figure 4.5 Sample fluorescence decay measurements used to 167 determine values of q. Top graph: Fluorescence
lifetime decay measurement in H2O at 594 nm.
Bottom graph: Fluorescence lifetime decay measurement in D2O at 594 nm. Right: Sample calculation to determine
value of q.
Figure 4.6 Chemical structures of a series of aspartic acid modified 168 europium(III) chelates.
Figure 4.7 Proposed binding of peptide modified DOTA. 171 Figure 4.8 Structure of target bridged complex in which a caspase 173
cleavable peptide is held over the free
coordination sites of gadolinium(III). Upon exposure to caspase the peptide should be cleaved allowing for water access to the gadolinium(III) ion and a subsequent increase in q.
List of Schemes
Scheme 2.1 Synthesis of polyarginine containing lanthanide chelates: 69 (a) (1) Piperidine, DMF (2) Fmoc-R(Pbf)-OH, HATU, DMF,
DIPEA; (b) (1) Piperidine, DMF (2) DOTA(tris-t-bu ester), HATU, DMF, DIPEA (3) 95% TFA, 2.5% H2O, 2.5% TIS;
(b) Eu(OH)3 or Gd(OH)3 in water at 80 ºC for 12 hours.
Scheme 3.1 Synthetic route to the dianionic (1), monoanionic (2), and 113 neutral (3) versions of Aβ targeting MRI contrast agents.
Scheme 3.2 Proposed synthesis of a contrast agent conjugated to 145 styrylbenzene via a dithiol linker for extending intracellular
lifetime. (a) N-succinimidyl-3-(2-pyridyldithio)propionate, 0.1M pH 7.4 phosphate buffer, DMSO; (b) Gd(OH)3, 80
0.2°C; (c) (1) NaNO2, HCl, 0 °C, (2) KS2COEt, 65 °C, (3)
xix
Scheme 4.1 Synthesis of europium(III) chelates modified with peptides: 163 (a) i. Piperidine, DMF, ii. DOTA(tris-t-bu ester), HATU,
DMF, DIPEA, iii. TFA cleavage cocktail; (b) Eu(OH)3,
H2O, ∆.
List of Tables
Table 2.1 Relaxivity values and octanol- water partition coefficients 71 measured for 4, 5, and 6. Relaxivity measured at 59.97
MHz, and 37 °C in 10 mM MOPS, 100 mM NaCl, 20 mM NaHCO3, and 4 mM NaH2PO4 at pH 7.41. Values for
partition coefficients are plus or minus one standard deviation.
Table 2.2 Results of T1 study of NIH/3T3 cells incubated with 0.3 mM 76
6, 10, and untreated cells. After incubation cells were rinsed with either fresh modified DME medium or DPBS. T1
values were measured at 60 MHz and 37 °C. Units for T1
are s.
Table 3.1 Physical properties of 1-3 including molecular charge, 115 Poct/wat, and r1 in pH 7.41 MOPS buffer and 10% Pluronic
F-127.
Table 3.2 UV-visible and fluorescence properties of 1-3 including 116 molar absorptivity (ε) in 10% Pluronic F-127 and MOPS
buffer, fluorescence quantum yield, λEM, and λEX.
Table 4.1 Values of q measured for the peptide-contrast agent 166 conjugates 1-6.
xx
Abbreviations
Abbreviation Name
AD Alzheimer’s disease
APP amyloid precursor protein ASL analytical services laboratory ATCC American type culture collection BBB blood brain barrier
BCS bovine calf serum
bMVEC-B primary bovine brain microvascular endothelial cells CEST chemical exchange saturation transfer
CLIO cross- linked iron oxide
CT computed tomography
DME Dulbecco’s modified Eagle’s
DMEM Dulbecco’s modified Eagle’s medium DPBS Dulbecco’s phosphate buffered saline EMEM Eagle’s minimal essential medium ESI electrospray ionization
FBS fetal bovine serum
GI gastrointestinal
HIV human immunodeficiency virus
HSA human serum albumin
xxi
Abbreviation Name
MAb monoclonal antibody
MALDI- TOF matrix-assisted laser desorption ionization time of flight MDCK canine kidney epithelial cells
MION magnetic iron oxide nanoparticle MMP matrix metalloproteinase
MR magnetic resonance
MRamp magnetic resonance signal amplification MRI magnetic resonance imaging
NIH/3T3 mouse fibroblast cells
PAMAM polyamidoamine
PBS phosphate buffered saline PET positron emission tomography
PD platelet derived
PPMAL protein/peptide microanalytical laboratory RAW 264.7 mouse macrophage cells
RF radiofrequency
RIME receptor- induced magnetization enhancement SPECT single photon emission computerized tomography SPIO superparamagnetic iron oxide
TE echo delay time
TPLM two-photon laser microscopy
xxii
Abbreviation Name
USPIO ultrasmall superparamagnetic iron oxide
UV ultraviolet
Symbol Definition
A UV-Vis absorption
Β0 magnetic field vector B1 RF generated field
c the molal concentration of contrast agent
e molar absorptivity
? fluorescence quantum yield g the electron g- factor
γI the nuclear gyromagnetic ratio
h Planck’s constant
? Refractive index
I spin quantum number equal to ½ for the hydrogen atom I integrated area under the fluorescence emission peak
O D
k
2 rate of luminescence decay in D2O
O H
k 2
rate of luminescence decay in H2O
λEM maximum emission wavelength λEX maximum excitation wavelength
xxiii
Symbol Definition
µB the Bohr magneton
Poct/wat octanol-water partition coefficient
q the number of bound water molecules per paramagnetic ion rGdH the electron spin – proton distance
S the spin of the paramagnetic ion
T1e the longitudinal electron spin relaxation time of the metal ion
T2e the transverse electron spin relaxation time of the metal ion τm
the mean lifetime of water molecules in the innersphere environment
τr
the rotational correlation time or the reorientational correlation time of the metal-proton vector
?I the nuclear Larmor frequency
?L the Larmor frequency
?S the electron Larmor frequency
Abbreviation(s) Name Structure
A (Ala) alanine +H3N O
-O
A adenine
N N N N NH2 O OH HO BOPTA 3-benzyloxy-2-[(2-{[2-(biscarboxy- methyl-amino)ethyl]carboxymethyl-
amino}ethyl)carboxymethylamino]-propionic acid N
N N HO2C
HO2C
CO2H
CO2H
xxiv
Abbreviation(s) Name Structure
BSB
(trans,trans)-1-bromo-2,5,bis-(3-hydroxycarbonyl-4-hydroxy)styryl-
benzene HOOC
H O
COOH OH B r
C cytosine
O OH HO N N NH2 O
D (Asp) aspartic acid
+H3N O -O
O O
-DIPEA diisopropylethylamine N
DMF dimethylformamide
O N H
DMSO dimethylsulfoxide
S O
DO3A
1,4,7,10-tetraazacyclododecane-1,4,7-trisacetic acid N
N HN
N HO2C
CO2H
HO2C
DO3AB
1,4,7,10-tetraazacyclododecane-1-(2,3-
dihydroxy-1-hydroxymethylpropyl)-4,7,10-trisacetic acid N
N N N HO2C
CO2H
HO2C
OH OH OH DO3A(tris-t-Bu ester)
1,4,7-tris-tert-butoxycarbonylmethyl-1,4,710-tetraazacyclododecane N
xxv
Abbreviation(s) Name Structure
DOTA
1,4,7,10-tetraazacyclododecane-1,4,7,10-tetraacetic acid N
N
N N HO2C
CO2H
CO2H HO2C
DOTA-p-NH2
-anilide
1,4,7,10-tetraazacyclododecane-1-(4-
aminophenylcarbamoylmethyl)-4,7,10-trisacetic acid N N
N N O HO O OH O HN O H O NH2 DOTA(tris-t-Bu ester) 1,4,7,10-tetraazacyclododecane-1,4,7-tris(acetic acid-tert-butyl ester)-10-acetic
acid N
N N N O O O O O O O OH
DPDP dipyridoxal diphosphate
N OH H2O3PO N N
N OPO3H2
HO CO2H
HO2C
DTPA diethylenetriaminepentaacetic acid HO2C N N N HO2C
CO2H CO2H
CO2H
DTPA-BMA
{bis-[2-(carboxymethylmethyl- carbamoylmethylamino)ethyl]amino} acetic acid
N N N CO2HHO2C
CO2H
H N H N O O DTPA-BMEA [bis-(2-{carboxymethyl-[(2-methoxy- ethylcarbamoyl)methyl]amino}ethyl)-amino]acetic acid
N N N CO2H
HO2C CO2H H N H N O O O O EOB-DTPA {[2-(biscarboxymethylamino)-3-(4-ethoxyphenyl)propyl]-[2-(biscarboxy-
methylamino)ethyl]amino}acetic acid N
N N HO2C
HO2C
CO2H
CO2H
CO2H
xxvi
Abbreviation(s) Name Structure
G guanine
NH N N O NH2 N O OH HO
G (Gly) glycine +H
3N
O -O
HATU
O-(7-azabenzotriazol-1-yl)-1,1,3,3-tetramethyluronium hexafluorophosphate N N O+ N N N N P -F F F F F F
HPDO3A
1,4,7,10-tetraazacyclododecane-1-hydroxypropyl-4,7,10-trisacetic acid N
N
N N HO2C
CO2H
HO2C
OH
L (Leu) leucine
+H3N
O -O
M (Met) methionine
+H3N
O -O
S
MOPS 3-(N-morpholino)propane sulfonic acid
O N S O O HO
xxvii
Abbreviation(s) Name Structure
MTT 3-(4,5-dimethylthiazolyl-2)-2,5-diphenyl- tetrazolium bromide
N N+N
N S N
Br
-p-NH2-Bz-DOTA
2-p-aminobenzyl-1,4,7,10-tetraazacyclo- dodecane-1,4,7,10-tetraacetic acid N N N N O OH O HO O HO O OH
N H2
p-NH2-Bz-DTPA p-aminobenzyldiethylenetriaminepenta-
acetic acid N N N
O OH O HO O OH O OH O OH NH2
P (Pro) proline HN O
-O
R (Arg) arginine
+H3N O -O
HN NH2+ H2N
T thymine
O OH HO N NH O O
TFA trifluoroacetic acid
O HO
F F F
TIS triisopropylsilane Si
xxviii
Abbreviation(s) Name Structure
TPPS 5,10,15,20-tetrakis(
p-sulfonatophenyl)-porphyrin N
NH N
HN S O3
-SO3
-S O3
--O3S
W (Trp) tryptophan
+H3N O -O
Chapter 1
Introduction
The text of this chapter was taken in part from the following manuscripts:
Introduction
This chapter focuses on the wide range of chemical and biological applications that exist for magnetic resonance imaging (MRI) contrast agents. It begins with an introduction of how MRI and contrast agents function followed by a review of both clinical and experimental uses for MRI contrast agents. A description of the targeted delivery of contrast agents including how they bind to and accumulate in specific biological tissues is then presented. Finally, the new class of bio-activatable MRI contrast agents is described. These agents respond to biological phenomena by altering the intensity of observed signal in a conditional fashion.
Magnetic Resonance Imaging and Nuclear Spin Relaxation Processes
MRI has become an extremely important tool for clinical diagnosis of disease and for noninvasive imaging of three-dimensional opaque objects. MRI is based on the same principles as NMR spectroscopy. The work in this thesis deals exclusively with the hydrogen nucleus, as does the majority of MRI, so the following description of MRI pertains to the hydrogen nucleus. This explanation is easily extended to encompass other nuclei with nuclear spin quantum numbers equal to ½. For an introduction into the use of other nuclei in MRI, see chapter one of The Chemistry of Contrast Agents in Medical Magnetic Resonance Imaging edited by Merbach and Toth.1
hydrogen nucle us will precess about B0 at the Larmor frequency, ωL, in a discrete
direction relative to B0 (Figure 1.1). With a spin of ½, only two directions are quantum
mechanically allowed for the hydrogen nucleus. These two directions correspond to energy levels of the nucleus. A nucleus can change energy states, but in order to move to a higher energy level, energy in the form of electromagnetic radiation needs to be supplied. Electromagnetic radiation in the radiofrequency (RF) range, of frequency (h/2p)ωL, is of the correct energy to initiate this excitation.
Equation 1.1:
(
1)
2 +
= h I I
π I
On a bulk scale, proton nuclear spins are distributed between the two allowed states according to a Boltzmann distribution, which is dependent on temperature and the energy difference between the allowed states. For hydrogen, the two energy states are spin ‘up’ (low energy) and spin ‘down’ state (high energy). The Boltzmann distribution shows that slightly more spins occupy the lower energy state leading to a net magnetization vector, M, that is the sum of all of the spins. RF pulses can be applied to generate a magnetic field perpendicular to B0. This RF generated field, B1, causes the
spins to flip away from the z-axis and gain x- and y-components (Figure 1.2). Conventionally, the magnetic field B0 is aligned with the z-axis. This precessing about
the z-axis in an xy-plane generates a detectable alternating RF field.
At the end of the applied RF pulse, the B1 field ceases to exist and the nuclear
ωL
ωL
ωL ωL
ωL
ωL
ωL
B0
ωL
ωL
ωL
ωL
ωL B0
x
y z
B0
x
y z
[image:32.612.146.503.66.612.2]M Apply Magnetic Field
Figure 1.1: Schematic of hydrogen nuclei before and after being placed in a magnetic field B0. Top: Nuclei are randomly oriented before exposure to B0, then align with and
precess about B0 at the Larmor frequency, ωL, after placement in B0. Bottom: Slightly
B0
B1
x
y z
M B0
x
y z
M
[image:33.612.107.543.64.297.2]RF
Figure 1.2: Schematic depicting the behavior of the net magnetization vector, M, upon exposure to an RF pulse. The RF pulse generates a magnetic field B1 that causes M to
in the xy-plane diminishes. The time necessary for disappearance of this current can be measured and is termed the relaxation time. Relaxation times of a sample are measured and used to produce an image in MRI.
Relaxation is described in two parts: spin- lattice relaxation and spin-spin relaxation. In spin- lattice relaxation, the z-component of M retur ns to equilibrium as characterized by a time constant T1; while in spin-spin relaxation, the x- and
y-components of M return to zero with a time constant T2. Spin- lattice and spin-spin
relaxation are often referred to as T1 and T2 relaxation, respectively.
T1 relaxation occurs due to magnetic field fluctuations at the Larmor frequency
brought about by the random motions of molecules in the surrounding medium (lattice). These molecules in motion each have magnetic moments, and the movement of these moments leads to a magnetic ‘noise’ that encompasses a broad frequency range including the Larmor frequency. Magnetic noise at the Larmor frequency will stimulate transition to the lower energy state.
T2 relaxation occurs via fluctuations of a magnetic field caused by the random
motion of molecules resonating at the same frequency. Fluctuation in the individual proton spins leads to a loss of phase coherence in the xy-plane with no net loss of energy from the system. Spin-spin relaxation is additionally affected by dephasing arising from bulk inhomogenities in B0.
for mapping of spatial positions to frequencies. Mathematical transformations are performed to produce images from the spatially encoded data.1,2
Contrast in MR images is achieved based on differences in T1, T2, and proton
density within a sample. Using different RF pulse sequences, image intensity can be weighted with respect to T1, proton density, or T2 (Figure 1.3). Inherent contrast can be
improved with the use of paramagnetic contrast agents (Figure 1.4). Most contrast agents reduce T2 and T1. Agents are classified as T1 if they shorten T1 more than T2, and
T2 if they affect T2 more than T1. The ability to reduce T1 and T2 relaxation times is
described by the concentration normalized relaxivity values r1 and r2, respectively. Work
with T1 agents is presented in Chapters 2–4 of this thesis, so a detailed description of only
T1 agents will be presented. For more information on T2 contrast agents see chapter two
in The Chemistry of Contrast Agents in Medical Magnetic Resonance Imaging.1
Contrast agents contain paramagnets, which have one or more unpaired electrons; the most common agents contain the lanthanide ion gadolinium(III). Because the work described in this thesis deals exclusively with gadolinium(III)-based contrast agents, the following theoretical description of relaxivity will pertain solely to gadolinium(III)-containing contrast agents. Paramagnetic relaxation of water protons originates from dipole-dipole interactions between the nuclear spins of the hydrogen nuclei of water molecules and the fluctuating local magnetic field caused by the spins of the unpaired electrons. The effect is a decrease in T1 that falls off strongly with distance.
Detailed theory about the relaxivity properties of paramagnetic contrast agents is contained in the Solomon-Bloembergen equations. Observed T1 is due to a combination
Figure 1.3: MRI images of the brain: (a) T1-weighted image; (b) proton-density
weighted image; (c) T2-weighted image. Image reproduced with permission from
Figure 1.4: Positive-contrast enhancement in a brain lesion obtained by using a T1
-weighted sequence and a T1 contrast agent: (a) pre-contrast; (b) post-contrast–the bright
paramagnetic species (Equation 1.2). The term 1/T1p can be written as the product of the
relaxivity, r1, and the concentration of the contrast agent, [Gd] (Equation 1.3). This term
is composed of an inner sphere and an outer sphere term (Equation 1.4). The inner sphere term describes the relaxation of the hydrogen nuclei of water molecules directly bound to the paramagnetic ion, while the outer sphere term accounts for interactions between paramagnetic ions and closely diffusing water molecules. The relaxation of current clinically approved agents is due to approximately 60% inner sphere and 40% outer sphere effects.1 Inner sphere effects can be modified whereas outer sphere effects cannot easily be affected.
Equation 1.2:
p d
obs T T
T1 1 1
1 1 1
+ =
Equation 1.3: r
[ ]
Gd TT1obs 1d 1
1
1 = +
Equation 1.4: r1 =r1IS +r1OS
The inner sphere term can be broken down further as in Equation 1.5, where c is the molal concentration of contrast agent, q is the number of bound water molecules per paramagnetic ion, τm is the mean lifetime of water molecules in the inner sphere
environment, and 1/T1m is the longitudinal proton relaxation rate. The term 1/T1m is
experimental MR images are acquired at field strengths higher than 10 MHz, the scalar term is not an important factor in proton relaxatio n, thus 1/T1m is essentially determined
by the 1/T1DD term. The dipole-dipole term is modulated by reorientation of the nuclear
spin vectors with respect to the electron spin vector, changes in orientation of electron spin, and the rate of water exchange. This term is described in Equation 1.7 where γI is
the nuclear gyromagnetic ratio, g is the electron g- factor, µB is the Bohr magneton, rGdH is
the electron spin – proton distance, S is the spin of the paramagnetic ion, ωS is the
electron Larmor frequenc y, ωI is nuclear Larmor frequency, and τc is the correlation time
described by Equation 1.8. The τc term is composed of τm; the rotational correlation
time that is the reorientational correlation time of the metal-proton vector, τr; and the
longitudinal and transverse electron spin relaxation times of the metal ion, T1e and T2e,
respectively. Equation 1.5:
(
)
+ = m m IS T cqT1 1 τ
1 5
. 55 1
Equation 1.6: DD SC
m T T
T1 1 1
1 1
1 = +
Equation 1.7:
(
)
+ + + + = 2 1 2 1 2 2 2 2 6 2 2 2 1 1 3 1 7 1 15 2 1 c I c c S c GdH B I
DD r S S
g
T ω τ
τ τ ω τ µ γ
Equation 1.8: 1 = 1 + 1 + 1 ,i=1,2
Tie m
r
ci τ τ
The theory of T1 contrast agents demonstrates that numerous parameters affect
relaxivity (Figure 1.5). The parameters q, rGdH, τm, τr, and T1e can be adjusted by altering
the chemical environment around the paramagnetic ion.3 By increasing the value of q, the relaxivity of the agent will increase. Increasing q above two will most likely result in increased toxicity due to decreased stability of the complex. A decrease in rGdH will lead
to an increase in relaxivity. Decreasing the term τm will allow more water molecules to
be affected by the gadolinium(III) ion resulting in an increase in relaxivity. If the value of τm is decreased too much, the relaxivity of a complex will begin to decrease because
the lifetime of the water molecules bound to the gadolinium(III) ion will not be long enough to influence the relaxation of the protons of the water molecule. By optimizing the value of τr or T1e, the relaxivity of the contrast agent will be increased. There is an
interdependence of the terms τm, τr, and T1e. For most small molecule gadolinium(III)
complexes, τr is the limiting of the three variables. As the value of τr becomes optimized
the variables τm and T1e begin to influence the relaxivity of the contrast agents. These
parameters can be exploited to create activatable contrast agents that are discussed later in this chapter, and the use of a q modulating contrast agent is examined as a means to detect protease activity using MRI in Chapter 4.
Gd
3+H
2O
H
2O
H
2O
H
2O
H
2O
H
2O
H
2O
H
2O
τ
mτ
rr
GdHH
2O
[image:41.612.108.541.59.642.2]q
(
T
1e)
computed tomography (X-ray CT), approximately 1 mm.5 Where higher fields are employed, resolution on the order of cells (~10 µm) has been reported.6 Due to high resolution and the no ninvasive ability to image opaque samples, MRI is becoming one of the primary imaging modalities in modern medicine.7
Classes of Contrast Agents
MRI can distinguish between various parts of a specimen based on differences in T1, T2, and water concentration. However, when intrinsic contrast is low, contrast agents
improve image quality. In MR images derived from changes in T1, regions that are
associated with a contrast agent (nearby water molecules) have increased signal intensity compared to regions not associated with a contrast agent. The inverse is true for T2
-weighted images. Regions associated with a superparamagnetic center (such as an iron oxide particle ) have reduced signal intensity in an MR image compared to areas without contrast agents. The T2 shortening caused by superparamagnetic particles arises from the
local magnetic field inhomogenities associated with the large magnetic moments of these particles.
chelators prevent uptake of the free metal ions by biological systems. Common ligands used to coordinate paramagnetic metal ions are shown in Figure 1.6.
Further, a number of other paramagnetic metal-based substances are contrast agents. These materials include free transition metal ions such as copper(II) chloride, manganese(II) chloride, and ferric ammonium citrate.9,10 Linear polymers and dendrimers conjugated to metal chelates as well as liposomes containing paramagnetic ions are used as MR contrast agents.11-14 Superparamagnetic iron oxide nanoparticles are frequently used as T2 enhancing contrast agents.15,16 Finally, lanthanide
polyoxometalates (e.g. K9GdW10O36),17 clays and zeolites containing paramagnets,18 and
nanoparticles containing gadolinium ions19,20 can be used to enhance MR contrast. Contrast Agents for Diagnosis
Cancer
The development of new contrast agents, improved pulse sequences, and hardware is evolving MRI into one of the leading modalities for cancer diagnosis. Numerous MRI contrast agents aid the successful diagnosis of malignant tumors while others hold potential for improving the efficiency and accuracy of cancer diagnosis. Gadolinium(III) DTPA and Its Derivatives
A commonly used, clinically approved MRI contrast agent is the gadolinium(III) complex of diethylenetriaminepentaacetic acid (DTPA, gadopentetate dimeglumine, or MagnevistT M). The stability constant for demetallation (KGd) for gadolinium(III) DTPA
is very high (logKGd = 22.4), and the water-soluble complex is stable and nontoxic. It is
N N
N N
N N N
HO2C
HO2C
CO2H
CO2H
HO2C
CO2H
CO2H
HO2C
CO2H
DTPA (MagnevistTM)
DTPA-BMA (OmniscanTM) DOTA (DotaremTM)
BOPTA (MultiHanceTM)
DTPA-BMEA (OptiMARKTM)
HPDO3A (ProHanceTM) DO3AB (GadovistTM) N
N
N N HO2C
CO2H
HO2C
OH
N N
N N HO2C
CO2H
HO2C
OH
OH OH
N N N
CO2H
HO2C
CO2H
H N H N O O N N HN N HO2C
CO2H
HO2C
DO3A
N N N
CO2HHO2C
CO2H
H N H N O O O O
N N N
HO2C
HO2C
CO2H
CO2H
CO2H O
N N N
HO2C
HO2C
CO2H
CO2H
CO2H O
EOB-DTPA
DPDP (dipyridoxal diphosphate)
Texaphyrin N N N N N O O N OH
H2O3PO N N
N
OPO3H2
HO CO2H
HO2C
N
NH N
HN SO3
-SO3
-SO3
--O3S
[image:44.612.119.537.59.567.2]TPPS (5,10,15,20-tetrakis(p-sulfonatophenyl)-porphyrin)
processes. Gadolinium(III) DTPA enhanced MRI assists in diagnosis and monitoring of treatment response for many types of cancer.
Breast cancer is a major cause of death among women, and X-ray mammography is the method of choice for early cancer screening. While this technique is rapid and cost-effective, it may result in a missed fraction of cancers as high as nine percent, and there are concerns that repeated radiation exposure resulting from frequent mammographic screening may induce cancer.21,22 MRI has been tested as an alternative to mammography because of its sensitivity and lack of ionizing radiation. Gadolinium(III) DTPA has been used to screen premenopausal women for breast cancer.23 It has been used to follow the treatment of breast cancer before and after chemotherapy and can reveal tumor recurrence with a sensitivity of nearly 100% and a specificity greater than 90%.24,25 The use of gadolinium(III) DTPA in MRI can differentiate between benign and malignant breast tumors based on the contrast agent uptake rate.26,27 A correlation between gadolinium(III) DTPA signal enhancement and microvessel density was used to visualize angiogenesis.28 By employing a dedicated breast coil to maximize spatial resolution, MRI using gadolinium(III) DTPA for diagnosing breast cancer is more sensitive than mammography and has the potential to eliminate unnecessary biopsies.22,29
Gadolinium(III) DTPA is used for the identification of patients at risk for recurrence of certain cancers and to predict disease free survival in osteosarcoma.32 A qualitative measurement of tumor vascular physiology can be acquired using gadolinium(III) DTPA which may help to evaluate the prognosis and treatment of lung cancer.33 Finally, gadolinium(III) DTPA has been used to diagnose pulmonary arterial angiosarcomas, the most common primary tumor of the heart and great vessels, and to distinguish them from central pulmonary embolisms.34
Gadolinium(III) DTPA-BMA (gadodiamide or OmniscanT M) improves the imaging of hepatocellular carcinoma and hydronephrosis in rats by increasing differences in vascularity, blood flow, and permeability.35 It has been used in the diagnosis of pancreatic tumors.36 Gadoxetic acid (gadolinium(III) EOB-DTPA) can detect hepatic lesions better than unmodified gadolinium(III) DTPA.37 Recently, the simultaneous application of iron oxide microspheres and gadolinium(III) DTPA made it possible to characterize tumors in terms of gross histopathologic features as well as the vasculature spatial distribution and physiologic function.38 In another study using both superparamagnetic iron oxide particles and gadolinium(III) DTPA, colorectal tumors (the second most common malignant tumors in the United States, Europe, and Japan) were accurately staged.39
Linear polymers and dendrimers modified with gadolinium chelates have potential as diagnostic contrast agents. Dynamic micro-MRI with the dendrimer based contrast agent DAB-Am64-(1B4M-Gd)64 is useful in the evaluation of hepatic
shown to be detectable using a PAMAM dendrimer containing gadolinium(III) chelates and folic acid functional groups.41 Finally, gadolinium(III) DTPA attached to a linear polymer has been used as a blood pool agent which can differentiate between benign and malignant breast tumors in dogs.42
Manganese(II) and Iron Oxide Agents
Manganese-containing porphyrins have had success in the visualization of tumors because these complexes tend to localize in tumors. The proposed mechanism via which porphyrins accumulate in tumors is through selective uptake by benzodiazepine receptors abundant in tumor cells but not in normal cells.43 Mangafodipir trisodium (MnDPDP) was shown to be useful in establishing the diagnosis of acinar cell carcinoma, a rare pancreatic exocrine neoplasm.44 MnDPDP, which specifically labels liver tumors over healthy liver tissue, helps determine if surgery on hepatic tumors is a viable option.45-47 The manganese porphyrin, ATN-4T, accumulates in subcutaneous tumors in rabbits while rapidly clearing from surrounding tissues to yield images with enhanced tumor intensity.48 HOP-8P, a manganese porphyrin complex demonstrated sustained tumor enhancement of squamous cell carcinoma in mice.49
(~50 nm diameter) iron oxide particles (USPIO) improved diagnosis of metastatic axillary lymph nodes compared with precontrast MRI.53
Iron oxide nanoparticles have shown promise in the diagnosis of live r cancer.54,55 It is estimated that 25% of all patients with liver metastases can be cured with surgery if detected early by imaging.56 AMI-25, a superparamagnetic iron oxide particle coated with dextran, is taken up by healthy liver but not tumors.57 It has been shown to be effective in diagnosing 90% of hepatocellular carcinoma58 with an ability to differentiate between benign and malignant tumors with a sensitivity of 88% and a specificity of 89%.59 Reovist is a superparamagnetic iron oxide (SPIO) particle that improves diagnostic confidence and detection of focal liver lesions.60
Iron oxide nanoparticles have assisted the diagnosis of other types of cancer. Squamous cell carcinoma of the esophagus, which is one of the most aggressive malignant tumors of the digestive tract, has been specifically detected in rats using magnetite particles coated with anti- EGFR MAbs as a contrast agent.61 The USPIO particle Code 7227 has shown potential to be an MRI contrast agent for bone tumors in rabbits.62 Magnetic-dextran nanocapsules can be useful in the detection and characterizatio n of various splenic tumors.57 Small unilamellar vesicles sterically stabilized with polyethylene glycol were shown to differentiate between colon carcinoma cells and healthy tissue in rats.63
Non-Cancer Diseases Blood Pool-Related Diseases
evaluation of heart disease and can provide minimally invasive angiography, image angiogenesis, measure organ blood volume, and identify hemorrhage.11 There are a few examples of gadolinium(III) DTPA assisting with imaging of the circulatory system. The agent has a uniform distribution across ventricular epicardium when intrapericardially administrated to pigs.64 Patients with angina that have normal coronary arteries often exhibit regional accumulation of gadolinium(III) DTPA.65 Finally, a derivative of gadolinium(III) DTPA (OmniscanT M) can help image the carotid artery.66
Liposomes loaded with gadolinium-containing chelates have potential as blood pool agents.67 Modification of the surface of these liposomes with polyethylene glycol leads to longer blood retention times.11 Dendrimers containing gadolinium(III) DTPA are suitable blood pool contrast agents because large molecular weights slow their clearance from the blood.68 In addition to dendrimers, linear polymers conjugated to gadolinium(III) chelates have large molecular weights making them suitable blood pool agents. For example, a carboxymethyldextran polymer linked to gadolinium(III) 1,4,7,10-tetraazacyclododecane-N,N’,N’’,N’’’-tetraacetic acid (DOTA) with an amino spacer has been shown to be a blood pool agent in pigs and depicted infarcted myocardium.69 Further, dysprosium(III) DTPA bis(methylamide) has assisted in characterization of myocardial perfusion defects as a T2 enhancing agent.70
macrophages after cerebral ischemia in rats and to differentiate reperfused myocardium from acutely ischemic tissue.74,75
Diseases of the Gastrointestinal Tract
Imaging of the gastrointestinal (GI) tract is an area aided by MRI contrast agents. In order to successfully image the GI a contrast agent must possess the following properties: little or no absorption by the stomach or intestines, complete excretion, the absence of motion or susceptibility artifacts, affordability, and uniform marking of the GI tract.76 Gadolinium(III) DTPA has been used to depict the lumen of the digestive organs in rats and diagnose and classify fistulas in ano.77,78 It is effective in the primary diagnosis of Crohn’s disease and in differentiating nonactive from active forms of the disease.79,80 Gadolinium(III) DOTA has been used to examine the movement of material exiting the stomach and for diagnosis of delayed gastric emptying.81,82 Zeolites containing gadolinium have been shown to be an inexpensive, non-toxic alternative to X-ray and barium salts for imaging of the GI tract.83-85 Further, hectorite clay that has undergone ion exchange with gadolinium ions has been used as an oral contrast agent for GI tract imaging.86 Superparamagnetic iron oxide agents have been used to image the GI tract and assess ulcerative colitis.36,87,88 Finally, monodisperse sulphonated styrene-divinylbenzene latex particles with supported ferrite gives good MRI contrast in rats with no observed susceptibility artifact.89
Skeletal System Diagnosis
earlier than X-ray.91-94 Imaging of the cerebrospinal fluid compartment of rats was accomplished by intrathecal injecting of gadolinium(III) DTPA,95 while MRI discography aided by gadolinium(III) DTPA or a mixture of gadolinium(III) DTPA and the dendrimer based contrast agent Gadomer-17 may be an acceptable substitute for the imaging of disc pathology.96,97
Other diseases
Gadolinium(III) DTPA can be used to stage and differentiate the two types of pancreatitis without radiation or renal damage.98,99 Gadodiamide enhanced MRI is useful for early diagnosis of Nelson’s syndrome.100 The kidneys are the most important organs that maintain homeostasis. Gadolinium(III) DTPA enhanced MRI can be used to examine kidney function and monitor progress in kidney transplant patients.90,101 The dendrimer G4D-(1B4M-Gd)64 has been used for in vivo observation of damage to the
Targeted Delivery of Contrast Agents
As can be seen from the previous section, MRI contrast agents can be used to aid in the diagnosis of many diseases; however, the agents described thus far have the limitation of being non-site specific. The inability to localize selectively in a desired area lessens the diagnostic potential of these agents. The first step toward improving the diagnostic capability of contrast agents is to make them target specific and accumulate in desired biological locations. A summary of attempts towards this goal will be divided into gadolinium and iron oxide based contrast agents; however, this chapter cannot address every aspect of the growing area of contrast agent delivery. For more on this topic see reviews by Weissleder et al.115 and Okuhata.116
Contrast Agent Delivery
Gadolinium(III)-Containing Agents
labeled with gadolinium(III) DTPA have been conjugated to folate and used to successfully image tumor cells which are expressive of the high-affinity folate receptor in mice.122,123 Specific, no ninvasive imaging of angiogenesis in rabbits was accomplished using an antibody to the angiogenesis marker endothelial integrin αvβ3 conjugated to
gadolinium containing liposomes124 and perfluorocarbon-nanoparticles.125 Iron Oxide Agents
Iron oxide nanoparticles have been developed into targeted contrast agents. Similar to DOTA, magnetic nanoparticles have been functionalized with the HIV-Tat peptide, and cells internalize the resulting agents in a similar fashion to their gadolinium(III)-containing counterparts.126,127 Recently, Annexin V (a protein that binds to phosphatidylserine) labeled nanoparticles have been used to image apoptosis.128,129 Phosphatidylserine moves from the interior to the exterior of a cell membrane when a cell undergoes apoptosis. This agent is potentially useful for in vivo imaging of apoptosis resulting from diseases involving excessive apoptosis such as heart failure, transplant rejection, or aplastic anemia. In another case, human transferrin was covalently coupled to an USPIO particle and used to detect tumors in rats due to the specificity of transferrin-mediated endocytosis in the tumor cells.130
Cross-linked iron oxide (CLIO) particles labeled with anti- human E-selectin (CD62E) F(ab’)2 fragments were used to image E-selectin expression which occurs on
carcinoma.132 This agent was used successfully in a rat model of esophageal cancer, one of the most malignant and hard to treat tumors known.
Penetrating the Blood Brain Barrier
The blood brain barrier (BBB) is one of the most challenging physical hurdles when designing contrast agents intended for the brain. The BBB contains various mechanisms for minimizing the flow of material into and out of the brain.5,133 This barrier prevents most passive diffusion except by extremely small molecules such as water and ethanol. Electric charge, lipid solubility, and mo lecular weight can be used to help predict whether or not a molecule will cross the BBB.134
Brain tumors have a fenestrated BBB and diseases such as multiple sclerosis have episodes that involve temporary weakening of the BBB. Gadolinium(III) DTPA,133,135 gadolinium(III) BOPTA,136 and MION particles137,138 have all been used to image these BBB breakdowns. In addition, a method used to image rat brains has been the injection of superparamagnetic iron oxide particles directly into the brain.139,140 Further, manganese(II) chloride can map active regions of the brain because the manganese(II) ion enters excitable cells through voltage-gated calcium channels.9 One recent development in the delivery of contrast agents into the brain involves the conjugation of putrescine (an endogenously occurring polyamine that is known to increase BBB permeability) to an Aβ peptide linked to gadolinium(III) DTPA. This agent successfully crossed the BBB as predicted.141
Imaging Biochemical Events
field of MRI is activatable agents. Activatable agents are relatively new; however, this class of agents offers the potential for potent diagnostic tools.
The agents described thus far share the common property of enhancing MRI images at all times. Conversely, activatable agents possess two distinct states. One state is off and corresponds to low contrast enhancement, while the other state, the on state, corresponds to high contrast enhancement. An activatable agent can be switched from one state to the other by the occurrence of a metabolic or physiological event. The design of this new class of agents exploits the fundamental means by which a paramagnetic species affects the intensity of an image acquired by MRI.
Some switches used to activate gadolinium(III) agents are variables in the Solomon-Bloembergen equations and include q, τr, and τm, which were described earlier
in this chapter. Increasing q or τr or decreasing τm to an optimal value leads to a decrease
in T1 resulting in higher contrast enhancement. Another class of activatable lanthanide
based agents makes use of a chemical exchange saturation transfer (CEST) event as the switch. Finally, activation of iron oxide agents is due to the enhanced anisotropy caused by the dipolar coupling between nearby crystals of aggregated USPIO. This enhanced anisotropy leads to a dramatic decrease in T2.
Enzymatically Activated Contrast Agents
to access the gadolinium(III) and increasing q. This increase in q increases the relaxivity of the contrast agent.
Anelli and coworkers have synthesized a DTPA derivative which can detect carbonic anhydrase (Figure 1.8).144 The gadolinium complex contains a sulfonamide group in place of one of the carboxylic acid arms of the DTPA, helping it to selectively target the enzyme carbonic anhydrase. Upon binding to the enzyme, the relaxivity increases significantly (approximately five fold at 40 MHz). This increase in relaxivity is due to an increase in τr caused by binding to the large enzyme.
Nivorozhkin and coworkers prepared an agent that is sensitive to the presence of human carboxypeptidase B (a thrombin-activatable fibrinolysis inhibitor (TAFI)), which has been implicated in thrombotic disease (Figure 1.9).145 TAFI cleaves a trilysine masking group attached to the agent exposing an aromatic functional group. This aromatic group has a high binding affinity for human serum albumin (HSA). The contrast agent binds HSA leading to an increase in τr resulting in an increase in relaxivity.
This event is known as a receptor- induced magnetization enhancement (RIME). The trilysine chain makes this agent a pro-RIME agent because the trilysine chain inhibits interaction with HSA.
Bogdanov and coworkers prepared a peroxidase activatable agent.146 This agent consists of a gadolinium(III) chelate linked to benzene-1,2-diol that acts as a monomer. In the presence of peroxide, the monomers are oligomerized yielding a threefold increase in relaxivity due to an increase in τr. This MRI signal amplification (MRamp) can detect
low relaxivity
N N
N N
O2C O
CO2 O2C
Gd N N
N N
O2C O
CO2 O2C
Gd
O
OH
OH HO
OH
β
-galactosidase
high relaxivity
HO H
N
N
N
O
HN
HOOC
HOOC
COOH
COOH
[image:58.612.114.541.59.326.2]SO
2NH
2NH O N H R O H N
+H3N
O N H
NH3+
O H N
O
+H3N
O -O Gd-DTPA NH O N H R O H N
+H3N
O N H
NH3+
O O -O Gd-DTPA NH O N H R O H N
+H3N
[image:59.612.107.541.57.468.2]O O -O Gd-DTPA NH O N H R O O -O Gd-DTPA I OH I TAFI - Lysine TAFI - Lysine TAFI - Lysine R = or
human endothelial cells in cell culture by imaging the high local enzymatic activity of antibody-bound peroxidase associated with the plasma membrane of these cells.
Perez and coworkers have utilized the difference in relaxivity between solitary CLIO particles and those in close proximity to other CLIO particles to detect DNA-cleaving agents (Figure 1.10).147 Two strands of complementary DNA are each conjugated to a CLIO particle. When the complementary strands bind, the CLIO particles from each strand come into close proximity to each other. Upon cleavage of the double strand by a DNA-cleaving agent, the two CLIO particles become separated leading to a detectable change in relaxivity.
Utilizing a similar mechanism, Zhao and coworkers have developed a protease sensitive MRI contrast agent (Figure 1.11).148 With this agent, the strong interaction between biotin and avidin is exploited. A molecule of biotin is conjugated to each side of a peptide that is cleaved by proteases. CLIO particles coated with avidin are exposed to the bi-biotinylated peptides. In the presence of protease specific for the peptide, the CLIO particles will not aggregate; however, in the absence of protease, aggregation of the CLIO particles will occur resulting in an increase in relaxivity. Currently this agent has only been used in vitro.
Contrast Agents to Detect Biologically Significant Molecules
CLIO
SS
TTACGCCCTA GGATCCTC
CLIO
AATGCGGGA TCCTAGGAG
SS
CLIO
CLIO
SS
TTACGCCCTAG
GATCCTAGGAG
SS
AATGCGG
GATCCTC
BamHI
CLIO-avidin CLIO-avidin
low relaxivity high relaxivity
protease
no protease
biotin biotin
[image:62.612.113.533.55.663.2]cleavage site
N N N N O O O O O O N N HO
N N N
COO COO O H N O H N OH O OH O HO HO OOC Gd Fe2+ Fe3+ Fe2+ N N N N O O O O O O N HO N Fe3+ O O O O O O O O O NH NH HN R R R
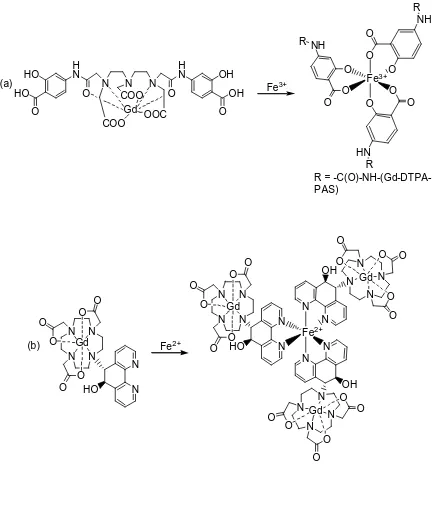
[image:63.612.109.542.70.581.2]R = -C(O)-NH-(Gd-DTPA-PAS) N N N N O O O O O O N OH N N N N N O O O O O O N OH N (b) (a) Gd Gd Gd Gd
another iron-sensitive contrast agent was designed.150 This time, DOTA was conjugated to the ligand 5,6-dihydrophenanthroline. Self- assembly around iron(II) ions leads to an increase in τr and a subsequent increase in relaxivity from 5.1 to 12.5 mM-1s-1.
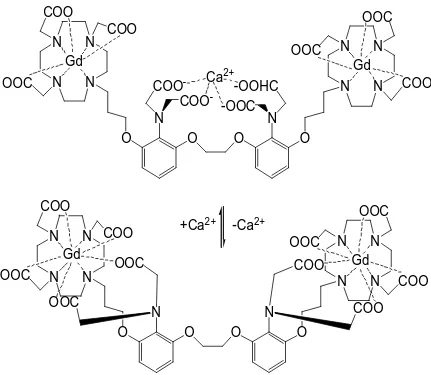
An important intracellular secondary messenger of signa l transduction is calcium(II). Changes in the cytosolic concentration of calcium(II) trigger changes in cellular metabolism and are responsible for cell signaling and regulation. Li and coworkers have developed a contrast agent that can specifically detect calcium ions (Figure 1.13).151,152 This agent is a gadolinium-based and possesses two limiting conformational states with regard to calcium(II) concentration. In the absence of calcium(II), the aromatic aminoacetates of the ligand interact with the two gadolinium(III) ions. In the presence of calcium(II), the aromatic iminoacetates rearrange to bind calcium(II) thereby allowing water to bind directly to gadolinium(III). This increase in q yields an increase in relaxivity.
A DTPA-based gadolinium contrast agent that differentiates between oxygenated and deoxygenated hemoglobin was created by Aime and coworkers (Figure 1.14).153 The complex contains two boronic acid moieties that enable it to bind to hemoglobin. There is a threefold difference in relaxivity between when the agent is bound to oxygenated versus deoxygenated hemoglobin. This difference is attributed to the different binding states that the agent has with hemoglobin in each of the two states.