Tire-Suspension-Steering Hardware-in-the-Loop
Simulation
Sunhapos Chantranuwathana1,2,*, Ratchatin Chancharoen1, Witaya Wannasuphoprasit1,
Angkee Sripakagorn1,2, and Nuksit Noomwongs1,2
1Department of Mechanical Engineering, Faculty of Engineering, Chulalongkorn University, Bangkok 10330, Thailand
2Smart Mobility Research Center, Chulalongkorn University, Bangkok 10330, Thailand *E-mail: supavut@gmail.com (Corresponding author)
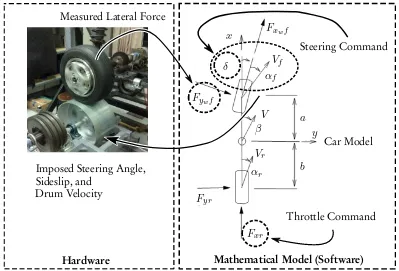
Abstract. Safety and performance have always been important factors in automotive testing. These factors are highly dependent on the tires and suspensions, which should be simulated and tested through-out the development process. During development, Hardware-In-the-Loop (HIL) simulations may be used so that testings and tunings can be done earlier in the process. In this paper, designs and configu-rations of a newly developed tire-suspension-steering HIL are shown. An actual wheel assembly with suspension and steering components can be installed for testing with dynamic models of the rest of the car. The slip angle of the tire can be imposed in the test rig while actual tire forces can be measured and used in the dynamic model. Comparisons of HIL simulations and real experiments using the skid-pad test and the step steering test are given using Formula SAE race cars. It was found that the HIL simulation results are more accurate compared to non-HIL simulations.
Keywords: Vehicle dynamics, tire suspension steering hardware in the loop simulations, skidpad test, step steering response.
ENGINEERING JOURNALVolume 22 Issue 5 Received 30 January 2018
Accepted 26 July 2018 Published 30 September
1. Introduction
Safety and performance have always been important factors in automotive dynamic testing. These factors are highly dependent on the tires and suspensions [1–3] which should be simulated and tested throughout the development process. Recently, HIL simulations have become increasingly common. With HIL simulations, highly reproducible testings and tunings can be done earlier in the design and validation process. Applications of HIL simulations can be found in various stages of the so-called “V” diagram of the design and development process [1]. In this paper, a newly developed tire, suspension, and steering HIL test rig is presented.
An HIL simulation is a testing method that combines advantages of hardware based and model based testing [3, 4]. In such simulation, real components that need to be tested or that are difficult to build mathematical models for are used, while mathematical models are used to simulate other parts of the system that may not exist at the time of testing. Generally, HIL simulations can reduce cost and testing time when compared to a full prototype testing. In some cases, HIL simulations can also be used to bypass the need to experimentally construct a complicated mathematical model.
In automotive applications, one of the most common applications of HIL simulations is testing and evaluating a vehicle’s Electronic Control Unit (ECU). In this case, a real ECU is tested by giving it virtual signals generated from a computer running a vehicle model. It can then be tested and analyzed under various driving conditions [5]. Dangerous driving conditions can be tested safely and repeatably. Due to these advantages, there are a number of commercially available products specialized in HIL simulations of ECUs; e.g., products from AVL, dSPACE, and ETAS. There are numerous HIL systems to test various functions of the ECU; e.g., HIL of Anti-lock Brake Systems (ABS) [6, 7], HIL of Electronic Power Steering (EPS) [8], HIL for testing of velocity/distance controller for driver safety system [9], HIL system of throttle body for testing of engine throttle controller [10], and HIL system to test diesel hybrid electric vehicle [11].
Apart from the ECU, there are many other HIL systems developed for testing of other automotive systems. The following are some of the HIL systems that may be related to the proposed tire-suspension-steering system. For example, a wheel and tire HIL system for testing of vehicle dynamics was developed in [12] and [13]. Damper and suspension HIL systems were developed to study vertical vibration [3,14]. Steering HIL systems can also be found in the works by [8] and [15]. A combination of brake, steering, and tire pressure HIL system was presented in [16]. There was even a system with a full car in the simulation loop to test driver assistant systems [1].
In terms of vehicle dynamic testings, which are the main focus of this work, there are a number of HIL systems that can be found in the literature. However, these are mostly HIL of separate components. The HIL system with a combination of tire, suspension, and steering components developed in this work has not been used before. Arguably, the force generation between the tire and the road is the most important and the most complicated. Hence, an HIL system with actual tires were proposed in [12, 13]. An HIL system was constructed with two go-kart tires to measure actual tire lateral forces and used in a single track vehicle model. There were neither suspension nor steering components but the tires can be positioned to impose the slip angle required by the model. Motion and deformation of the suspension and steering components cannot be simulated by this hardware. An HIL system of vehicle suspension dampers [17] and an HIL system of other suspension components [3] were also studied. However, the vertical vibration was the main focus. Similarly, steering HIL systems were used to study steering dynamics [8, 18]. Actual steering components were used while the tire forces were simulated. It should be noted that there are a number of studies that use scaled vehicles that include the tire, the suspension, and the steering system [19,20]. However, the overall dynamic behaviors of the car were the main concerns. The suspension and steering components of the scaled vehicle were not meant to replicate the actual components.
lateral tire forces with actual tires [12, 13, 21, 22]. Capturing accurate lateral tire forces is important when simulating vehicle handling tests; e.g., skidpad tests and step steering tests. In the literature, the suspension and steering components were used in HIL systems separately. However, the accuracy of such tests may be improved if the components are tested together, since tire, suspension, and steering components interact with each other. For example, the lateral tire force generates deflection in the tire as well as in the suspension and the steering components. To capture their interactions, an HIL test rig that combines tire, suspension, and steering components is proposed in this work.
Comparisons of HIL simulation results with real vehicle experiments using Formula SAE race cars are also presented in this paper. To study the lateral dynamic behavior of a car, a skidpad test and a step steering test are usually performed [12, 13, 23, 24]. However, only a few studies have published data comparing HIL results with full car experiments. For example, an HIL system was constructed with a pneumatic brake and an ECU was used to simulate truck dynamics to test stability controllers [25]. Although experimental data was available, HIL results were not directly compared to the experimental data. The work focused on the improvement of the control system predicted by the HIL results.
2. Design and Construction
In this HIL system, actual vehicle wheel assemblies with tire, suspension, and steering components can be installed as shown in Fig. 1. The system was designed to allow various types of suspensions to be installed. As shown in the figures, a McPherson strut (Fig. 1a), a tricycle front fork (Fig. 1b), and a double wishbone suspension (Fig. 1c) can be installed. Furthermore, a steering motor and a driving motor can also be installed to study the front wheel or the rear wheel as desired. For the front wheel, it can be steered to follow a simulated driver command. The wheel is placed on top of a road surface drum that can be oriented to create the slip angle of the tire while the resulting tire force is measured.
[image:3.595.69.530.416.624.2](a) MacPherson strut (b) Front fork of a tricycle (c) Double wishbone
Fig. 1. Tire-Suspension-Steering HIL test rig.
contact patch will move when the wheel is steered, the drum system can also be positioned to keep the tire contact patch at the center of the wheel. Two linear actuators shown in the figure were used to control the position and orientation of the road surface drum. The drum system can be moved linearly for±100mm and can be rotated for±25◦.
Drum Orientation Actuator
Drum Position Actuator Motor and
Timing Belt
Road Surface Drum
[image:4.595.122.479.142.303.2]Equivalent Inertia
Fig. 2. Road surface drum and its actuators.
One of the main difficulties in building this HIL system was the tire force measurement system. For this purpose, a rotating force measuring device in a form of a wheel rim is generally used. This type of device is, however, expensive. To reduce cost, a ring-shaped non-rotating force transducer was used. Because of the size of this force measuring device, it is impossible to use the same knuckle as the real formula car. The knuckle must be modified to install the force transducer in the middle of the knuckle as shown in Fig. 3. Notice that a special rim with a large positive offset must be used to compensate for the thickness of the force sensor. This is to ensure that the tire contact patch remains at the original location relative to the suspension. Furthermore, the brake system must also be moved inbound to accommodate for the increased in size of the wheel hub assembly as shown in Fig. 4. The chosen ring-shaped transducer also allows a drive shaft to pass through to drive the wheel if required. For other types of cars or suspensions, similar modifications may also be applied. For example, Fig. 5 shows a modified front wheel assembly of a tricycle. The force sensor was secured on one side of the main shaft which ran through the force sensor. Bearings were installed on the other side of the sensor so that the wheel can freely rotate on them.
Wheel-side Knuckle
Suspension-side Knuckle
Rim Offset Knuckle Offset
Ring Shaped Hallow Force Sensor
Fig. 3. Wheel assembly of a Formula SAE car with the knuckle modified to include the force sensor.
[image:4.595.113.478.555.712.2]Drive Shaft
Inbound Brake
Planetary Gear
Wheel Motor Steering Motor
[image:5.595.125.472.75.284.2]Rack and Pinion
Fig. 4. Steering and driving system.
Tire
[image:5.595.199.394.325.481.2]Bearings Force Sensor Shaft Front Fork
Fig. 5. Front wheel assembly of a tricycle.
points for the suspension, spring, and damper were replicated in the exact locations as in the real Formula SAE car. The bell crank, the push rod for the spring, and the damper were also duplicated. Two versions of the Formula SAE car were implemented and simulated. Both versions used slick tires with 13 inches rim and 7.5 inches of width (180/50V R13). The effective diameter of the installed tire was approximately 540 mm at 25 psi of inflation pressure. Figure 6 shows the actual suspension on the HIL test rig. The wheel assembly, the suspension components, and the steering components were installed on a carriage mounted on two vertical guide rails. Vertical load on the tire can be adjusted by adding or removing masses from the carriage.
Fig. 6. HIL system with Formula SAE car components.
Car Model
Imposed Steering Angle, Sideslip, and
Drum Velocity
Hardware
Steering Command
Mathematical Model (Software) Measured Lateral Force
Throttle Command
a
b y
Fxr
x
Vf
δ
αf
Fywf
Fxwf
V β
αr
Vr
[image:6.595.98.497.312.583.2]Fyr
Fig. 7. Hardware-In-the-Loop simulation scheme.
Power Circuits Wheel Motor Steering Motor Force Sensor Tire-Suspension-Steering Hardware Orientation Motor Drum Motor Position Motor PXI CompactRIO PXI UI TCP/IP Signals
Power Circuit and Interface Box
[image:7.595.70.536.79.303.2]Simulator and Low Level Controllers Suspension PC Supervisor Signal Terminals Power Terminals Power Supplies Battery Regulator Interface Circuits Power Amplifiers TCP/UDP Digital I/O Power Relays Force Signal CompactRIO UI
Fig. 8. HIL control systems.
3. Vehicle Model
The single track model or the so-called “bicycle” model used in this work is shown in Fig. 9. Inputs to the model are the wheel steering angle (δ), the two longitudinal forces (Fxwf andFxr), and the two
tire lateral forces (Fywf andFyr). As stated earlier, the first three inputs are dependent on the driving
scenario. One of the two lateral forces is measured from the test rig while the other is obtained from a tire model. For example, if the front wheel and suspension system are installed on the test rig, then the front tire lateral force is measured while the rear lateral force is obtained from a model. The front slip angle (αf) can be obtained from the model, which must be replicated on the HIL hardware. The state equations of the single track model can be written as
˙
Vx = rVy+
1
m{Fxwfcosδ−Fywfsinδ+Fxr}
˙
Vy = −rVx+
1
m{Fxwfsinδ+Fywfcosδ+Fyr} (1)
˙
r = 1
Iz{
aFxwfsinδ+aFywfcosδ−bFyr}
whereVxis the longitudinal speed;Vyis the lateral speed;ris the yaw rate;mis the mass of the vehicle;
Fxwf andFywf are the tire forces at the front wheel in thexandydirections relative to the wheel;Fxr
andFyr are the tire forces at the rear wheel in thexandydirections;Izis the mass moment of inertia of the car;aandbare the distances from the center of mass to the front and the rear wheels respectively;
δis the steering angle;β = arctan(Vy/Vx)is the vehicle’s sideslip angle; andαf andαrare the tire slip angles of the front and rear tire respectively.
3.1. Formula SAE Car
a
b y
Fxr
x
Vf
δ
αf
Fywf
Fxwf
V β
αr
Vr
[image:8.595.228.354.79.304.2]Fyr
Fig. 9. Single track model.
by rotating the car about a vertical axis with a known rotational stiffness; i.e., a torsional pendulum. The simple harmonic motion obtained can be used to calculate the inertia.
Table 1. Formula SAE car parameters.
Car mass (m) 366 kg Moment of inertia (Iz) 146.22 kg.m2 CG to front wheel (a) 0.839 m CG to rear wheel (b) 0.821 m
3.2. Lateral Tire Force and Cornering Stiffness
A tire force model is required to use the vehicle model. For a non-HIL simulation, models for both front and rear tires are required. For the HIL simulation in this work, only the rear tire model is required. The relation between the slip angle (α) and the lateral force (Fy) was measured in advance by using the HIL test rig. For this purpose, the road surface drum was oriented at multiple angles to impose slip angles while the lateral forces were measured. Figure 11 shows the relationship between the lateral forces and the slip angles. In this plot, the front wheel vertical load was 90 kg (882.9 N) and the rear wheel vertical load was 92 kg (902.5 N) which are the static loads of the wheels. Various speeds of the drum were also used in the experiments.
Based on Fig. 11, linear relationships between lateral forces and slip angles of the tires are generally used to estimate understeer/oversteer behavior of a car. In particular, the center slope of the graph may be defined as the tire cornering stiffness: Cαf for the front tire andCαrfor the rear tire. From the graph,Cαfis 242 N/deg andCαris 289 N/deg. Equation (2) can then be used to calculate the understeer gradient (K) [24].
K = wf
Cαf −
wr
Cαr
(2)
[image:8.595.200.392.423.481.2]Fig. 10. Chulalongkorn 2012 Formula SAE car.
Lateral force and sideslip angle
Slip angle (deg)
Lat
er
al
for
ce
Fig. 11. Lateral force as a function of slip angle for the front and the rear tires
noted that this prediction of understeer behavior should be quite accurate at low lateral accelerations (low lateral forces).
4. Experimental Results
Skidpad tests were used to test the dynamic behaviour of the Formula SAE car. In this test, a skidpad with a radius of 10.6 meters was used. An accelerometer and a steering rack stroke sensor were used to record data while the driver was slowly increasing the speed of the car. The vehicle used in this test was the 2012 Chulalongkorn University Formula SAE car shown in Fig. 10.
Figure 12 shows the results of the skidpad experiments. In this figure, two driving experiments are shown. The results from the HIL simulations are shown as diamonds in the figure. Note that for the HIL simulations, the actual front wheel with suspension and steering components were used, while a nonlinear tire force model based on Fig. 11 was used for the rear tire. For comparisons, two non-HIL simulations using the same single track model with a linear and a nonlinear tire models are also shown. Note that for the steady-state skidpad tests, skidpad results for the non-HIL simulation can be directly calculated without requiring any numerical simulation. Assuming a small steering angle, skidpad results for the non-HIL simulation with linear tire model (dashed line) can be calculated using Eq. (3).
δ= L
[image:9.595.157.407.280.440.2]St
eer
ing
angle
(deg) Experiment 1
Experiment 2
Linear model
Model (non-linear tire) HIL
[image:10.595.100.486.76.267.2]Lateral acceleration (g) Steady-state skidpad
Fig. 12. Skidpad experimental results compared to HIL simulation and models with linear/nonlinear tire model.
where δ is the steering angle; Lis the wheel base of the car (L = a+b);R is the turning radius; K
is the understeer gradient; anday is the lateral acceleration [24]. Similarly, the non-HIL results with a nonlinear tire model (‘x’ markers) can also be calculated by rewrite Eq. (3) as
δ= L
R +αf −αr (4)
Given a lateral acceleration, the required lateral forces may be calculated as
Fywf ≈ mayb/L
Fyr ≈ maya/L
Using Fig. 11, the required slip angles (αf andαr) can be found and used in Eq. (4).
From Fig. 12, it can be seen that the HIL simulation results are better at predicting the actual ex-periments compared to the non-HIL results. If we consider the maximum lateral acceleration, it can be seen that the maximum lateral acceleration predicted by the HIL simulation is closer to the value obtained by the experiments which is around 1 g. On the other hand, it is around 1.4 g for the non-HIL simulation with a nonlinear tire model. It can be clearly seen from Fig. 11 that the lateral acceleration limit around 1.3-1.5g may be expected since the lateral force becomes saturated at 30% to 50% more than the static weights on that tires. Note that when the nonlinear force data in Fig. 11 is used, the results will not deviate much from the linear force model (dashed line) as shown in Fig. 12 unless the forces are near saturation. Although all simulation results are somewhat linear and have somewhat the same upward trends below 0.6 g, the experimental values quickly increase (becoming more understeer) around 0.7 g, which is also predicted by the HIL simulation.
when compared to the non-HIL simulations. The HIL simulation, however, attempted to capture the first factor. From Fig. 12, it can be seen that the HIL simulation results are better at predicting the actual experiments compared to the non-HIL results. From the figure, it may be suggested that the first factor is the most important.
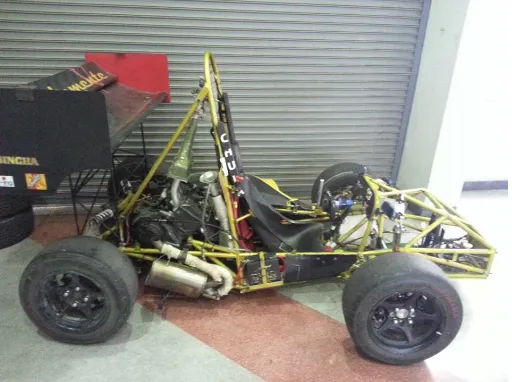
The step steering test was another type of test performed in this work. In this case, a step steering of 7 degrees at the wheel with a rate of 70 deg/s was used. The step was at 1.5 seconds and the car speed was 25 km/h. The lateral acceleration (ay) and the sideslip angle (β) were measured at the rate of 100 Hz using a GPS/GLONASS based Vbox 3i SL measurement system with an Inertial Measurement Unit (IMU). Note that another version of the Formula SAE car shown in Fig. 13 was used in this test with the following parameters: m= 428 kg,a= 0.87 m,b= 0.72 m,Iz= 175 kg/m2,Cαf= 485 N/deg, and
Cαr= 585 N/deg. The step steering responses are shown in Fig. 14 and Fig. 15. In both figures, the gray lines are the experimental results and the black lines are the results from HIL simulations. The non-HIL simulation results are shown as dashed lines in the figures. The non-HIL results were simulated based on Eq. (1), assuming that the car speed (Vx) is constant. The lateral forces were modeled linearly with
Fywf =Cαfαf , andFyr =Cαrαr. Nonetheless, it should be noted that if nonlinear tire force models
[image:11.595.171.427.322.513.2]were used the results would not be significantly different since the lateral forces were well within the linear region in this simulation.
Fig. 13. Chulalongkorn 2013 Formula SAE car.
Linear Bicycle HIL
Lat
er
al
A
cceler
ation
(g)
Time (s)
Experiment
Linear Bicycle Experiment HIL
[image:12.595.111.498.98.279.2]Lateral acceleration responses with step steering
Fig. 14. Lateral acceleration responses (step steering).
Linear Bicycle
Sideslip
Angle
(deg) ExperimentHIL
Time (s)
Sideslip angle responses with steep steering
Fig. 15. Sideslip angle responses (step steering).
5. Conclusion
In this work, a newly developed HIL system with tire, suspension, and steering components is presented. In the literature, only HIL systems with separate components proposed in this work have been studied. Designs and configurations of the HIL system are shown. Comparisons of HIL simulations and real experiments using the skidpad and the step steering tests are given. It was found that the HIL simulation results are more accurate compared to the non-HIL simulations.
Acknowledgement
[image:12.595.112.499.332.517.2]into its 2nd Century Project, and the National Metal and Materials Technology Center (MTEC), Thai-land, under the project “Development of Novel Evaluation Systems for Vehicle Dynamics, Driving, and Components.”
References
[1] O. J. Gietelink, J. Ploeg, B. D. Schutter, and M. Verhaegen, “Development of a driver information and warning system with vehicle hardware-in-the-loop simulations,”Mechatronics, vol. 19, no. 7, pp. 1091–1104, 2009.
[2] S. Hyun-Chul, K. Hong, and J. K. Hedrick, “Semi-active control of the macpherson suspension system: HIL simulations,” in Proceedings of the 2000 IEEE International Conference on Control Applications, 25-27 September, 2000, Alaska, USA, 2000, pp. 982–987.
[3] W. E. Misselhorn, N. J. Theron, and P. S. Els, “Investigation of hardware-in-the-loop for use in suspension development,”Vehicle System Dynamics, vol. 44, no. 1, pp. 65–81, 2006.
[4] R. Isermann, J. Schaffnit, and S. Sinsel, “Hardware-in-the-loop simulation for the design and testing of engine-control systems,”Control Engineering Practice, vol. 7, no. 5, pp. 643–653, 1999.
[5] S. H. Lee, T. W. Park, K. H. Chung, K. H. Choi, K. K. Kim, and K. H. Moon, “Requirement-based testing of an automotive ECU considering the behavior of the vehicle,” International Journal of Automotive Technology, vol. 12, no. 1, pp. 75–82, 2011.
[6] K. Enisz, D. Fodor, I. Szalay, and L. Kovacs, “Reconfigurable real-time hardware-in-the-loop envi-ronment for automotive electronic control unit testing and verification,”IEEE Instrumentation & Measurement Magazine, vol. 17, no. 4, pp. 31–36, 2014.
[7] V. Rajaram and S. C. Subramanian, “Design and hardware-in-loop implementation of collision avoidance algorithms for heavy commercial road vehicles,”Vehicle System Dynamics, vol. 54, no. 7, pp. 871–901, 2016.
[8] M. H. Lee, H. M. Lee, K. S. Lee, S. K. Ha, J. I. Bae, J. H. Park, H. G. Park, H. J. Choi, and H. H. Chun, “Development of a hardware in the loop simulation system for electric power steering in vehicles,”International Journal of Automotive Technology, vol. 12, no. 5, pp. 733–744, 2011. [9] W. Baek and B. Song, “Design and validation of a longitudinal velocity and distance controller via
hardware-in-the-loop simulation,”International Journal of Automotive Technology, vol. 10, no. 1, pp. 95–102, 2009.
[10] B. Ashok, S. D. Ashok, and C. R. Kumar, “An integrated pedal follower and torque based approach for electronic throttle control in a motorcycle engine,”Engineering Journal, vol. 21, no. 1, pp. 63– 80, 2017.
[11] J. H. Song, J. X. Wang, H. B. Tang, X. J. Mao, and B. Zhuo, “Diesel hybrid electric vehicle hardware system,”International Journal of Automotive Technology, vol. 10, no. 4, pp. 523–528, 2009.
[12] N. Noomwongs, H. Yoshida, M. Nagai, and S. Kawamata, “Development of hardware-in-the-loop simulator for analyzing vehicle handling and stability,” in Dynamics and Design Conference, 6-9 August 2001, 2001.
[13] N. Noomwongs, H. Yoshida, M. Nagai, K. Kobayashi, and T. Yokoi, “Study on handling and stability using tire hardware-in-the-loop simulator,”JSAE Review, vol. 24, no. 4, pp. 457–464, 2003. [14] H. H. Sung, J. H. Seung, S. K. Hong, and I. L. Kyo, “Vehicle dynamic analysis and evaluation of continuously controlled semi-active suspensions using hardware-in-the-loop simulation,” Vehicle System Dynamics, vol. 27, no. 5-6, pp. 423–434, 1997.
[15] A. Bertacchini, L. Tamagnini, and P. Pavan, “Force feedback in steer-by-wire systems: Architecture and experimental results,” inProceedings of IEEE International Symposium on Industrial Electronics, 9-12 July 2006, Quebec, Canada, 2006, pp. 3050–3055.
[17] D. C. Batterbee and N. D. Sims, “Hardware-in-the-loop simulation of magnetorheological dampers for vehicle suspension systems,” in Proceedings of the Institution of Mechanical Engineers. Part I: Journal of Systems and Control Engineering, vol. 221, no. 2, 2007, pp. 265–278.
[18] K. Hudha, M. H. Zakaria, and N. Tamaldin, “Hardware in the loop simulation of active front wheel steering control for yaw disturbance rejection,”Int. J. of Vehicle Safety, vol. 5, no. 4, pp. 356–373, 2011.
[19] S. Lapapong, V. Gupta, E. Callejas, and S. Brennan, “Fidelity of using scaled vehicles for chassis dynamic studies,”Vehicle System Dynamics, vol. 47, no. 11, pp. 1401–1437, 2009.
[20] R. Chaichaowarata and W. Wannasuphoprasit, “Kinematics-based analytical solution for wheel slip angle estimation of a rwd vehicle with drift,”Engineering Journal, vol. 20, no. 2, pp. 89–107, 2015. [21] P. Boonchata, N. Noomwongs, and S. Chantranuwathana, “Development of tire-suspension-steering hardware in the loop simulator for student formula car handling testing,” inProceedings of the 17th Asia-Pacific Automotive Engineering Conference, SAE Technical Paper 2013-01-0004, 2013. [22] S. Sookchaiyaporn, N. Noomwongs, R. Chanchareon, W. Wannasuphoprasit, and S. Chantranuwathana, “Tire-suspension-steering hardware-in-the-loop for vehicle dynamics simulation,” inProceeding of the 15th Asia Pacific Automotive Engineering Conference, 26-28 October 2009, Hanoi, Vietnam, 2009.
[23] L. D. Novellis, A. Sorniotti, P. Gruber, L. Shead, V. Ivanov, and K. Hoepping, “Torque vectoring for electric vehicles with individually controlled motors: State-of-the-art and future developments,” inEVS26 International Battery, Hybrid and Fuel Cell Electric Vehicle Symposium. 6-9 May 2012, Cal-ifornia, USA, 2012.
[24] T. D. Gillespie,Fundamentals of Vehicle Dynamics, 1st ed. Society of Automotive Engineers Inc., 2014.