White Rose Research Online URL for this paper:
http://eprints.whiterose.ac.uk/269/
Article:
Munro, J.F., Nicholl, J.P., Brazier, J.E. et al. (2 more authors) (2004) Cost effectiveness of
a community based exercise programme in over 65 year olds: cluster randomised trial.
Journal of Epidemiology and Community Health, 58 (12). pp. 1004-1010. ISSN 1470-2738
https://doi.org/10.1136/jech.2003.014225
[email protected]
https://eprints.whiterose.ac.uk/
Reuse
Unless indicated otherwise, fulltext items are protected by copyright with all rights reserved. The copyright
exception in section 29 of the Copyright, Designs and Patents Act 1988 allows the making of a single copy
solely for the purpose of non-commercial research or private study within the limits of fair dealing. The
publisher or other rights-holder may allow further reproduction and re-use of this version - refer to the White
Rose Research Online record for this item. Where records identify the publisher as the copyright holder,
users can verify any specific terms of use on the publisher’s website.
Takedown
If you consider content in White Rose Research Online to be in breach of UK law, please notify us by
EVIDENCE BASED PUBLIC HEALTH POLICY AND PRACTICE
Cost effectiveness of a community based exercise
programme in over 65 year olds: cluster randomised trial
James F Munro, Jon P Nicholl, John E Brazier, Rachel Davey, Tom Cochrane
. . . .
See end of article for authors’ affiliations . . . . Correspondence to: Dr J F Munro, Medical Care Research Unit, University of Sheffield, Regent Court, 30 Regent Street, Sheffield S1 4DA, UK; j.f.munro@sheffield. ac.uk
Accepted for publication 14 April 2004
. . . .
J Epidemiol Community Health2004;58:1004–1010. doi: 10.1136/jech.2003.014225
Objective:To assess the cost effectiveness of a community based exercise programme as a population
wide public health intervention for older adults.
Design:Pragmatic, cluster randomised community intervention trial.
Setting:12 general practices in Sheffield; four randomly selected as intervention populations, and eight as
control populations.
Participants:All those aged 65 and over in the least active four fifths of the population responding to a
baseline survey. There were 2283 eligible participants from intervention practices and 4137 from control practices.
Intervention: Eligible subjects were invited to free locally held exercise classes, made available for two
years.
Main outcome measures:All cause and exercise related cause specific mortality and hospital service use
at two years, and health status assessed at baseline, one, and two years using the SF-36. A cost utility analysis was also undertaken.
Results:Twenty six per cent of the eligible intervention practice population attended one or more exercise
sessions. There were no significant differences in mortality rates, survival times, or admissions. After adjusting for baseline characteristics, patients in intervention practices had a lower decline in health status, although this reached significance only for the energy dimension and two composite scores (p,0.05). The
incremental average QALY gain of 0.011 per person in the intervention population resulted in an incremental cost per QALY ratio ofJ17 174 (95% CI =J8300 toJ87 120).
Conclusions:Despite a low level of adherence to the exercise programme, there were significant gains in
health related quality of life. The programme was more cost effective than many existing medical interventions, and would be practical for primary care commissioning agencies to implement.
T
hose with active lifestyles enjoy better physical andmental health than sedentary people.1 2
Observational studies have shown that exercise is associated with lower all cause mortality3
and a reduced risk of coronary heart disease,3 4
stroke,5 6
and hip fracture,7 8
and may prevent type II diabetes and mild to moderate depression.9
There are many claims, and some evidence, that several other conditions may be prevented or improved by exercise. While this epidemio-logical evidence is considerable, there is only limited experi-mental evidence on the cost effectiveness of exercise interventions to promote health or prevent injury or disease.10 11
As most of the diseases associated with sedentary lifestyles are also associated with increasing age, it is in older adults that the greatest benefits of exercise might be expected. One review of the evidence for benefit in adults aged 65 and over concluded that exercise would improve cardiovascular status, functional ability and mental functioning, and reduce fracture risk.12
It also noted the virtual absence of reports of serious cardiovascular or musculoskeletal complications in older adults in any published trials. However, in practice we do not know how great the benefits might be or the costs of achieving them. Nor is it clear whether or not worthwhile public health benefits can be achieved for a population, as compared with benefits simply for few people at high risk.
We therefore undertook a pragmatic trial of an exercise programme that offered free supervised exercise sessions to all people over 65 in a defined population, who were not already in the most active quintile. The aim was to assess, in a similar way to other public health interventions, the cost effectiveness of a community based exercise programme for older adults from a health service perspective.
METHODS
Recruitment
Twelve general practices in Sheffield were recruited to the study. Practices were selected at random from those practices with two to five partners that were not already running an exercise programme, exercise prescription scheme, or related activity. Of 13 practices approached, 12 agreed to participate. Four practices were selected, using a computer random number programme, to act as intervention practices, with the remaining eight acting as controls.
All people aged 65 or over on both intervention and control practice lists were sent a baseline postal questionnaire to determine their general health status (using the SF-36) and current levels of habitual physical activity (using the physical activity questionnaire (PAQ) for the elderly).13
Those with a physical activity score in the top 20% were excluded, as we assumed that they had little to gain from additional exercise. General practitioners were given an opportunity to exclude from the study any patient they felt was unsuitable for exercise.
A letter was sent from the research team to those meeting the inclusion criteria, inviting respondents to indicate an interest in attending local exercise sessions twice weekly. Once a timetable was arranged in each area a second letter was sent to respondents inviting them to the first session.
The intervention
The intervention was defined pragmatically, as an invitation to attend locally organised, free, twice weekly exercise classes
provided for up to two years. Classes included activities aimed at improving joint mobility, muscle strength and endurance, flexibility, balance and coordination, and cardio-respiratory fitness. Strength training was carried out using resistance bands, with the number of repetitions increasing according to individual progress. These activities were led by a qualified exercise leader and typically performed to music. Each session had a slow warm up with gentle stretch and mobility exercises to minimise the risk of injury, a more vigorous middle section focused on aerobic endurance and strength conditioning, and a cool down section at the end. Time for meeting and talking with friends was incorporated into the timetable. Most classes lasted for 75 minutes, of which 45 minutes was physical activity. A range of other activities (such as bowling, swimming, country walking, and
tea dances) were also organised to try to appeal to a broad range of people of varying interests and abilities.
Most classes were held in church halls, community centres, and less frequently in residential homes, and all attendances at the classes were recorded. The programme was designed without reference to any explicit behavioural model or theory, and there was no attempt to assess individual psy-chological state in any way. It was intended as a pragmatic intervention that could easily be organised for a large popu-lation by a public health agency.
Outcomes
The main outcomes were all cause and cause specific mortality (from coronary heart disease, stroke, hip fracture, diabetes, or mental disorder), hospital admission, and change
Twelve practice lists: all patients with date of birth
before 1/4/1930
Sent baseline survey:
9897 (100%)
Gone away: 126 (1.2%)
Died: 1
No response: 1461 (15%)
Refused: 192 (2%) Completed surveys
returned: 8117 (82%)
Died before 1/8/95:
29
Most active one fifth: 1612
Missing activity score: 56 Least active four fifths:
6420
Subjects in intervention practices:
2283
Subjects in control practices:
4137
Attended at least one session: 590 (26% of those invited)
Did not attend any sessions: 1693
[image:3.612.68.413.48.330.2](74% of those invited)
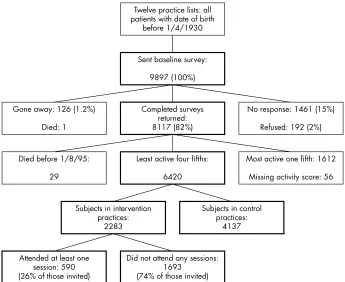
Figure 1 Study subjects.
Table 1 Characteristics of study practices and participants
Study practices Study participants
Number of GPs*
Total list size
Townsend deprivation score
Survey response rate (%)
Subjects in study
Mean
age Female (%)
Physical activity score at
baseline Living alone (%)
Intervention practices
A 2.75 6385 0.78 82.7 609 74.3 65.0 2.9 37.1 B 5 8016 0.40 75.2 525 76.4 69.1 3.0 41.3 C 3 6252 0.82 80.1 622 75.7 65.3 3.1 37.9 D 2.5 5690 1.64 74.8 527 75.8 68.3 3.9 43.1
Control practices
E 3 5385 20.05 87.3 810 74.8 66.2 3.6 40.5 F 2 4846 0.49 81.7 611 76.1 61.5 2.9 46.2 G 2.5 3125 0.85 81.6 339 75.6 68.1 2.2 46.3 H 4.5 8943 22.18 90.3 473 75.9 27.5 5.1 30.4
I 4 8212 21.54 80.6 462 75.5 62.6 2.2 44.2
J 2 4862 21.11 87.1 562 75.9 64.2 3.6 40.0
K 3 5442 1.44 82.6 605 74.1 64.5 2.4 40.3 L 2 1969 0.48 79.5 275 76.4 63.3 2.8 42.5
All practices 82.0 6420 75.4 62.5 3.2 40.6
[image:3.612.71.541.530.724.2]in health status. Deaths were identified by querying the study practices, local health authority records, and National Health Service Central Register. Hospital admissions were identified through the local health authority database, and using this we also recorded the use of outpatient and accident and emergency services during the two years before and after the intervention began. Health related quality of life was measured using the SF-36, by postal survey at baseline, and one and two years after the intervention began. We also used this survey to ask about use of GP services.
Economic analysis
The analysis was undertaken from a health service perspec-tive and designed to enable a cost utility analysis to be performed if the intervention proved to be both more costly and more beneficial. Results were expressed as an incre-mental cost per quality adjusted life year (QALY), which can be compared with other interventions purchased by health services. The problems and limitations of this approach are well known,14
but it provides some guidance to policymakers on the cost effectiveness of offering exercise to older people compared with other possible uses of these resources.
The costs of running an exercise programme include recruitment, administration, hire of halls, payments to the exercise leaders, and refreshments. Despite being a highly pragmatic trial, there were some features of the programme that were specific to the research study and it was necessary to adjust for these to allow the costs to be generalisable to
healthcare providers. For example, the input of the admin-istrators was adjusted to allow for the proportion of their time spent on data collection rather than the exercise pro-gramme. Resources used in the exercise programme were based on actual prices paid. All costs have been inflated to 2003/04 price levels using the Hospital and Community Health Services pay and price index and gross domestic product deflator.
SF-36 data have been converted into health state utility values using a recently estimated preference based algo-rithm.15 16
The area under the curve between assessments was used to provide an overall estimate of the QALY difference between the intervention and control arm after adjusting for significant baseline variables.17
Because cost and benefit data have been collected only for two years, the ongoing costs and health benefits have not been discounted, although the start up costs of the exercise programme have been annuitised over a five year period. The ratio of the differences in cost and QALY between the intervention and control arms has been estimated at the individual level after adjustment, with 95% confidence intervals estimated by bootstrapping. The sensitivity of the results to possible uncertainties in key parameters has been explored.
Sample size
The sample size was calculated with respect to the incidence of exercise related cause specific death or admission. The expected two year incidence of these conditions in the population aged over 65 eligible to be offered exercise was 14%. To have an 80% chance of detecting as significant (at
p,0.05) the fact that the risk of admission or death from
these causes in those offered exercise is reduced to 11%, about 1400 people in the intervention group and 2800 in the non-intervention (control) group would need to be rando-mised.18These sample sizes give over 90% power to detect a
change of five points or more in the quantitative SF-36 scores. The implications of cluster randomisation for the power of the study are discussed below.
The trial was designed with twice as many controls as intervention subjects because the relative costs of including controls were very small. To achieve the sample sizes we recruited and randomised four intervention practices and eight control practices.
Analysis
[image:4.612.69.540.39.218.2]In line with the policy related and pragmatic design of the study, the primary analyses were carried out for the whole study population whether or not they took up exercise, and compared estimates of outcome between the four
Table 2 Mortality and morbidity outcomes in intervention and control participants
Outcome
Participants in control practices (n = 4137)
Participants in intervention practices (n = 2283)
number % number % p ValueÀ
Deaths
All cause two years 505 12.2 283 12.4 0.91 All cause three years 638 15.4 352 15.4 0.91 Specific causes two years* 222 5.4 108 4.7 0.25 Specific causes three years* 284 6.9 136 6.0 0.13
Admissions
All cause two years 1473 35.6 853 37.4 0.13 Specific causes two years* 391 9.5 219 9.6 0.78
Death or admission
All cause two years 1613 39.0 941 41.2 0.09 Specific causes two years* 523 12.6 280 12.3 0.71
*‘‘Exercise related’’ causes of death were coronary heart disease, stroke, hip fracture, type II diabetes, and mental disorder.Àp value from multilevel model (see methods).
0.5
0
–1 –0.5
–1.5
–2
–3 –2.5
J F G L I E K D B C H A
Intervention Control
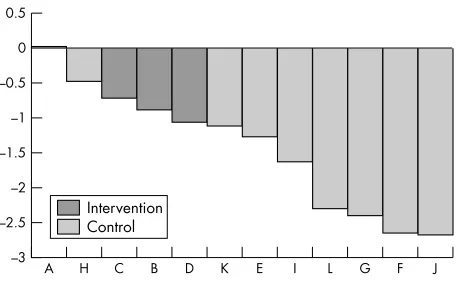
Figure 2 Adjusted*mean change in the preference based single health index (6100) by practice.*Adjusted for age, baseline physical activity score, sex, smoking, whether living alone, type of accommodation, and hospital admissions in the previous two years. Fixed effects
[image:4.612.70.299.544.685.2]intervention practices and eight control practices—that is, at the cluster level.
The nested or clustered structure of the data was formally taken into account using random effects multilevel models, fitted using Stata and adjusted for person level covariates. The covariates used in the model were age and baseline physical activity score (as continuous), sex, smoking, whether living alone, type of accommodation, and hospital admissions in the two years before the intervention period (as categorical). No practice level covariates were used. The models were used to test for differences between the intervention and control practice populations in the propor-tions who had died by two years and three years, the proportion admitted to hospital within two years and the proportion who had either died or been admitted within two years. Each of these analyses was carried out both for all cause end points and for exercise related (cause specific) end points, as described above.
The possibility of differences in the timing of deaths and any differences in sample characteristics was taken into account using a Cox regression model for time until death and adjusting for the covariates given above. The adjusted practice effects (the Cox regression coefficients) were tested to see whether mortality hazard rates differed between intervention and control practices using a simple Mann-Whitney rank test.
The SF-36 results were analysed using the eight dimen-sions, our additional ‘‘extended physical function’’ dimension aimed at older people19
and three composites: the physical
component score, the mental component score, and a preference based single index of health.15 16
The area under the ‘‘curve’’ described by the scores at baseline, one year and two years, net of the baseline score, was used as the measure of change. Comparisons between intervention and control practices, adjusted for the covariates given above, were made using random effects multilevel models as described.
RESULTS
Response
Table 1 shows the characteristics of the 12 practices recruited into the study, and their patients. After two reminders, the overall response rate to the first recruitment survey was 82%. After excluding the most active one fifth, 6420 people formed the total study population (fig 1). No person was excluded from the study by their GP.
During the two year intervention period 2040 sessions of exercise were provided, resulting in a total of 27 800 person sessions of exercise. In all, 26% (590 of 2283) of the eligible study population attended one or more sessions. Attendance
was more likely among women than men (29% v 20%,
p,0.001), younger than older (29% among those aged under
75v 23% among those 75 and older, p = 0.001), and most
active than least active people (37% among those with PAQ
score 5 or morev23% among those with PAQ score below 5,
[image:5.612.71.545.62.205.2]p,0.001). Of those ever participating in the programme, 50% attended at least 28 sessions and 30% attended at least 60 sessions during the intervention period.
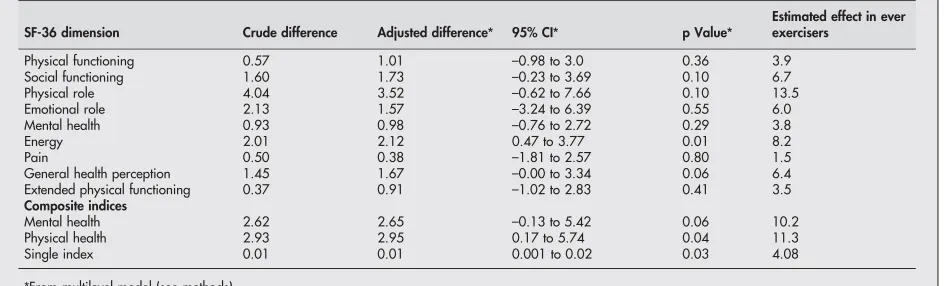
Table 3 Differences in mean health dimension scores between intervention and control participants
SF-36 dimension Crude difference Adjusted difference* 95% CI* p Value*
Estimated effect in ever exercisers
Physical functioning 0.57 1.01 –0.98 to 3.0 0.36 3.9 Social functioning 1.60 1.73 –0.23 to 3.69 0.10 6.7 Physical role 4.04 3.52 –0.62 to 7.66 0.10 13.5 Emotional role 2.13 1.57 –3.24 to 6.39 0.55 6.0 Mental health 0.93 0.98 –0.76 to 2.72 0.29 3.8 Energy 2.01 2.12 0.47 to 3.77 0.01 8.2 Pain 0.50 0.38 –1.81 to 2.57 0.80 1.5 General health perception 1.45 1.67 –0.00 to 3.34 0.06 6.4 Extended physical functioning 0.37 0.91 –1.02 to 2.83 0.41 3.5
Composite indices
Mental health 2.62 2.65 –0.13 to 5.42 0.06 10.2 Physical health 2.93 2.95 0.17 to 5.74 0.04 11.3 Single index 0.01 0.01 0.001 to 0.02 0.03 4.08
[image:5.612.68.543.536.735.2]*From multilevel model (see methods).
Table 4 Costs of the two year trial exercise programme*
Resource Resources used ValuationÀ
Central cost estimate (J)
Recruitment Initial survey of activity (n = 3520) with two reminders and a second survey with an invitation and leaflet (n = 2283)
Commercial quotation 10725 Facilitators 460.5 wte university technicians
grade D
J22969 pro rata plus ongoing costs
113928 Coordinator
start up
0.3 wte RII for 6 months J43898 pro rata plus ongoing costs
8165 Ongoing 0.2 RII per year 21773 Accommodation Office space for three work stations Standard rental 19637 Hire of halls Hire of halls for 2040 sessions Mean ofJ16.0 per session
across 13 venues
32645 Exercise leaders 1337 sessions (excluding sessions
undertaken by facilitators)
J31.24 per session 41769 Travel Average 3.5 miles per session J0.54 per mile (actual paid) 3824 Refreshments Tea, coffee and biscuits per session J8.03 per session 14566 Total cost of two year programme 267033
Of the 6420 people replying to the baseline survey, 39% had missing health status outcome data, due mainly to not responding to either or both the follow up surveys. There was slightly more missing data in the intervention group (41.8%) than the control group (37.5%), which was inversely related to baseline health status.
Mortality
After two years, 788 of the 6 420 subjects had died (12.3%). The proportion was similar in each cohort: 12.4% (283 of 2283) of the intervention cohort and 12.2% (505 of 4137) of the control cohort. After three years 990 people had died (15.4%), and again this proportion was the same in each cohort (table 2). For exercise related conditions there was a suggestion of lower mortality in the exercise arm at both two and three years but this did not reach statistical significance. The individual survival times until death from any of the selected exercise specific conditions were examined using Cox regression models as described, and showed no signi-ficant differences between trial arms (p = 0.50).
Use of health services
At two year follow up there was no evidence that fewer people were admitted from any cause or from the exercise related causes in the intervention populations compared with the control populations (table 2). Indeed, slightly more of the intervention population were admitted (37.4%) than of the control population (35.6%). There was no evidence of any difference in the use of other health services.
Death or admission
For all causes there was little evidence of any difference between the intervention group and the control group in the proportions who died or were admitted to hospital in the two years from the start of the exercise classes (table 2) and, for the primary outcome looking at numbers who were admitted or died from the selected exercise specific causes, the rates were similar: 12.3% in the intervention group and 12.6% in controls.
Health related quality of life
After adjusting for baseline characteristics, patients in intervention practices were estimated to have had less decline in health status than controls in every SF-36 dimension, although this reached conventional levels of significance only for the energy dimension (table 3). The composite scores also showed less decline in health status over the two year period in intervention than control populations, which was
sig-nificant for the physical component score and the preference based single index (fig 2).
Assuming an additive effect, the effect of exercise on those who actually attended the exercise programme can be estimated as the difference in effect between the intervention and control practice populations divided by the proportion who ever attended (0.26).20
Using this method table 3 also shows that the estimated average effect, in those who actually attended sessions, for both mental and physical health and some individual dimensions, exceeded the levels regarded by the SF-36 developers as indicating a clinically worthwhile gain in health related quality of life.21
Economic evaluation
The annual cost of the exercise programme was estimated to beJ128 302. This yields a mean cost per session ofJ125.78
and a cost per attendee per session of J9.06, assuming
activity levels equal to those found in the trial (table 4). As we found no evidence of any difference in the use of hospital services between trial arms, these services have not been costed.
The main uncertainties concern the costs of the adminis-trators and coordinator, the fees paid to exercise leaders, and the number of participants per exercise session. Administration and coordination may have been better resourced in terms of person hours than would be the case in a routine service, but a practice based programme may have used the more expensive resource of a practice nurse. The sensitivity analysis explored the consequences of halving the time and employing practice nurses rather than technicians. The session fee of exercise leaders was varied at plus or minusJ4.46. Finally, the number of attendees was
varied between 8 and 20 per session.
QALY benefits could be estimated only for the 3149 people who completed the SF-36 at all three assessments (2097 control and 1052 intervention persons), so we examined three different approaches to calculating cost per QALY:
(a) the total cost of the programme divided by the QALY
gain for survey completers only (that is, n = 1052);
(b) the cost for survey completers only divided by their
QALY gain (n = 1052);
(c) the total cost divided by the QALY gain assuming all the participants in the intervention arm experience the average gain (that is, n = 2283).
We took the second assumption as the central estimate. Combining this with the central cost estimate yields a mean
cost per QALY of J17 172 (95% CI =J8300 to J87 115).
Changing these assumptions resulted in the cost effectiveness
of the exercise programme varying between J4739 and
J32 533 per QALY, depending on the cost estimate and
extrapolation assumptions.
Key points
N
Many epidemiological studies have shown an associa-tion between physical activity and increased health and longevity.N
There is also some experimental evidence that exercisemay improve health and prevent injury, but little economic evidence available on the costs and health benefits of exercise programmes.N
This study shows that a large scale, community basedprogramme of exercise classes for older adults can be effective in producing improvements in physical and mental health at reasonable cost.N
Such a programme would be a practical, affordable,and popular investment for local healthcare commis-sioners.Policy implications
DISCUSSION
The programme we provided and evaluated generated both worthwhile changes in health related quality of life for the substantial number of regularly active participants, con-stantly remarked upon and appreciated by the participants themselves, as well as an affordable average health gain at the population level. A community based intervention of this sort is practical, affordable, and enjoyable for participants and, our evidence suggests, may be justifiable in terms of health gain.
Despite the absence of evidence for some of the expected gains in mortality and potential savings from reductions in use of health services, the central cost per QALY estimate of
J17 172 compares favourably with other healthcare
inter-ventions.22The uncertainty in this result depends less on the
specific assumptions underlying the costing of the pro-gramme or the application of the estimated benefits than on statistical uncertainty surrounding the size of the improve-ment in health status.
Although a number of previous trials of physical activity have included an economic evaluation, few have assessed health outcomes and so have been unable to estimate a cost per QALY. We have been able to identify only one trial—of aquatic exercise for adults with osteoarthritis—in which a cost per QALY was estimated (in this case, ranging from $32 000 to $205 000).23
Our trial therefore seems to be the first that has attempted to evaluate empirically the cost effectiveness of exercise as a community level intervention.
This was a highly pragmatic trial of the effectiveness of exercise when offered as a public health intervention to a comparatively unselected sedentary population, and we have analysed the trial in a pragmatic, area based way to reflect this approach. This has enabled us to avoid the consider-able difficulties of selection bias in both participation and adherence that can afflict individual level studies. Our analysis has focused on simplicity and is generally con-servative. However, although the results of the trial are modest, there are a number of reasons to suppose that they may tend to underestimate the true health benefits achieved by the programme.
Firstly, the follow up period may not have been sufficient to measure some of the longer term benefits, notably for mortality and admission rates. Secondly, missing SF-36 scores from non-respondents has led us to assume no benefit in these non-responders for the purposes of calculating QALY gain. Thirdly, the benefit enjoyed by people who exercised, particularly those who participated throughout the pro-gramme, was certainly far greater than the modest average suggests. Simple assumptions suggest that the benefits for those who actually took up exercise were often of clinical as well as statistical significance. Fourthly, we originally designed this study as a community intervention trial to be analysed at an individual level.24However, because we chose
the intervention practices at random we have been able to analyse it using multilevel techniques developed after our study protocol was completed. Although the estimated intraclass correlations are small, this has resulted in some loss of power for testing for mortality and admission rate reductions, and so the absence of evidence of benefit for these outcomes should not be interpreted as evidence of absence of benefit.
Although there is considerable uncertainty around the central estimate, which might have been reduced with higher levels of participation and lower levels of missing data, we believe the finding is robust and reflects the fact that an exercise programme can, given adequate attendance, produce worthwhile physical and mental health gain in large numbers of older adults at low cost. The economic evaluation provides further support for Morris’ contention that exercise
is a ‘‘best buy’’ in public health terms,25and the programme
we have described is an example of how the ‘‘exercise services’’ envisaged by the UK’s National Service Framework for Older People might be practically developed to worth-while effect.26
ACKNOWLEDGEMENTS
We are grateful to Jane Moss, Gareth Parry, and the late Gwyneth Askham for their help in undertaking this study, and to the 12 practices and many people who participated.
CONTRIBUTORS
All authors participated in the design and conduct of the study, and the writing of the paper. JM and JN analysed the outcome data, and JB carried out the health status and economic analyses. RD managed the provision of the exercise programme. JM is the guarantor.
Authors’ affiliations . . . .
J F Munro, J P Nicholl,Medical Care Research Unit, ScHARR, University of Sheffield, Sheffield, UK
J E Brazier,Sheffield Health Economics Group, ScHARR, University of Sheffield
R Davey, T Cochrane,Sports Health and Exercise, School of Health, University of Staffordshire, UK
Funding: this work was funded by the Cardiovascular Disease and Stroke Programme of the NHS Executive. The Medical Care Research Unit is funded by the Department of Health.
Competing interests: none declared. REFERENCES
1 Fentem PH, Bassey EJ, Turnbull N.The new case for exercise. London: Health Education Authority and Sports Council, 1988.
2 Nicholl JP, Coleman P, Brazier JE. An assessment of the health and healthcare costs and benefits of exercise.Pharmacoeconomics1994;5:109–22. 3 Paffenbarger RS Jr, Hyde RT, Wing AL,et al.The association of changes in
physical activity level and other lifestyle characteristics with mortality among men.N Engl J Med1993;328:538–45.
4 Morris JN, Chave SP, Adam C,et al.Vigorous exercise in leisure-time and the incidence of coronary heart-disease.Lancet1973;i:333–9.
5 Salonen JT, Puska P, Tuomilehto J. Physical activity and risk of myocardial infarction, cerebral stroke and death.Am J Epidemiol1982;115:526–37. 6 Herman B, Schmitz PIM, Leyten ACM,et al.Multivariate logistic analysis of
risk factors for stroke in Tilburg, the Netherlands.Am J Epidemiol
1983;118:514–25.
7 Boyce WJ, Vessey MP. Habitual physical inertia and other factors in relation to risk of fracture of the proximal femur.Age Ageing1988;17:319–27. 8 Wickham CA, Walsh K, Cooper C,et al.Dietary calcium, physical activity and
risk of hip fracture: a prospective study.BMJ1989;299:889–92. 9 Brown RS, Ramirez DE, Taub JM. The prescription of exercise for depression.
Physician and Sports Medicine1978;Dec:35–45.
10 Robertson MC, Devlin N, Gardner MM,et al.Effectiveness and economic evaluation of a nurse delivered home exercise programme to prevent falls. 1: Randomised controlled trial,BMJ2001;322:697–701.
11 Robertson MC, Gardner MM, Devlin N,et al.Effectiveness and economic evaluation of a nurse delivered home exercise programme to prevent falls. 2: Controlled trial in multiple centres,BMJ2001;322:701–4.
12 Elward K, Larson E B. Benefits of exercise for older adults: a review of existing evidence and current recommendations for the general population.Health Promotion and Disease Prevention1992;8:35–50.
13 Vorrips LE, Ravelli ACJ, Dongelmans PCA,et al.A physical activity questionnaire for the elderly.Med Sci Sport Exerc1990;23:974–9. 14 Drummond M, Torrance G, Mason J. Cost-effectiveness league tables: more
harm than good?Soc Sci Med1993;37:33–40.
15 Brazier JE, Harper R, Thomas K,et al.Deriving a preference based single index measure from the SF-36.J Clin Epidemiol1998;51:115–29. 16 Brazier JE, Roberts J, Deverill M. Estimation of a preference-based measure
for health from the SF-36.J Health Econ2002;21:271–92. 17 Matthews JNS, Altman DG, Campbell MJ,et al.Analysis of serial
measurements in medical research.BMJ1990;300:230–5.
18 Fleiss JL.Statistical methods for rates and proportions. 2 ed. New York: Wiley, 1981.
19 Walters SJ, Munro JF, Brazier JE. Using the SF-36 with older adults: a cross-sectional community based survey.Age Ageing
2001;30:337–43.
20 Zeger SL, Liang K-Y. Compliance as an explanatory variable in clinical trials. Comment: Dose-response estimands,Journal of the American Statistical Association1991;86:18–19.
21 Ware J.The SF-36 health survey manual and interpretation guide. Boston: Boston Health Institute, 1993.
23 Patrick DL, Ramsey SD, Spencer AC,et al.Economic evaluation of aquatic exercise for persons with osteoarthritis.Med Care2001;39:413–24. 24 Farquhar JW. The community based model of lifestyle intervention trials.
Am J Epidemiol1978;108:103–11.
25 Morris JN. Exercise in the prevention of coronary heart disease: today’s best buy in public health.Med Sci Sports Exerc1994;26:807–14.
26 Department of Health.National Service Framework for older people. London: Department of Health, 2001.
Speaker’s corner
...Health proverbs
A
proverb is a short popular saying that expresseseffectively some commonplace truth or useful thought. It can help people remember important messages and therefore is an important tool for information dissemination. Our ancestors have left us a great wealth of health proverbs, such as ‘‘Prevention is better than cure (1240)’’ (prevention), ‘‘Eat to live, not live to eat (1387)’’ (obesity), ‘‘Early to bed and early to rise, makes a man healthy, wealthy and wise (1496)’’ (sleep), ‘‘Better to wear out than to rust out (1557)’’ (physical activity), ‘‘Never let the sun go down on your anger (1642)’’ (stress), ‘‘A stitch in time saves nine (1732)’’ (early treatment), ‘‘An apple a day keeps the doctor away (1866)’’ (fruits), and ‘‘You are what you eat (1940)’’ (nutrition).1
Health proverbs that we have today were created by our ancestors based on their personal experience and observa-tions. However, many of those health proverbs have not been scientifically verified. Now that we have access to modern clinical trials and scientific studies, it is perhaps time for us to create new science based health proverbs for future genera-tions.
For example, based on results of modern scientific dose-response studies, would it be more correct to say ‘‘One and a half apple a day keeps the doctor away’’? Should there be health proverbs with advice on no smoking, drinking alcohol in moderation, maintaining a balanced diet, or being physically active? How about telling people to watch and keep within normal range their blood cholesterol, body fat, or blood pressure? While there are dozens of existing proverbs about general health problems such as the common cold, balanced diet, sleep, hygiene, etc, should there be modern proverbs warning people of the four major chronic diseases (heart disease, cancer, lung disease, and mental disorder)?
A proverb is usually a homely illustration of a general truth and is never meant to be a dry scientific statement. As long as it works to promote the health of the general population, it is a good proverb. In addition to health proverbs for the grown ups, we also need health proverbs for children.
On this note, here are some potentially promising health proverbs for the 21st century: ‘‘A smile is an inexpensive way to improve your looks’’ (optimism); ‘‘To get angry is to punish yourself with other people’s mistakes’’ (stress management); ‘‘The more you smoke, the more you croak’’
(smoking); ‘‘Smoking makes you ugly’’ (smoking—it causes facial wrinkles and hair loss)2
; ‘‘Drinker’s liver, smoker’s lung, couch potato’s flab, binger’s bulge’’ (drinking, smoking, inactivity, overeating); ‘‘Drinking and driving don’t mix’’
(traffic safety)3; ‘‘Seven days without exercise makes one
weak’’ (physical activity); ‘‘Eat well, be active, feel good about yourself’’ (nutrition, physical activity, positive atti-tude)4; ‘‘Tri-colour meal is a good deal’’ (nutrition—tri-colour
as in traffic lights—that is, red, yellow, green, for example, tomato, corn, lettuce, etc); ‘‘Imagine everyone has a fixed lifetime amount to eat: the less you eat, the longer you live’’ (diet); ‘‘Double cheeseburgers and large fries, How does diet pop make that wise?’’ (diet).
Bernard C K Choi
Department of Public Health Sciences, University of Toronto; and Department of Epidemiology and Community Medicine, University of Ottawa, Canada
Anita W P Pak
Institutional Research and Planning, University of Ottawa, Ottawa, Canada
Jerome C L Choi
Glebe Collegiate Institute, Ottawa, Canada
Elaine C L Choi
Vincent Massey Public School, Ottawa, Canada Correspondence to: Dr B C K Choi, Department of Public Health Sciences, University of Toronto; and Department of Epidemiology and Community Medicine, University of Ottawa, Canada; [email protected]
REFERENCES
1 Simpson J.The concise Oxford dictionary of proverbs. Oxford: Oxford University Press, 1992.
2 Canny AM, Goodrich TW. Smoking makes you ugly—an innovative approach to smoking cessation.AORN J2001;74:722–5. http://www.findarticles. com/cf_dls/m0FSL/5_74/81161392/p1/article.jhtml (accessed 20 Mar 2004).
3 Traffic Injury Research Foundation. Taking the pulse of the nation on drinking and driving. News release and backgrounders, 2 Dec 2003. http:// www.trafficinjuryresearch.com/whatNew/
whatNew.cfm?intNewsID = 122&intContactID = 3 (accessed 21 Mar 2004). 4 Health Canada.Using the food guide. Ottawa: Health Canada, 1997. http://