Ames Laboratory ISC Technical Reports Ames Laboratory
12-1955
Temperature coefficient of electrical conductivity in
the system potassium chloride - zinc chloride
R. A. Fleming
Iowa State CollegeR. R. Duke
Iowa State CollegeFollow this and additional works at:http://lib.dr.iastate.edu/ameslab_iscreports Part of theChemistry Commons, and thePhysics Commons
This Report is brought to you for free and open access by the Ames Laboratory at Iowa State University Digital Repository. It has been accepted for inclusion in Ames Laboratory ISC Technical Reports by an authorized administrator of Iowa State University Digital Repository. For more information, please contactdigirep@iastate.edu.
Recommended Citation
Fleming, R. A. and Duke, R. R., "Temperature coefficient of electrical conductivity in the system potassium chloride - zinc chloride" (1955).Ames Laboratory ISC Technical Reports. 123.
chloride - zinc chloride
Abstract
The phase diagram of the system KCl-ZnCl2has been constructed. Values of specific conductivity and density have been determined at eight temperatures in the range 475-650°C. for a series of compositions covering the concentration range. From these data, equivalent conductivities were calculated. The temperature coefficient of conductivity as expressed by the activation energy of ionic migration was calculated at four temperatures for each mixture.
Keywords Ames Laboratory Disciplines
Chemistry | Physics
UNCLASSIFIED
1
Physical SciencesReadin~
RoomUNCLASSIFIED
ISC-686
Subject Category: CHEMISTRY
UNITED STATES ATOMIC ENERGY COMMISSION
TEMPERATURE COEFFICIENT OF ELECTRICAL
CONDUCTIVITY IN THE SYSTEM POTASSIUM
CHLORIDE- ZINC CHLORIDE
By
R. A. Fleming
F. R.
Duke
December 1955
Ames Laboratory
Iowa State College
Ames, Iowa
. . - - - LEGAL NOTICE
This report was prepared as an account of Government sponsored work. Neither the United Stotes, nor the Commiulon, nor any person acting on behalf of the Commission:
A. Makes any warranty or representation, express or implied, with respect to the ac-curacy, completeness, or usefulneu of the information contained in this report, or that the use of any Information, apparatus, method, or process disclosed In this report may not in-fringe privately owned rightsJ or
B. Assumes any liabilities with respect to the use of, or for damages resulting from the use of any information, apparatus, method, or process disclosed in this report.
As used In the above, "person acting on behalf of the Commission" includes any em-ployee or contractor of the Commission to the extent that such emem-ployee or contractor prepares, handles or distributes, or provides acceu to, any infonnotion pursuant to his em-ployment or contract with the Commiuion.
This report has been reproduced directly from the best available copy.
Printed in USA, Price 30 cents. Available from the Office of Technical Services, Depa.rtmE:mt of Commerce, Wash-ington 25, D. C.
AEC, Oak Ridge, Tenn.
ISC-686 iii
TABLE OF CONTENTS
Page
ABSTRACT
•
ivINTRODUCTION • 1
EXPE: LH[BNTAL
.
6H};SUL'fS • • 19
DISCUSSION • • • • •
29
LI'l'lili.A1'URB CITBD • • • .
.
35
TEMPE.tl.ATURE COEFFICIENT Oi' ELECI'RICAL CONDUCTIVITY IN THE SYSTEM POTASSIUM CHLORIDE - ZINC CHLORIDE*
by
R. A. Fleming and F.
R.
DukeABSTRACT
The phase diagram of the system KCl-znClz has been constructed. Values of specific conductivity and density have been determined at
eight temperatures in the range 47S-650°C. for a series of compositions covering the concentration range. From these data, equivalent
con-ductivities were calculated. The temperature coefficient of conductivity as expressed by the activation energy of ionic migration was calculated at four temperatures for each mixture.
The phase diagra~ indicates compound formation in the solid state with the compound 2KC1-ZnC1 2 melt~ng at about 450°C. Density isotherms are 11S11 shaped, deviating from additivity in a positive direction at low concentrations of potassium chloride and exhibiting a slight negative deviation at high concentrations of potassium chloride. Isotherms of equivalent conductivity are approximately additive in the ran~e 0.00 ( XKCl ( 0.30 but then begin to deviate negatively, reaching a maximum negative deviation near XKCl
=
0.71. The activation energy at constant temperature falls rapidly from that of zinc(II) chloride as the concen-tration of potassium chloride increases until XKCl has reached 0.30. The activation energy then slowly falls to the limiting value for pure potassium chloride in an approximately linear manner.The deviations noted in the isotherms of equivalent conductivity agree with the predictions of Bloom and Heymann (23). A knowledge of the transport numbers of the individual ions is necessary for meaning-ful interpretation of the isotherms of activation energy.
INTRODUCTION
The early work of Kohlrausch, done prior to the year 1900, on the conductances of electrolytic solutions was followed by a considerable amount of data on this subject published by numerous investigators. In most cases the equipment and techniques were basically the same as those used by Kohlrauscn. In the year 1926, Morg~ and Lammert (l) reviewed the litera~ure and pointed out tha,t tho accuracy of all published data was much in doubt. They noted tna.t although many improvements had been made in individual parts of conductivity equipment and many sources of experimental error had been discovered, a comprehensive analysis of the whole experimental approach to the problem was lacking.
Two years later, in the first of a series of papers entitled 11The Mea~urement of the Qonductance of Electrolytes" by Dr. Grinnel Jones and his associates
(2,3
14,5,6,7,8,9,10), this analysis wasbe-gun. In the first paper Jones and Josephs (2), described an extremely complete investigation of sources of error in measurements of resist-ance using the alternating current Wheatstone Bridge and described the construction of a bridge in which no compo~ent had an inaccuracy greater than 0.001%.
Somewhat later, Shedlovsky (11) discussed in detail the sources of error due to capacitative shunts arxft.he principles behind adequ3te electrostatic shi~l9ing. Cell design and its importance was covered by Jones and G. Bollinger
(4)
and a discussion of alternating currentpolarization and attendant probl~s was presented by Jones and Cristian
(7).
Jo~es and D. Bollinger(8}
compared different criteria as tothe quality and su~i'ficiency of electrode platinization. The specific conductances o£ standard potassium chloride solutions at different temperatures were reported by Jones and Bradshaw (6) and are currently accepted as standards for determination of CGll constants.
The use of the cathodq ray oscilloscope a,s a null point detector for the conductivity bridge was described in papers by Horvoka and Mendenhall (12), Jones, Mysols, and Juda (10), and also by Haszeldine and Woolf
(13)
who included a discussion of the technique of balancing resistance and capacitance by reference to the elliptical trace pro-duced.LQrenz and Kalmus
(14),
Goodwin and Mailey (15), and Sandonnini (16,17,18) were among the earliest investigators of electrical con-ductivity in fused salts ardfused salt mixtures. Their data as well as later data of Kapman and Jae&_er (19), Biltz and KJ.enmi (20,21,22)Bloom and Heymann (23) in 1947 ~eviewed concepts earlier advanced by Frenkel, Schottky, Jost and others (24, ch. 2) that the expression
./ -~f4-U
~ : const. X exp w ~
relates
the~ecific
condUctivity({) of a solid salt at high temperatures to the number of lattice defects per cubic centimeter and their mobility when the conductivity is due to one type of ion only. In this expression the energy required to produce a single lattice defect is W and the energybarrier to migration is represented by U. The physical concept of a fused salt as a very disordered solid with large numbers of free ions allows one to take the W term as equal to zero. Assuming the additivity of conductivity we may rewrite the expression for a compound as
whore
c
1 and C2 reprasent the activation energies of ionic migration of tho two types of ions. The absolute temperature is T and R is thegas constant. This equation is identical in form with the one obtained
by substitution of A, the equivalent conductivity, for J(, tho specific conductivity.
I I 1 I
A
=
A1 X exp ( ... c1~) ~ A2. X exp ( ... C2./RT)I ~ •
The constants C and C in the equations are often denoted as En and
E
11respe
.
ctively •I I
Bloom and Heymann commented that if C1 and C2 were of almost equal
magnitude or if one was considerably larger than the other, the con-ductivity could be expressed quite well by the expression
A
;:
A X exp (-E:
/RT}t
and
EA
could be determined. The slope of the line on a logA
vs. 1/T plot would be equal to - E!/2~303R-After investigating a number of binary systems and reviewing pre-viously published data, Bloom and Heymann (23) advanced these general-izations~
L Conductivity isotherms of systems showing no evidence of inter-mediate compound fom.ation in the solid state generally exhibit mode:~ate
negative deviations from additivity. ·
2. In syste~ whose phase diagrams indicate the presence of
ISC-686
molten mixture. Conductivities will not be additive but rather, strong deviations from additivity are to be expected in the negative direction.
3.
For systems in •mich more than one intermediate compound is in-dicateq by the phase diagram, .more than one minimum is sometimes foundin conductivity isotherms at temperatures .close to the freezing point of the mixture.
A
minimum corresponding to an incongruently melting compound will disappear as the temperature is increased.4. Activation energies. near compositions corresponding .to unstable
intermediate compounds will have maximum values, the value of E ~
con-taining part of the energy of dissociation of the proposed complex. Such a maximum is not associated with compositions corresponding to
stable complexes. ·
5.
The position of the m~n~mum in the conductivity isotherm does not necessarily co'rrespond to the composition of the respective compound in the solid state.3
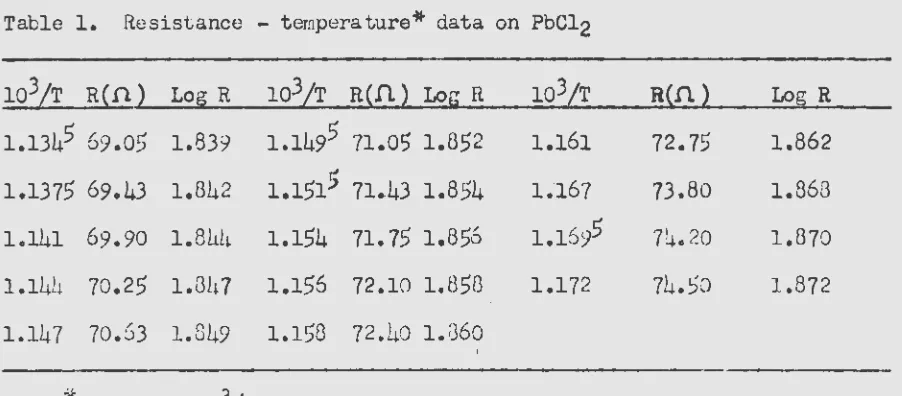
In the analysis of their data on one ,w:st~m £or example~Bl om and
suggested the existence of the complexes LCdCl~U and /CdCl · in
Heymann
the KCl=CdCl2 melt, the latter complex dissoci~ing some 30°' o 40° above the melting point of the compound CdC12•4KCl. They deduced the
existence of the complexes from the strong minima i,n the ·conductivity
isotherms (Figure 1) and their formulas from the phase diagram of the
system (Figure 2)q The instability of the latter complex was indicated
by the d.A / dT plot~:( Fi~re 3) •
~ ·. . ·'
In
1953,1).
a contr:ii..buti.on by Bloom, Knaggs, Molloy and Welch(25)
listed electrical conductivities and densities for eight systems.
Isotherms of equivalent conductivity (A) and activation energies of
ionic migration
(E!)
were plotted. In three systems showing nointer-mediate solid phase (NaN02-NaNO), CdCl2-Cdi2 and KI~aCl), isotherms
of A were found to be approximately linea:r- and values of E!' showed
no marked deviation from a constant value. Strong negative deviations
of
A
from ideality were found in the. three systems having corlgruentlymelting compounds· (KBr-BaBI'2..1l 28% deviation; LiCl..CdClz, 28% deviation;
and KCl-Nai,~~· 18% deviation). Incongruently melting compounds were found
in the systems Cdi2=KI and KN03-KBr. In the former the equivalent
conductivity isotherms deviatea strongly in a negative direction while
the activation energy was approximately constant. On the other hand,
in the latter system the conductivity isotherms were. alinost ideal but
the activation energies had a definite maximum at the composition Cdi2-JKI. They concluded that the properties of fused salt mixtures
-'e
0
-2.2
'e2.0
.s::;
0
-
>-~>1.8
~
(.)
::>
0
z
81.6
(.)
u..
0w
0..1.4
(/)
1.2
o
BLOOM AND HEYMANN
• THIS RESEARCH
0.0
0. 2
0.4
0.6
0.8
1.0
MOLE FRACTION POTASSIUM CHLORIDE
[image:10.564.58.486.86.587.2]..
ISC-686
-
(.)0 (.)
-
~w
_N0: 5CX) N ·
(.)
:::>
(.)"0
...
"0 (.)<t (.)
0::
w
a..
:?!
~400
.
.4
0.6
0.8
1.0
[image:11.566.123.466.69.330.2] [image:11.566.116.465.397.650.2]MOLE FRACTION POTASSIUM CHLDRIDE
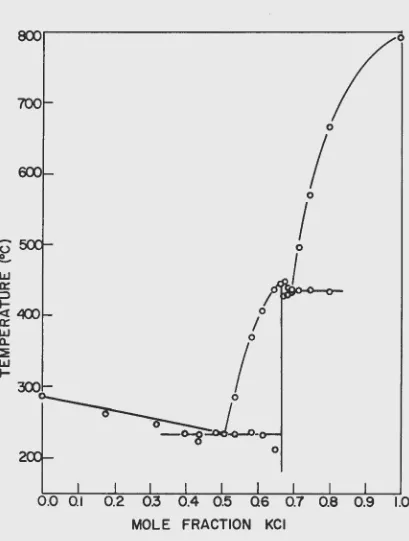
Figure 2. Phase diagram of the system KCl-CdCl?
0.14
0.12
dA
d
t
0.10
MOLE FRACTION POTASSIUM CHLORIDE
Figure ). Temperature coefficient of concfuctivity for the system KCl-CdCl2 (23)
Harrup and Heymann (26) in
1955
published conductivity data on the systems AgCl-AgBr, PbQl2-PbBr2, AgCl-PbCl2, AgCl-KCl and Agi3r-KBr~ They pointed out that the equivalent conductivity isotherms of all fiveshowed negative deviations from ideality although none of the phase dia-grams indicated the formation of intermediate phases. The first two exhibited solid solution formation over the complete composition range. Simple eutectics were found in the last three.
In the sMte year, the systems LiCl, KI and KI and
KCl-NaCl v•ere reexamined by Van Artsdalen and Yaffe (27). The first two systems showed distinct minima in the equivalent conductivity isotherms although no intermediate pha~ns were indicated by the phase diagrams.
The present research was begun in order to secure additional in-formation on the electrical properties of a fused salt system whoso
phase diagram indicatrd compound formation in the solid state. Reference w:as found to the existence of a compound 2KCl•ZnCl2 (28, Vol. IV, p.
551).
Since no prevtous work had been reported on the conductivity of this mixture in the fused state, research on the system was undP-rtaken.
EXPERIMENTAL
A. Conductivity Dptermin~tions
1. Description of apparatus
The equipment and apparatus necessary for the determination of conductivity data may conveniently be considered in three general
categories. The condllctivity cell is the first of these. The con-ductivity bridge and associated elements form the second, ~•hilo temper-ature controlling and teopertemper-ature measuring devices compose ~he last group.
a. The conductivity cell. After a determination of the order of magnitude of electrical conductivity in Pyrex glass at elevated temper-atures, the dip-type conductivity cell was rejected and a cell of the closed capillary type was selected for subsequent work. Many variations in the structure of the cell were considered and a number of these were tested. The final form of the cell a:; used in these determinations is shown in
Figure
5.
The factors affecting the construction of the cell will be considered.ISC~86
7
furnace it is desirable that the capillary portion of the cell occupy as small a volume as possible. It is also desirable to have the values of measured resistance always above a given value determinable on the
basis of error con3~derations. }urthermore, the diameter of the capillary cannot be made too small; for then a small amount of cell corrosion during a run could produce a large change in cell constant. Taking all of these factors into account, the capillary portion of the cell was constructed of six centimeter lengths of approximately
1.5
millimeter inside diameter ryrex tubing. This yielded cells whose constants were all in the rangeUoo
-t
100 cm"'l. ' ·1 . . . .
In the presence of water, zinc (II) chloride may hydrolyze and form the oxide which is yellow at high1~emperatures. I~ the oxide is treated with hydrogen chloride gas .~t is reconverted to
;
_
the
chloride and water vapor, the latter being ~xpelled from the melt~ The long arm of the cell extended out of the furnaye so that gas could be passed throu5h it into the cell. The bulb on the shdrt arm served two p~rposes. Itprevented expulsion of the melt from 'l;he cell during tbe'•p'ilssage of hydrogen chloride gas. It also allowed the use of larger. samples, thus making chemical analysis of the composition of the melt easier and more accurate. The bubbling of the hydrogen chloride gas prior to a run also insured the homogeneity of the melt. After measurement of the
electrical resistanc~ (R) at 2S.0°C. when filled with a ~.oooo demal potassium chloride solution, the cell constant (K) for each cell was calculated according to the relationship K
=
LR, where L is t~e specific conductivity of tho solution. The bridge was balanced as later described ! -!~at a frequency of 1000 cycl~s per second. The specific condlf.qpvity . value reported by Jones and Bradshaw
(6)
for an aqueous potass~um chlor~desolution under these conditions was used and the solution was prepared
accordin~ to their direct~ons •.
The "cell cons~nt11 is
a
function of thl.3 geometry of the cell a.ndis therefore subject to chango under any conditions which would cause
chant~e in the geometry of the cell. It is instructive to calculc~te·
the chan5o in cell constant caused by temperature variations.
Given: K2
5
= cell constant
at
25°C.
L
=
length of cell: at25°Co
C
=
coefficient of linear expansion of c.ell material-
L1L=CL.0.T-t:::. A : 7i 6 r2 :; 1i /J.r
4i=
t- (Lri=).7
=
2 ii r . Ll r- Z . .
The ( A r) term was dropped a._s infinitesimal in the simplification. The followin~ derivation is made in a straightforward manner with the
. subscript "t" referring to
a
centigrade temperature.1t_L ..
rt_
L"'Ct'"E'l'_
L Kt :At -
A f- 61r ... A t- 2 7i 1:'4 r - 11~
1 ..
CAT
1 .. 2C.ATSince C is such a small number1 it
iS
approximate~ true thatKt
=
K25
{f. ..
C A!/
The-cell constants wer~ calc~lated from data determined at 25°C. but the cells were later used at an average temperature of about 56ooc. resulting
in t>. T ~~& ·535°C. The correction ;('actor is thus (l -
cTT)
which amoQ.nts to 0.9982, and thi~ i~. the. correction applied to the data. It can be seen that .although strictly ~peaking a different factor can be applied to each temperatureon
the pot~ssium chloride -nne
(II) chloride ·determinations, they are
all
clos~ enough so that no appreciable error will be introduced by the use of tbi~ average factor. The value for the coefficient· of linear expansion of Pyrex glas~ used was 33 X lo-7.b. The conductivity bridge and associated eloments. The circuit diagram of the brid~e is shown
in
,t.l.gure"4.
It is patterned after the bridges used. by Jones and Joseph$ {2), Shedlovsky (11} and others.Complete descriptions of the theory behind and the operation of the alter-nating current cond.1~cti vi ty br;i.dge. are given
py
Jones and coworkers in the previously mentioned series o£ papers which is entitJ.ed "The Measure-ment of the Conductance of Elect:rolytes.n1 A disc~ssion of the use ofthe cathode ray oscillo$cope as a visual, null p.oint ;indicator is given by Haszeldine and Woolf (13) ·~ · · . . ,
The aurl.io-freq-ucmoy vacuum tube') oscillator used· was Hewlett-Packard Model 200-cR. It v~as connected through an isolation transforrner to a Leeds and Northrup Wheatsto~ U:ridge (Ty-pe S Test Set. No. 5300). The
DECADE
.
ISC-686
OSCILLOSCO
~FLECTIONPLATES
OSCILLATOR
[image:15.565.109.461.87.574.2]ONDENSER TEST SET
CELL
Figure
4.
The conductivity bridge: circuit and block diagramsISG-686 11
quency used was 1000 c,ycles per second in all cases since no appreciable
variation of resistance with frequency was noted. The waveform delivered by the oscillator was excellent as viewed on an oscilloscope. A Heathkit Decade Condenser Model DC-1 was used, to balance capacity in the bridge. The cat hod~ ray osc~lloscope us~d·a!3: ~. y~irual, null point indicator was a Heathkit Model o.-8 •. All ~onnecti~g leiads were shielded. ·-'~These shields and all of the instruments we~ connected to a cormnon ground.
Th~ electrodt:s were open cylinders of platinum-with a length of
three-eighths of an inch and a diameter of.three-sixteenths of an inch. They were each connected to.ten-irich platinum loads, The electrode~ were
platinized before use and as noted
'PY
other investigators, the platinum black was conv·erted to platinum grey. at elevated temperature~. One plati-num lead vras shorter than the other: to insure that the same ~ead was al-ways used in the samearm,
duringruns
as well as during determinations of cell constants·.I I ·>
c. Temperature controllin~ and measuring devices. The furnace'' (l<~gure 5) was of the' open tu.~~ type.. The eighteen~inch long length of two-inch alundum tubing was wound ·with resistance wire and insulated. with dicalite. The diameter of the furnace was about thirteen inches. · Temperature ~as controlled by a chromel...a.lumel thermocouplo mounted through the botto~ of the furnace a~d connected to a Brown Indicating
Controller operating through a proportioning motor. The chromal-alumel
indic~ting thermocouple was connected to a Leeds and Northrup No. 8662
Potentiometer with a reft?rence junction compensator. The thermocouple
was checked periodically for drift ag~inst a mercury thermometer in a constant t~mperat~re s~t bath maintained at about
275°C,
2. ExpE3rimontal procedure
a. Preparation of sarnplc. 11-Bakers Analyze¢ broken lump" zine
(II)
chloride meetineA. C. S.
specification~ was fused in a weigh~dPyrex test tube in th~ furnace at ~ temperature of about 400°C. The test tube was then transferred to an oven maintained at ll0°C. and the contents wore allovv-.ed to solidify. The test tube and contents were·~
then removed .(tom the oven, allowed 'to cool, and quickly weighed befo:re much water could be absorbed from the atmosphero by the hygroscopic ·
salt. A predetermined amount of Bak~r and Adamson reagent grade crystalline
potassium chloride was added and the mixture then returned to the
furnace. '
melt if any yellow zinc oxi1e was observed to be present. Otherwise the mixture was then poured from the test tube into a preheated cell. ~ydro
gen chloride gas was then passGd through the cell, thus completing the preparation of the sample. It was found that samples prepared with care had compositions within one p~rcent of desired values.
b. Resistance measurements. The Brown Controller was initially set so that the cell would attain a temperature of slightly more than 650°C., or approximately 652°Q. When this temperature was roached, the controller was raadjusted for a temperature about 10° less. This re-sulted in a very gradual temperature decline within the cell. The time rate of change of temperature was on approximately onedegree in five minutes. When the desired temperature ~ms roached on the cooling cycle, the resistance of the melt was measured at 1000 cycles per second by
the bridge, using an oscilloscope as a visual, null point detector. As soon as this reading was recorded, the controller was readjusted so that the temperature of the cell rose past the desired temperature at about the sa'!le slow rate. A resistance reading was recorded on this heating phase of the cycle. This cycling wa.s repeated at every t empet-ature for whj,.ch r~sistance rea±i.ngs were required.
To take a reading
of
resistanc~, the bridge was energized by a potentiometer located at tqe oscillator. An elliptical trace appeared on -the face of the ·cat!loc.e ray t~b~ a.nd by adjustment of tqe variable capacitor, a decade condenser, this ~l].ipse was flattened into a line. Next the variable resistm1ce was adjusted so that the line trace washorizontal. Under these conJitions tht3 balancing of the bridge was
complete~ and the cell resistance equalled the resistance of the variable resistor which \"M then read ~d rQcordcd. By this method. one could at
once determine whether or not the melt was in equilibrium with the
surroundint;s. The t~mperatu.re of the cell must always lag the temperature of tho f'u:rnacc, and to a larger degree than the slti,elded thermocouple whose heat capacity is considerably less. One would expe~t the ~easured
resistance on· the cooling part· to be less than on the heailing' part of the cycle since the resistance of the_ mel.t decroases with inc'reasing temper-ature. This lag also would be expected to become smaller and approach
~era as the rate of the cycling decreased and thermal equilibrium be-tween tqe cell, thermocouple
anq
surroundings was approached. Conse-quently if the resistance rea.~ngs on the heating and on the cooling parts of the cycle differed in the wrong direction or by unacceptably large values» the re<J.dings were repeated. The standardization of the potentiometer was checked before _ev~ry pair of readings.Isb-686 13
above its freezing point. The cell: was then removed from the furnace and its contents emptied into a weighed preheated crucible. The sample was then ready for analysis.
c. Analysis of sample. 1,2,diaminocyclohexane-tetraacetic acid (Al:roso Chemical Co., Providencr.:, Rhode Island), hereafter referred to
as CDTA, wan standardized agaj,.ns·~ zinc (II) chloride prepared by
re-action o! Bunker Hill brand electrolytic zinc with a minimum purity of
99.99
%
and Baker and Adamson hydrochloric acid in which the maximum heavy metal impurity was Q.OG08% • . rhe CDTA was used to ti:f:;:rate the zinc (II) ions in an aliquot of the; sample which had been removed ;from the crucible, dissolved in water and diluted to the ma~k in a volumetricflask. The titration was done in the presence of an ammonium hydroxide -ammonium chloride buffer, using as ~he ~ndiRator Eriochromeblack T from the Hach Chemical Company, Ames, Iowa, accotdiqg to the method of Loomis
(29).
Knowing the weight of the sample an~ the calculated weight of -the zinc (II) chloride, the weight of the potassium chloride was fouqrt by difference and the composition than:calculated in terms of mole fractions.
3.
Prelimina£1 investigations.a. EffectivenEass of sample analysis. For this exar.~ination, pure zinc (II) chloride was fused and purified as previously described. Three samples were removed on a weighed g+ass rod thrust into the melt. The rods and the salt solidified on the\ll'were then quickly weighed so that the true sample weight could be determined by difference. Aliquots of the three samples were analyzed as outlined above and the weights
of z-.inc (II) chloride in the original samples were .calculated. The average relative error in the calculated weights was:t 1.3
X
lo-3 whiyh wasless than the value of i-
J.S
X lo-3:which had been determined to be the r:taXimum relative orror. Usitlg ~his latter' value, the ma.'<:irnum relative error in the mole fractiah:of potassium chloride can be shown to bet.
6 X lo-3.b. Electrical conductivity in. gl'ass at elev~ted temperatures. A section of Pyrex capillary tubing was sealed on one end, then·
Calculation of the corresponding conductances through the walls
of the Pyrex tube at the differ·3nt temperatures showed that the conductivity became relatively large at high temperature~ and was in fact
disturb-ingly large even at
550°C.
When the magnitude of this conductivity was compared with the magnitude of conductivity to be expected in fusedsalts, it was decided to ab.;J.ndon the dip-type cell in favor of the U-shaped cell of the closed capillary type.
For example, a simple calculation will show what minimum resistance (Rg) the cell walls must have to insure that the introduced error is less than O.l't:
-1 -1 -1
R0
=
Rm ,. Rgwh~re
Rm'
the resistance due to the melt alone, is approximately 400 ohms. Let the observed resistance, R0 , equal 400 - 1% or399.6
ohms.The introduced error is negative since by providing an alternate path
for current flow the measured resistance will be decreased. The value of Rg in the above example is on the order of
u
X J,.05 ohms.. c. Stability of measurements of resistance with respect to time. The conductivity at a given temperature of a mixture of eiven composition would not be expected to vary with time •. However,· tne calculated con-ductivity is a function of many factore, some of which conceivably may not remain constant over the duration of a run. ·
Of
these factors, the one which is the most important is the cell constant. The second veryimportant factor which should be considered is composition. Changes with time in either of these variables would be reflected in changes in the measured resistance of the cell and melt. Accordingly the
ISC-686
calculated conductances and the chemical analyses wore thus not
sit;nifi-cantly affected by elapsed time in runs which were completed in five
hours.
d. Reinvestigation of some compounds and one binary ::>ystem. When
the final form of the conductivity cell had been. decided upon and all
of the c0r:1ponents of the apparatus asuemh1ed, data v1cre taken on some
compounds and one syster.1 which had been previ.,usly reported in the
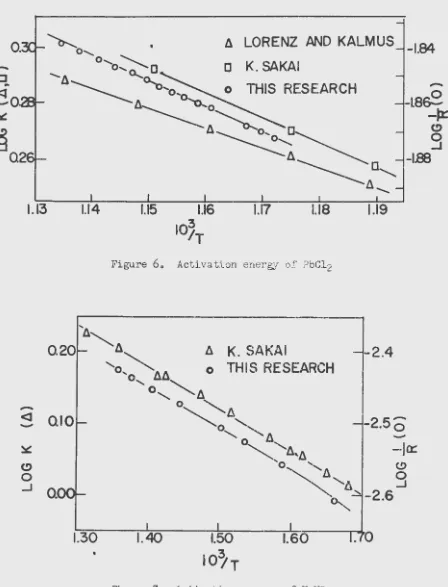
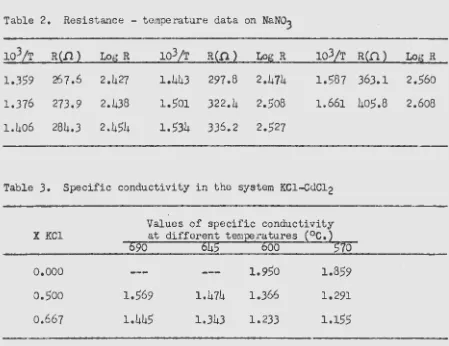
1iteratt~e. Lead (II) chloride was ~xamined initially and the data in
Table 1 obtained.
Table 1. Resistance - temperature* data on PbCl2
103/T R(D) Log R 103/T R(fi) LogR 103/T R(n) Log R
1.1345
69.05
1.839 1.149571.0~
1.852 1.161 72.75 1.8621.1375 69.43 1.842 1.151;) ~ 71.43 1.854 1.167 73.80 1.868
1.141 69.90 1.84!~ 1.154 71.75 1.856 1.1695 74.20 1.870
1.144 70.25 l.Gh7 1.156 72.10 1.8513 1.172 71~.50 1.872
1.147 70.63 1.849 1.158 72.40 1.1360
-)(
of 103/T are based on an of two reauin,sn.
Values average
Since the cell constant vms not determined, only a comparison of activation cenergies ma;}r be made with literature values. As was dis-cussed on page thrc;e, agrberrent in activation energies is reflected in agreement in the slopes of the lines I'Then tvm sets of data are plotted on a log R vs. 1/T graph. The above valu8s are reproduced in i.<'igure 6
where thG slope raay be compared with t~ose obtained by Lorenz and Kalmus
(14) and K. Sakai (30) on the same compound. A similar study on NaN03 yielded the data in Table 2.
These values are reproduced in ?igure 7 for comparison of the
activation ene1·by (slope) with that obtained by K. Sakai (30).
Bloom and Heymann(23) recently investigated the system potassium
chloride - cac.Jr.liLun (II) chloride •. As a •final check on the reliability
•
[image:21.564.61.512.205.403.2]-A
LORENZ AND KALMUS
c
K. SAKAl
o
THIS RESEARCH
1.13
1.14
1.17
1.18
1.19
Figure
6.
Activation energy of PbCl2r---
·---·--~-S
QIO
(!)
0 ...J
0.
1.30
-2.4
[image:22.561.57.505.90.677.2]1.40
1.60
figure
7.
Activation energy of NaN03-1.84
-ISC~86
of the apparatus and method, a conductivity study was made on this system. The data obtained are reproduced Ln Table 3 and the very close agreement between these values and those of Bloom and Heymann is shown
in li""igure 1.
Table 2. Resistance - temperature data on NaNo
3
103/T
R(.£1)
Log R
1.359
267.62.4.27
1.376
273.9
2.438
1.406
284.3
2.454
103/£
R(.!l)Log
R1.443
297.8
2.474
1.501
322.4
2.508
i.534
336.2
2.527
103/T
R(D )Log
R1.587 363.1
2.560
1.661 405.8
2.608
Table
3.
Specific conductivity in the system KCl-GdCl2Values of specific conductivity
X KC1 at different temperatures (°C.)
690
645
6oo
57o
o.ooo
o.5oo
0.667
1.569
1.445
1.474
1.343
1.950
1.366
1.233
B. Density Determinations
1.
Description of apparatus1.859
1.291
1.155
The apparatus used for density detenninations was essentially the same as that use(J by most other investigators. The melt was contained
17
in a tubular Pyrex container held on a platform. This platform was
[image:23.562.62.511.135.481.2]position co~ld be adjusted. The furnace had two one-half inch observation
windows on opposite sides sit~ated at the midpoint. Temperature control
and measurement were as descM,.oedin the previous section. An analytical balance was mounted above the furnace. A platinum wire attached to the left arm of the balance beam went through a small hole in the base of the balance case .and descended into the furnace. A platinum sinker at-tached to the lower end of the support wire swung freely.
The condensation of vapors of volatile salts on the suspension wire can cause ·serious errors in -detisj, ty determinations. The method of Peake and Bothwell (35) was used with success in combating this problem. A vertical Pyrex anticondensation tt.lbe about
50
em. long and 12 mm. in diameter surrounded the suspenSiQn wire and extended into the furnace to within about one iach of tl'$·me.J.t. Nea+ the top of the tube, which extended out of the furnace, a.''s:i.de arm allowed the introduction of air. Just above the sidearm the 12 mmq tubing was joined to a two inch piece of 8run.
tubing through a groundglass
joint. The slow moving air current prevented the entr.1 of vapors into the anti-condensation tube and their subsequent condensation upon the wire supporting the sinker. The modification consisting of ~he ground glass seal and the short length of8
mn. tubing served two purposes. The resulting constriction at the top insured an air flow down the tube and the grot.lnd glass seal permitted easy removal of th~ platinum sinker.2o Experiment~l procedure
The Pyrex container holding ~he sample was placed on the platform under the furnace and raised to the desired height by the elevating
screw. The te:npera.ture of the sample was raisGd to
450°C.
and eydrogm chloride gas was passed through the mel.t until it was transparent by visual-observation.The weight of the sinker and wire was measured in air
and
when temperature equilibrium na~. been attained, th~ sinker was lowered through the anti-condensation tube, held for a minute inside and near the end of the tube far tempe~~ture equilibration' then lowered intotru~ melt to a predetermined and constant depth. A tl~ee-eighths of an
..
ISC~86 19
A glass tube inserted through the anti-condensation tube after the weighing at 650° was used to remove a three or four gram sample for analysis.. A second sample was removed after the last weighing and the whole run was discarded if thE! difference in mole fraction of potassium chloride amounted to more than 0.5%. The run was also discarded if the initial measurement of density at 45ooc. differed from the second 450°0. m<lasurement by more than + 0.5%.
C.. Phase DiagrC:ttm Construction
The standard method of thermal analysis was used. A container of the sample was introduced into a small furnace and the temperature raised considerably above the melting point of the salt or salt mixture. The current to the furnace was then sh~t off, The homogeneity of the melt was maintained and uniform cooling aided by mechanical stirring of the melt provided ~y a motor with a Pyrex stirring rod which projected through the furnace lid into the melt • ·A. chromel-alumel thermocouple in a Pyrex sheath was immersed in the nelt also. A thermocouple reading was taken every sixty seconds until the salt had completely solidified. A sample removed from the melt before cooling had begun was analyzed
as previously described,
RESULTS
A. The Phase Diagram
A compound corresponding to the composition 2KCl'ZnC12 w~s re-ported by various investigators (28, Vol. IV, p. 551). Its existence has been confirmed by the method of thermal analysis, Cooling curves recorded at a number of different compositions yielded the data in Table 4 which has been reproduced graphically in Figure
8.
0
700
0
600
I
0
-
u
0I
~
I
0
I
0.0 0.1
1.0
[image:26.559.73.482.77.618.2]MOLE FRACTION KCI
..
ISC-686 21
Table 4. Cooling curve data for the syste11 ~Cl-ZnCl2
XKCl Temperature in °C. XKCl Temperature in oc.
Liguidus Eutectic LiSuidus Eutectic
o.ooo
*
28.5 0.612 406 2300.176 261 *It 0.646 436 209
0.316 247
**
0.66.5*
4430.39.5 233
**
0.673448
4270.434 2~3 230 0.683 439 426
0.481
*
234 0.695 436 430o • .5o6
*
231 0.714 494 4340 • .53.5 284 232 o. 7!~6 .568 434
0.582 369 234 o. 798
665
432'~ Cooling was n:)t carried to the eutectic temperature.
**
No liquidus break was noted.B. Specific Conductivity Values
Each cell constant wao determined at 25.0°C. and then the value of the cell constant at the rJlevated temperature was calculated according to the method on page 8. Specific conductivities (J{ ) were determined by the relationship
x
=
.JL
Rand are reproduced in Table
5.
The maximum relative error in there-ported values has been calculated to be t 0.0042. The errors associated with the temperature and composition for-vfhich the value of conductivity is reported are t: 2°G. and t 0.6% respectively.
C. Oensity Values
[image:27.564.64.512.73.281.2]Table
5.
Specific conductivity in
'
the system KCl-ZnCl2
'
Val~es
of specific conductivity
Mix-
XKC1
at
~lifferenttempera wres (°C.)
ture
650
625
.
600
575
550
525
500
475
16
o.ooo
0.365
0.306
0.253
0.203
o.159
0.122 0.090 o.o6J
15
0.080
0.598
0-529 0.462 0.401 0.344 0.290 0,240 0.196
4
0.176
0.750
0.686
o~623o.561
o.5oo
o.442 o.392 o.339
9
o. 284
1.001
0.939
o,882
o.822
o.754 o.689 o.623
o.56o
7
0.395
1.040
o.
98.~0.925
o.864 o.8oJ 0.741 o.686 0.621
ll
o.5o6
1.109
1.0.52 0.991 0,931 0.869 0.803 0.739 0.671
5
0.582
1.118
l.054
o.998
o.937 o.874 0.811 o.748 o.684
3
0.670
1.161
1.092 1,026 0.964 0.896 0.830
0.765
0.701
10
o. 722
l. 20?.
1..13.3
:
1.067 0.997 0,924
0.850
0,776 0.690
19
0.790
l.27'J
1.19.5 1~0280,884 0.772 0,67.5
0,587
0 • .512
12
0.834
1.259
l.J.7J
;
1.0.55 0.885 0.76'1
0.657 0.511
0.494
21.45 gm/cm3 by Kieffer and
Hotop(3l) and confirmed by the value of
2l.4h7
+-0.02 gm/cm3 fo®d
byAustin
(3,),Holborn and Day's (33) data
on the average coefficient of linea.r thermal expansion of
platinum
(Cl) 1rere reproducod almost ex:actly by Austin
(32)as is indicated in
Table 6. For the frollowing calculations a denGity of
21.45
6~/cm3and
the expansion data af
A~stinwere used. To a good approximation
C •
3C1 where
C
is the
a.verc:t~ecoefficient o.f C\lb;ic:al tl:lermal expansion.
Table 6. Average coefficieqt
o£ ~~pansiQnof platinum
.
.
.
Re,ference
c
1 X l06 (cm•1 deg•l)
betw~enooc. and toe.
t
=
45o
0c.
·
,5oo
0c.
.
55o
0c.
600°C.
65o
0c.
33
9.46
9.53
9.60
9.66
9.73
[image:28.563.51.495.85.384.2] [image:28.563.53.495.87.681.2]ISC-686 ,,· ..
According to the buoyancy method of.density deterflination it can be shown that at any temperature 11t11
where
.. ·
11m
... t
t t Ms.- Msm
l) Vs • Vm: ~
=
dtm 2) vt s
=
v20 (l ..c
f1 t)s
3) v2o
=
d2o Mss s
Vt is the volume of the sinker s
vt is the volume of melt displaced by the sinker
m
Mro
is the mass of the melt displaced~is the density of the·melt
M~ is the mass of the ~inker
M~m
is the apparent T.ass of the sinker when suspended in the meltC
is the average volume coefficient of expansion of the sinker material over the temperature rangA 20 - t°C.~t
=
t - 20 when t is in centigrade degrees d20 . s; ~s tho density of the sinker at 2o.o0c.
v2o s . ·~s the volume of the sinker at 2o.o0
c.
Combination of these three equations yieldst:. (
dzn
=
) (
by means of which the densities in Table
7
vYere calculated. 'l'he maximum relative error in the reported values of density is t 6 X lo-4. The errors associated with the temperature and composition for which theTable 7. Density in the s,ystem
KCl~nCl2XKCl
··t (°C.)Ms:-M~m
(grns)*
~(gms/cm3)
o.ooo
450
1,.9503
2.4$7
503
l.·9345
2.434
555
1.914$
2.405
593
.
1.9047
.
2.390
637
1..88;.3
2~)600.094
46
.
2
1.904?
.
2.399
So6
1.8893
. .2.377
548
l..Bno
2.351
6o~
l,.8$J.7
2.323674
J,. ..82)8
2.283
.
0.158
454
'
1.8803
2,369
462
.
1.8789
.
2.367
486
1 .. 8661
2~349504
1.8554
2.334
554
J..8342
2.304
S98
lf
.
8l37
2.276
646
•• 7952
.
. 2.249
660
l·7900
2~2420.313
45l
J. .. 7942
2,261
500
l. 7106
.
2.228
548
l.7517
2.201
60) 1.1~99
2,170
66l.
l-7009
2.13],
0.452
453
1.7058
2.150
494
.
1.6841
2.120
540
1.6662
2.094
591
l~6J9a2.058
645
1.6t43
2.022
o.639
442
1.5918
2.007
498
1.5687
1.974
.
.
554
1.5438
.
1.939
612
1.5196
1.906
658
1.4978
1.876
[image:30.567.51.505.46.732.2]ISC-6136 25
Table 7. (Continued)
XKCJ t '(0c.) Ms-ltsm gms
t (
)*'d~ (gms/cm3)
o.698 447 1.5468 1.950
500 1.5232 1,917
547 1.5023 1.888
596
1~4801 1.857649 1.4607 1.830
0.811 688 1.3483 1.687
7l5 1.3373 1.672
*Mass of sinker in air
=
16.8147 ~·densities are reported are 1J 2°0, and 1: 0.6%.
These density data were plotted on ~aph paper largo enough so that no additional error •rould be introdu,ced. Densities at intermediate temperatures for each composition were determined graphica;Lly from the linear density-tel:tporature b"raph. ne.~si ties at intermediate compositions were doter:nined by interpolation on tho r;raph of density vs. cornpoaition
at constant tAmporature. These values aro i'ound in Table 8.
Table 8. Calculated densities in the system KCl-ZnCl2
XKCl Values of density at different te!ilperatures (°C.)
650 625 600 575 550 525 500 475
0.000 2.358 2.370 2.383 2 .. 394 2.405 2.420 2.434 2 •. 447 0.080 2.305 2.319 2.333 2.345 2.358 2.371 2.385 2.399 0.176 2.234 2 .. 250 2.265 2. 280 2.295 2.310 2.325 2.343 0.284 2.153 2.169 2.1.85 2.200 2.215 2.232 2.249 2.267
0.395
2.o66 2.082 2.099 2.115 2.132 2.148 2.165 2.1830.506 1.981 1..997 2.01); 2.030 2.046 2.061 2.076 2 •. 094 0.582 1.924 1.939 1.954 1.970 1.985 2.000 2.015 2.032 0.670 1.848 1.864 1.880 1.896 1.912 1.926 1.940 1.956 0.722 l . 799 1.815 1.831 1.845 1.860 1.875 1.890 1.905
0.790 l.
735
*
*
*
*
*
*
*
[image:31.564.63.505.64.253.2] [image:31.564.60.508.405.608.2]D. Calculation of
A
andE~
l . Calculation oi'
A ,
the equiV'alent conductivi t;y;Conductance in electrolytes is a function of the number of ions
per unit volume. Consequently the quantity
A
was introduced to makepossible direct comparisons of the relativf.l conductivities of different
systems. The equivalent conductivity is defined such that
=
K
X
1000c
where Ve is the volume in cubic centimeters containing one equivalent
weight of electrolyte,
We
is the equivalent weight (or average equivalentweight) of the system and C is the concentration o! the electrolyte in
equiva~ents per liter,
~or the system KCl-ZnCl2
We • WznC12. " (WKCl '"'WznC12} XKCl
=
68.15 .. (74.56 ..,68 .. 15)
XKCl.::: 68.15 1- 6.41
XKCl
.
This relationship resulted in the calculated values !or We recorded in
Table
9.
.
XKCl
we
XKCl
We
XKcl
we
0.000 68.15 0.395 70.68 0.772 72.78
0.080 68.66 0.506 . 71.39 0.790 73.21
0.176 69.28 Q.$82
71.88
0.834 73.50ISC-686
The maximum relative error in We is detennined to
~e ~
5.6
X10-4
if the maximum relative error in composition is "'o.oo6.-.
-Using the relationship
A
*
K
X We/d. and the data in Tables5,
8
and 9, the values of A found in Table10
were calculated, The maxi-mum relative error is given by=
At<
"'
AWe .. AdWe ' d
-"'
Table
10.
Equivalent conductivity in the·· ::zy~tom KCl ... ZnC12XK'Cl Equivalent conductiviw
at
different temperatures (oc.)65o
625
6oo
575
55o
525
~oo475
o.ooo
10.55
8.80
7 •
.
23.5 •
.
78
'
4.Sl
3 • .43
2.50
1.76
o.oso
17.81 15.66 13.58
n.n
10,.00
0.41
6.90
5.60
0.1(6
23.26
2l~0819.o6
l7~0ql$.08 13,25 11.67 10.01
0.284
32.52 30.29 28,24 26.13
23.8J,
Z1.61 19.39 17.28
0.395
3tJ.58
33.33
31.13 2&,87
26,6~24.38 22.39
·
20.11
o.5o6
39.97 37.61 J5.1J
32.75
30.33 27,83
~5.4122.88
0.582
41.71
39.08
,
36.71
34.18
'
3l..64 29.15 26.69 24.19
0.670
45.51 42.43 39.52.: 36 .. 82 3,3.95
31.2228.57 25.97
0
}
. 722
48-64
45.45
42.40 39,33 36.16 33,00 29.87 26.36
"'
0.790
53~60*
*
...
'*
*
*
*
*
This temperaturo i;> below the liquidus on a temperature-composition diagram.27
Inserting the previously given values in the right side of tl1e above expression it is seen that the mp.ximum relative error in
A
is !:o.oo54.
2.. Calculation of E~ , the activation energy of ionic migration As developed in the introduction
[image:33.560.65.512.139.446.2]from 'Nhich log
A
=
log A-~X
E~
)
2.303 R
•
so that E"
=
2.303 X (slope) on a logA
vs. 1/-T plot. In Table 11 are activation energies determined at the midpoints of successive pairs of conductivity readings. The equation•
El\ • -(2.303) I (1.987)
X
ll (1/T)
A
(log]\)was u.sed
vn
th the assumption that the slope ~t the midpoint of a pair of points vvas the same as tho slope of the straight line through the points. This assumpt.ion is justified by noting that the deviation of the data thus plotted from linearity is in all cases less than the cx-pf;Jrimental error whqn a temperature range of only 25°C. is considered.Table 11. Activation energy of ionic migration in the system KCl-ZnCl2
Values
*
at differen~ temperatures (°C.)XKCl of Ett
637.5 587 •. 5 537.5 487
.s
o.ooo 12 .. 00 13.21 lh.39 16.23
o.oso
8.48
.
8.61 9.04 9.610.176
6.4
7 6.51 6 .. 68 7.030.284 4.68 4.58 5.06 5.2~
0.395 4.30 4.44 4.58 4.93
o.5o6 4.01 4.12 4.50 4.81
o.5t12 4.39 4.21 4.28 4.53
0.670 4.62 4.16 4.37 4.38
o.
722 4.47 4.42 4.77 5. 73•
The error in E ,.. is expressed by
/j 61/T
61/T
.. 6
·D. log ./1..!:::.log A
[image:34.564.45.487.313.606.2]ISC-686
leads to a relationship
6
Lj 1/T ~ +- 0.026
l/TUsing the value for
b./\/
A arrived at on page 28 'we see that4
E~ /E!=
~ 0.025.DISCUSSION
• It is instructi vo- to add to
t-he.
datal values o! I( , d1 A andE"- for pure potassium chloride~ · l~lthough the pure compound freezes above the temperature range examinea~ it .1o Ejtill of.' value to take data obtained from the m~J,.t a~ higher t~~peratures and extrapolate to the temperatures. in que.stion.
In
this. way itis po
.
ssibl.e
to examine data on the mixture~ for deviations .from. strictly addi t:i,ve relationships. Table 12 lists the extrapolation data as calculated from the indicatedsou~ces.
The literature also contains data
on
the density and specific conductivity of p\l.:re zinc(l!) chloride.
Co~arisop. between the re-sults of this rcse~rchand
i~tcrpolated literature values is made in Table 13.' I
The data reported in Tables
5
and3
together with the extrapolated values for potassium <;hloride a:re grapllicull;r .IJ:t'E~S~ni;.ed in li'igures 9and 10.
In the system KC::t.-ZnC12, th~ density isotherm~ are $omowha.t 11S11' shaped. They deviate from additivity in a. positive dj.rection at low potassium chloride concentratiogs and have the suggestion of a nega-tive deviation q.t loYi zinc (U) chloride concentrations~ Any quali-tative discussion of the shape of the isotherms which is based solely on the effect of mixing a. salt o£ ionic form l.nt With another of the type HX2. must applY in general to all such binary systems. Density isotherms in the system KCl.-MgC12: (,37) have a similar. 1
fS''
1 shape whilethe systems KCl-BaClz·
(36)
and Na.Cl .. MgClz 06) exhioit ohly the posi-tive deviations .from additivity in the vicinity qf pure MlC2• In thesystem KI-Cdi2:' (25}, densities have negative deviations near MX2 while
29
the systems KBr-Ba.Bra.· (2,5) ~nd LiCl..CdClz. (25) are approximately additive. It can be seen that no general trend i~ apparent.
-'e
0-
I1.2
E
~ 0-~
>
t-
0.8
(.) ~c
z
0(.)0.4
(.) LL U ·w
a..
I
650°
--.
--.
625°
\'
\.--·
600°
\
\
\ \
\ '.--.
\
575°
\ \
550°
\
--
.
.
\
\'
'
'
'
·--·
525°
' '•
'
--.
500°
'.--.
475°
en
°
·
0
o~--.O---o-'-.2----:-o-'-.
4---o...L. 6---=o=-'".
8-=---~1.0
[image:36.563.70.479.72.367.2]MOLE FRACTION POTASSIUM CHLORIDE
Figure
9.
Specific conductivity isotherms in KCl-ZnCl2 system2.4
-It)
E
0
2.2
'
E
at
->
t-en
z
2.0
~
1.8
0.2
MOLE
0.4
FRACTION
ISOTHERM
I
2
3
4
5
0.6
POTASSIUM
TEMP.(°C)
450
500
550
600
650
0.8
1.0
[image:36.563.68.477.374.685.2]CHLORIDE
ISC-686 _
Table 12. Data for KCl extrapolated from data at higher temperatures
Reference Quantity
extrapolated 650
Temperature 62.5 600
to which extrapolated (°C.)
575
550
525
500
31
475
3L~, 20
*
·
J( (n.
-;tern .. :)_) 1 ..844
1-778 1~ 7ll 1.643 1,$73 1.502 1,431 1.35835
d (gm/~m3) 1.595 1.610 1,626 1.642 1.657 1.672 1.688 1 .. 704....
*
Data from these sources were averaged.Table 13. Comparison of data on zinc (II) chloride
Reference Measured Val,u~ of mea$Ured quantity at di!!erent temperatures(0c.) guantit;z: t I .; 650 625 .. '600
575
550
525500
.
-tf75-' 4 •
'
20
X
(.Q ... lcm·l) 0~3J.2!),274
0,.236 0.198 0.156 0*120 0.084 o.o56This
K
(.Q .-lcm-l..) 0,.365 6,.;306 . Q.2$,;3 Pt203 0.159 . 0.122 0.090 0.063 research36 d (gro/cm3)
...
...
...
!tit . . ....
'2.4102.422
2:.434 2.447This d (gm/cm3) 2,~58 ~,.370
2.38)
2t394 2,40.5 2,420 2.434 2.447 researchThe behavior of isotherms
or
equivalent conductivity (see l'"igure 11) in the range 0.00 ( XKCl ( 0.30 is not far fr9m ideal~ Negative deviations from additivity begin at XKCl • 0.30ano
reach a maximum in the neighbor-hood of XKCl ~ 0 .. 71. Isotherms of A then begin to rise tmvard the extrapolated values for pure potassium chloride.. The large negative deviations from additivity exhibited by A isotherms and the minimum occurring in the neig-hborhood of thf? composition corresponding to :.2KCl-'lnCl~ are both il} ag}:'eernent wi;th the proposals of Bloom and Heymann
as outlined in the introduction, It is puzzling that the ne6ative
[image:37.566.53.544.61.461.2]I
g
I
ISOTHERM
TEMPERATURE (
0c )
NE
I
650
0
2
625
3
600
.£:
4
s15
I
0
5
550
-
6
525
~
7
500
>
8
475
t;40
~
~ ~
0 ~
z
0 (.)
~
~
.::>
5~
IJ
LLJ
n~----~----~----~----~-2.0
4.0
6.0
8.0
10
MOLE
FRACTION
POTASSIUM
CHLORIDE
l'~gure 11. Equivalent condllctivi ty isotherms in the system KCl..ZnC12
ISC-686
33As seen in tigure 12, only a slight change in
E:
is observed be-tween XKCl values of 1.00 and 0.30. This small change is linear in nature with the exception of values at XKcl=
0.722. At this concentrationthn points to varying degrees lie above a linear plot. A slow increase in
El
accompanies decreasing values of XKCl until XKCl has lowered to about 0.300 at which timeE1
begins a rapid rise to the value for pure zinc(II)
chloride.A
gross experimental error is the likely cause of the value ofE:
.
at XKCl=
0.672 (487.5°c.). At XKCl • 0.722, the high value forE~ at 487.5oc. is explained by the fact that this value was derived from~ values taken at temperatures below the initial freezing point of the mixture. The other three points at this mole fraction also lie somewhat above these otherwt~e linear portions of the isotherms. These data nevertheless conform to linearity within experimental error although high values could be a reflection of incipient crystallization in the melt. The initial freezing point of this composition is near 515°C.Recent work by Duke and Laity (38) assigns ionic transport numbers t~ and t_ of 0.25 and 0.75 respectively in lead
(II)
chloride at 565°C. These results lend experimental support to earlier predictions of a number of authors that alkali halides are predominantly cationic con-ductors while in tre alkaline earth halides tho anions carry a larger share of tho current. In the system KCl-ZnC12 presumably K~ dominatesA and ~ for pure KCl while Cl- dor(linates A and E;:_ for pure ZnCl2. An interesting proposal is that K~ dominates both J\ and E~
for the mixture in the range""0.30 ( XKCl <1.00 and that Cl .. begins to become imp9rtant at XKcl ; 0.301 increasingly dominating A and
E:
-
cu-
01
[image:40.563.55.639.52.486.2]E
...
z
0
t=s
~
-...
(.)
<t4
0.0
0.2
MOLE
0.4
FRACTION
SYMBOL
~
0
0
v
ISOTHERM
(•c)
637.5
587.5
537.5
487.5
0.6
POTASSIUM
0.8
CHLORIDE
Figure 12. Activation energy of ionic migration in the system KCl-ZnCl2
....
%%.:rJ
1.0
<,
H
(/)
0
~
co