OF
EUCALYPTUS AND OTHER SPECIES
Maria Tereza F. T. Alves
Thesis submitted for the degree of Master of Science
at the
Australian National University
Department of Forestry
I I
" Naturae enim non imperatur, nisi parendo.” ( Nature cannot be ordered about, except by obeying h e r)
ACKNOWLEDGEMENTS
Firstly, I would like to thank my supervisor Dr. Mike U. Slee for his advice and guidance throughout my studies. I am especially grateful for the patience he showed when changing my writing style into a proper scientific one.
Next , I would like to thank Ross Cunningham, Christine Donelly and Peta Frampton, from the Statistics Department, for their help with my statistics. I'm grateful for their introduction to the Genstat procedures.
I would also like to thank CSIRO, Division of Forestry and Forest Products for suppling the seeds for my experiments.
Then there are so many people in the Forestry Department at ANU who have somehow helped me with my work and to whom I would like to express my gratitude: To A. Carter, G. Serbov and Jim from the Plant Culture Facility (ANU) and D. Gawin for their assistance and help with my glasshouse experiments; To J. Marsh and K. Kelsey for their help with the soil analysis; To R. Jahnke, J. Lejins and all the other staff for being friendly and supportive. (The sound system was a good company while washing roots).
A special thanks goes to Kathy Callen and Paula Reid for their friendship and for always being there when I needed them. It was a pleasure to work with people who care and most importantly, people who know the books by the colour of their covers.
To Listya and all my colleagues of E.4 for their friendship and the pleasant times we had together.
To my very good friends from "104 Lewin st " and the rest of that "gang" that made my life smoother and easier here in Canberra. They are: The Borges
English especially sorting out my confusion between "in" and "on", and to Graciela Garcia for checking the bibliography.
I also must not forget my housemate Camila, who kept me healthy with her excellent home made meals that were always waiting ready and warm after a long day work.
I would like to thank the Commonwealth Secretariat (London) for providing the scholarship and I'm grateful to the Ministry of Agriculture for giving me the opportunity to benefit by it.
ABSTRACT
Firewood is the basic energy source for 60% of the urban population and most of the rural population of Maputo province (Mozambique). Accelerated forest degradation is further reducing the limited firewood supplies in the region. To fulfil fuel needs and exploit the existing resource in a sustainable way, plantations should be established in the area at a rate of 17000 ha/year.
Areas for forestry activities are limited to the marginal soils remaining after agriculture or livestock activities. Thus, working in such soils (mainly sandy soils with a grassy vegetation cover) the selection^ appropriate species and provenances allied with the use of appropriate silvicultural techniques is essential to guarantee adequate yield.
The studies described in this thesis have examined how growth of E.grandis and E.camaldulensis is affected by different silvicultural factors, initially in the field, and later with respect to the effects of water and weed competition, in glasshouse conditions, in Canberra. They revealed that:
(i) Factors which affect performance of Eucalyptus were more marked in E.grandis (a more demanding species) and least in the E.camaldulensis provenance from Petford. The negative effect of weeds was strong as they reduced both survival and growth. Thus, better land preparation allied with good weed control was effective in improving performance of both species;
different climatic regions may contribute to their successful establishment and performance in plantations: The provenance from the humid tropics (Petford) appeared to be the most suited to planting in a wide range of different environment conditions as it was the least affected by the adverse weed and low water treatments. There was evidence that it did not need to modify its root system to tolerate water stress; The three provenances from the dry tropics (Gilbert River, Manning Creek and Victoria River), had greater rootishoot ratios, yet were more affected by the stress treatments and so they may prefer areas with regular distribution of rainfall; The provenance from the temperate zone (Lake Albacutya), with the lowest rootishoot ratio, was not able to increase its root system in presence of weeds or with low water and, like the previous group, was adversely affected by such treatments.
V I I I
LIST O F A B B R E V IA T IO N S
A .N .U . A ustralia N atio n al U n iv ersity
auxil. auxiliary
carnal. c am a ld u le n sis cu.m . cubic m eter
CSIRO C o m m o n w ealth Scientific a n d In d u stria l
dbhob
Research O rg an isatio n
d iam eter at breast height ov er bark
D.N.F.F.B. N atio nal D irectorate of Forest a n d W ildlife
euc. eucalypt
Gilb. rv. G ilbert R iver grand.
ha
grandis hectare in h a b in h a b ita n t Lake Albac. Lake A lbacutya M ann. ck. M anning C reek M.O. organic m a tte r
Mt. m o u n ta in
N .C.Harb. N o rth Coffs H a rb o u r NSW N ew S o u th W ales
Petf. Petford
P.N .R . N atio n al R eforestation P ro g ra m m e p ro v en .
QLD.
p ro v e n a n c e Q u e e n sla n d
rv. riv e r
Vic. V ictoria
Vict.rv. V ictoria R iver W. of W and. W est of W andecla
wgt. w eight
TITLE i
STATEMENT OF ORIGINALITY iii
ACKNOWLEDGEMENTS iv
ABSTRACT v i
LIST OF ABBREVIATIONS v iii
TABLE OF CONTENTS ix
LIST OF TABLES xi
LIST OF FIGURES xiv
LIST OF APPENDICES xv
TABLE OF CONTENTS
INTRODUCTION 1
CHAPTER 1 3
1.1 LOCALIZATION AND GENERALITIES 3
1.1.2.Soils 10
1.1.3 Vegetation 13
1.1.4 Existing stock 17
1.2. FORESTRY PRODUCTS DEMAND 20
1.2.1 Existing plantation program m es 23 1.2.2 The ideal plantation target 26
1.3 THE PROPOSED SPECIES 29
1.3.1 The needs for research program m es 29 1.3.2 Review of research program m es 29 1.3.3 Sum m arized perform ance of the Eucalyptus
spp. trials. 32
CHAPTER 2 34
2.1 OBJECTIVES. 34
2.2 MATERIAL 35
2.3 RESULTS 43
2.3.1 Survival 43
2.3.2 H eight and diam eter grow th 46
2.3.3 The health condition of the trees. 55
2.3.4 Stem form quality of trees. 58
2.3.5 M aturity stage of the trees. 61
2.4 DISCUSSION 63
2.5 CONCLUSIONS 73
CHAPTER 3 74
3.1 THE FINDINGS OF THE FIELD STUDY. 74
3.2 THE RATIONALE FOR FURTHER STUDY 75
CHAPTER 4 78
4.1 THE PROPOSED STUDY 78
4.2 MATERIAL AND METHODS 79
X
4.3 RESULTS 102
4.3.1 Results of the first glasshouse experim ent 102 4.3.2 Results of the second glasshouse experim ent 112 4.4 DISCUSSION
4.4.1 Seedling size 123
4.4.2 The production of leaves 127
4.4.3 Dry m atter production 129
4.4.4 The partitioning of dry m atter 131 4.4.5 Allelopathy: a possible effect 136
CHAPTER 5 138
5.1 CONCLUSIONS 138
5.2 RECOMENDATIONS 140
REFERENCES 142
LIST OF TABLES
TABLE 1.1 Existing stock per forest type. 19
TABLE 1.2 The forest woodfuel biomass balance considering
ru ral consum ption alone. 23
TABLE 1.3 The % of the urban firewood needs to be supplied
from the existing eucalypt plantations. 25 TABLE 1.4 Plantation target for rural areas. 27 TABLE 1.5 Plantation target for urban areas. 28 TABLE 1.6 The established introduction trials and seed
production areas in the region since 1982. 31 TABLE 2.1 An example of the ANOVA for the height of the
trees at 6 m onths after planting. 42 TABLE 2.2 The accum ulated analysis of deviance for m ortality
at six m onths and four years after planting. 45
TABLE 2.3 Height analysis of variance. 47
TABLE 2.4 Diameter analysis of variance. 48 TABLE 2.5 Height increm ent analysis of variance. 49 TABLE 2.6 Diam eter increm ent analysis of variance. 50 TABLE 2.7 The accum ulated analysis of deviance for the
probability of Eucalyptus trees being healthy at three
and four years of age. 55
TABLE 2.8 The num ber of healthy trees in each of the three land preparation procedures at three
and four years of age. 57
TABLE 2.9 The accum ulated analysis of deviance for the significant effects (PcO.Ol) of species and land preparation on the stem from quality of eucalypt
trees at three and four years old. 58
TABLE 2.10 The percentage num ber of trees p e r each stem
form per species, at three and four years after planting. 59 TABLE 2.11 The effect of land preparation on the percentage
of trees per class of stem from three years old. 60 TABLE 2.12 The accum ulated analysis of deviance for the
significant m ain effects on the probability of eucalyptus trees being im m ature at three and four years
after planting 61
X I I
and E. grandis being immature at three and four
years old. 62
TABLE 2.14 The predicted probability of Eucalypt trees being immature by the effect of land preparation,
at three and four years after planting. 62 TABLE 4.1 The Eucalyptus species and provenances seed
sources. 80
TABLE 4.2 The amount of Eucalyptus seeds per species
and provenances used in the experiment. 81 TABLE 4.3 The glasshouse mean temperatures during
all the phases of seedling growth. 82
TABLE 4.4 The dates and total number of seedlings
germinated and produced. 83
TABLE 4.5 The dates of the assessments made. 87 TABLE 4.6 The dates of harvestings and respective
material collected. 88
TABLE 4.7 The chemical element content in the two
types of soil. 89
TABLE 4.8 The structure of the ANOVA with the source
of variation and the degrees of freedom. 91 TABLE 4.9 The seed sources and characteristics of the 5
provenances of E. camaldulensis used in the
experiment. 93
TABLE 4.10 The quantity of seeds sown per provenances, germination dates and final number of seedlings
produced in the second experiment. 94
TABLE 4.11 The glasshouses' conditions with the mean temperatures during the period of the second
experiment. 96
TABLE 4.12 The structure of the ANOVA for the second
glasshouse experiment. 101
TABLE 4.13 ANOVA table for the significant main effects
and interactions on the size of Eucalyptus seedlings. 103 TABLE 4.14 ANOVA table for the significant main effects
and interactions on the dry-weights of Eucalyptus
seedlings and weeds. 104
TABLE 4.15 The soil main effect on the dry-matter production
TABLE 4.16 The effect of soil type on dry-matter production of weeds when they are growing under different
Eucalyptus species and provenances. 108 TABLE 4.17 ANOVA for all the variables measured on the
22nd Nov. 1991 - the sixth measurement. 112 TABLE 4.18 The effect of water level on dry-matter
production of weeds. 116
TABLE 4.19 The effect of water level on dry-weight of weeds when growing along side of the five
[image:13.531.44.520.122.812.2]X I V LIST OF FIGURES
FIGURE 1.1 The location of Mozambique in the
south east of Africa and the studied region. 4
FIGURE 1.2 Hypsometric map . 5
FIGURE 1.3 The main rivers. 5
FIGURE 1.4 The climatic zones in the region. 7 FIGURE 1.5 The mean annual average temperature. 8
FIGURE 1.6 The mean annual rainfall. 9
FIGURE 1.7 The mean annual evapotranspiration. 9
FIGURE 1.8 The soil types. 12
FIGURE 1.9 The vegetation zones. 14
FIGURE 1.10 The different forest types. 15
FIGURE 1.11 The forecast biomass balance. 22
FIGURE 1.12 The adjusted total biomass. 22
FIGURE 1.13 Locations of eucalypt trials. 33
FIGURE 2.1 Layout of the field experiment. 41
FIGURE 2.2 The estimated probability curves for mortality. 44 FIGURE 2.3 The height and diameter growth on three
site preparation procedures. 52
FIGURE 2.4 The height 's current annual increment
affected by site preparation. 53
FIGURE 2.5 The land preparation and the species main
effects on diameter's current annual increment. 54 FIGURE 2.6 The effect of fertilizer on the health of the trees. 56 FIGURE 4.1 The layout design of the first glasshouse experiment. 86 FIGURE 4.2 The layout design of the second glasshouse
experiment. 98
FIGURE 4.3 The effects of soil and weed on the height
and diameter of eucalypt seedlings. 105
FIGURE 4.4 The effects of soil and weed on the number of
leaves and number of shoots of eucalypt seedlings. 106 FIGURE 4.5 The soil and weed interaction on the dry
weights of eucalypt seedlings. 107
FIGURE 4.6 Species and provenances differences on the dry
weights. 110
FIGURE 4.7 Species and provenances differences on the
FIGURE 4.8 The effects of water and weed on the size of
E. camaldulensis seedlings. 114
FIGURE 4.9 The effects of water and weed on the dry-matter
production of E. camaldulensis seedlings. 115 FIGURE 4.10 Provenance differences on the size of
E. camaldulensis. 118
FIGURE 4.11 Provenance differences on the dry-matter
production and allocation in E. camaldulensis. 119 FIGURE 4.12 The effect of water and weeds on the height,
no. of leaves and size of E. camaldulensis. 121 FIGURE 4.13 The effect of water and weeds on the total
dry-matter production and root:shoot ratio
of E. camaldulensis. 122
LIST OF APPENDICES
Appendix I. Climatological data. 153
Appendix
n.
Forecast of biomass balance. 155INTRODUCTION
Maputo province, the southern province of Mozambique, is also the most populated. Because of the high population density, the pressure upon the native forests for firewood is very heavy. 60% of the energy consumed by the urban population and most of the energy consumed by the rural population comes from firewood.
Due to over-exploitation of the forest resources in the past, the native forests nowadays are of low productivity. Consequently, in supplying the high demand on firewood, the resources have been rapidly depleted, especially near the urban areas.
A huge plantation programme is needed to overcome this situation and to protect native areas or to utilize them on a sustainable basis. Land is available and easy to work as it is formed mainly of coastal plains no higher than 200 m above sea level. However, the majority of the soils are sandy, the area receives low and irregular rainfall and it is covered with grassy vegetation.
Nevertheless it is already possible to identify species suitable for implementing such a programme. Trials have shown the potential of four Eucalyptus species; E.camaldulensis, E.tereticornis, E.brassiana, and E.grandis (although this latter needs its survival rate improved).
The present study outlines the need for the plantations and examines some of the silvicultural factors that limit successful establishment of eucalypt plantations in Maputo.
Therefore, Chapter One gives a general picture of Maputo province. Its location, climate, soils, vegetation cover and existing stock make the first part of this chapter. Then, the demand on firewood allied with the available biomass of native forest and existing plantations stresses the need for establishing new planting areas with fast growing species. Finally, the identification of suitable species and silvicultural practices are highlighted.
A field experiment was established to compare performance of the two most widely planted species - E.grandis and E.camaldulensis - with different site preparation techniques. Chapter Two deals with the results and discussion of this experiment.
Chapter Three summarizes the conclusions of the field experiment and highlights the need for more detailed examination of the effect of soil, weed competition and water on the performance of Eucalyptus species. As part of this study, two glasshouses experiments were established. These are detailed in Chapter Four.
3
(CMAIPTTEM TI
General description of the region
1.1. LOCALIZATION AND GENERALITIES
M aputo province - in Mozambique - has an area of 26 000 km2 (3.3% of the country) and is situated between the parallels 24° and 26ö S Latitude and the meridians 32° and 33° E Longitude. It is bounded to the north by Gaza province (Mozambique), to the south and west by South Africa and Swaziland and to the east by the Indian Ocean (Figure 1.1).
Maputo is the most densely populated province in Mozambique with 1.4 million inhabitants (10.6% of the total), on which 500 000 are rural (36%) and 900 000 are urban (64%), with a density of 20 and 1500 inhab/km 2, respectively. Population density for the country as a whole is 16.6 inhab/km2 (CNP statistics, 1985).
The province is generally coastal plains of altitude less than 200 m. The exception is the Libombos Mountains chain, in the south-west, where the altitude is more than 500 m (the highest point is 800 m) (Figure 1.2).
There are two main rivers in the area: the Incomati river which originates in Transval Province (RSA) and the Maputo river which originates in Swaziland. Other rivers to be found in the region are the Sabie, Umbeluzi, Tembe and Matola (Figure 1.3).
FIGURE 1.1: The location of Mozambique in the south east of Africa and the studied region in the south. (Source: Anonymous, 1986)
G u l f o f G u i n e a T "
ii> jAö'föSTi mhnoH
ahg o u t ~ r ~ \ ^
\ \ j / Z A H »Ll
j \ \ I I H I U W I
J »BOTSWANA.. I )
\ S OUTH ,7£uo
) AFRICA / t o w n .
^ — ' ~ r ~ ' ---
H-The area: Maputo province limited to the north by Gaza province, to the south and west by Swaziland and South Africa and to the east by the Indian Ocean.
FIGURE 1.2: Hypsometric map showing the three altitude zones in the region. (Source: Reddy, 1984)
1.1.1. Climate The climatic zones:
The region is subtropical having, in general, a wet and dry zone with the wet areas concentrated along the coast and in the higher altitudes of the Libombos Mountains. Reddy (1984, 1986) used a modified Thomthwaite’s moisture index (which uses the mean annual values of rainfall and potential evapotranspiration), to distinguish five different climatic zones from the inland to the coast (Figure 1.4). They are:
• Arid zone: areas with a dry winter and low rainfall (< 500 mm); • Dry semi-arid zone: with deficient rainfall all the year;
• Wet semi-arid zone: with deficient rainfall during winter;
• Dry sub-humid zone: confined to the coast, with higher rainfall (800 mm to 1000 mm);
• Wet sub-humid zone: located in the elevated areas of the Libombos Mt., without a dry season.
Temperature (rC):
7
FIGURE 1.4: The distribution of climatic zones in the region according to a modified Thomthwaite's moisture index. (Source: Reddy, 1984).
-24*S
—— 2 5 — Moisture inde* (%) R-PE
INHAMBAN6 * Moisture Inda* - 100
R — Mean annual rainfall
PE - Mean annual potential evapotranspiration Limit (X)
7 7
XAI-XAI / / A
/ 1 /
-75 to -50 -50 to -25 MAPUTO
-25 to 0 0 lo 25
Rainfall (mm):
Overall the rainfall pattem shows a sea-to-inland decrease from 1000 mm to 500 mm and 900 mm in the more elevated areas (Figure 1.6). However, it can be very variable. Reddy (1984) estimated a coefficient of variation of 30%.
Other climatic characteristics:
The mean annual relative humidity decreases from 75% on the coast to 65% in the inland, revealing a constant humid atmosphere throughout the year.
[image:23.531.26.523.253.808.2]Table 1-Appendix I shows the means of the climatological data observed in some of the meteorological stations located in the region (Figure I.l-Appendix I) over a period of 20 to 31 years.
FIGURE 1.6. The lines for the mean annual rainfall (mm) and the respective coefficient of variation. (Source: Reddy, 1984)
9
-2 4 *S
Inhambane
Nhacoongo
Xai-Xai
Maputo linhama
— 900— Mean annual rainfall (mm)
— 23 — Coefficient of variation of annual rainfall (%)
1.1.2. Soils
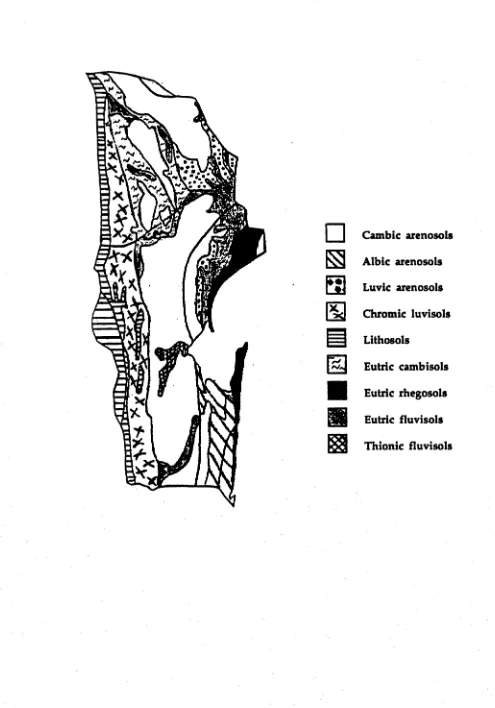
Six types of soil can be distinguished in Maputo province according to the FAO/UNESCO classification of Voortman and Spiers (1982). Figure 1.8 shows the different soils of the region.
The majority of the soils in the study area belong to the ARENOSOLS group. Occurring from the littoral to near the tableland of the Libombos Mt., they are poorly differentiated sands and highly weathered. The soils are formed by old dunes already fixed and alluvions from the Quartenary, with less than 15% clay and a pallid A horizon low in organic carbon. This group is subdivided into:
Cambic arenosols: the major soil unit of the region. It predominates in the drier and central areas with light colours from yellow to brown and grey. T hese soils in clu d e
£>rM3
sediments of calcariou^ and have less organic matter than the albic arenosols. They have a coarse texture with more than 65% sand, 10% of which is bleached sand. They are very well drained, with depths greater than 1 m and of low/medium fertility and pH from neutral to acid (5.5 - 7.5).
(ii) Albic arenosols: located in the south coast, originating from granites or gneiss. They have good drainage and depths/more than 1 m. Sometimes, the surface horizon is rich in debris
(iii) Luvic arenosols: occurring in small areas north of Maputo, along Incomati river and north of Incomati river, these are poorly developed soils red in colour derived from ferruginou^and coarse in texture with 65% sand (sandy-loam). Very well drained, they are deeper than 1 m with low to medium fertility (better than the first type), and pH from neutral to acid. The superficial horizon is rich in organic debris that is hardly decomposed, if at all, with
approximately 0.6% O.M..
Occupying a long strip along the eastern Libombos Mountains' tableland, are the LUVISOLS (chromic luvisols). From the Karroo Super-Grouped and basalts Jurassic formations (from the Stormberg series) they are dark-red to black clay soils. They originated from basic eruptive rocks, with an argilluvic B horizon
of
characterized by the alluvial accumulation of clay. With depth^m ore than 1 m, these soils have a medium/fine texture (with more than 35% clay) and are well drained. They are acidic with a medium fertility.
The LITH O SO LS are observed on the top and slopes of the Libombos Mt.. Derived from consolidate material of rhyolites they constitute the volcanic complex of the Libombos. With depths less than 1 m, they are stony with solid rock below the superficial horizon. The small superficial horizon has a coarse to medium texture (clay), is red to brown in colour and has a pH from acid to neutral They have good water holding capacity.
FIGURE 1.8: The main soil types of Maputo province. (Adapted from Voortman and Spiers, 1982).
Cambic arenosols Albic arenosols Luvic arenosols Chromic luvisols Lithosols
1.1.3. V egetation
The forests have been classified by (i) climatic characteristics (Pedro and Barbosa, 1955; Soares and Barreto, n.d.), (ii) eco-physiological conditions and flora composition (Wild and Barbosa, 1968) and lately, (iii) by a combination of the above with the description of density levels and structure of the different tree strata (Malleux, 1980).
According to Malleux (1980), including the mangroves and the sand dunes, about 79% of the total area of Maputo province is covered with secondary forest varying from "low medium-dense forest or open forest" to "thicket", "savanna" and "grassland" formations. These can all be considered as secondary forests because of the over-exploitation that has occurred in the past, but are composed of some commercially-valuable species such as Afzelia quanzensis, Pterocarpus angolensis, Combretum molhe, Terminalia sericea, Strychnos spp., Albizia versicolor, Acacia spp., Spirostachys africana and Bauhinia spp. Other species of a socio-traditional importance for their fruits and seeds, such as Dialium schlechten, Strychnos innocua, Sclerocarya birrea, Strychnos spinosa and Hyphaene crinita also occur.
FIGURE 1.9: The eight vegetation zones identified in Maputo province. (Source: D.N.F.F.B., 1985).
thicket forest / grassland low dense forest / shrub savanna open forest / tree savanna shrub savanna
open savanna / grassland
grassland with patches of evergreen open forest
thicket / open savanna mangrove
FIGURE 1.10;. The different forest types (from 2.2 to 4.2) distinguished in M aputo (Source: M alleux, 1980).
LOW - DENSE FOREST (50 - 60 % cover)
OPEN FOREST
(less 50 % cover) r o
t
! w o
*0
rt>
3
3*
nj
DENSE THICKET FOREST
(30 % cover)
SH R U B /T H O R N SAVANNA (1 0 -1 5 % cover)
OPEN SAVANNA
Zone 1: The south littoral zone, also called the coastal-savanna mosaic zone,
is mainly composed of a thicket forest; mosaics of open forest with trees on the top of the older fixed dunes and savanna with a dominant grass layer with widely scattered trees and shrubs. There are also some swamp grasslands in the temporarily flooded areas. Species common in the area are: Sclerocarya birrea, Terminalia sericea, Albizia versicolor and A.adiantifolia, Afzelia quanzensis, Garcinia livingstonei and Strychnos spp. They correspond to the types 3.1 to 4.2 and 2.3 locally, referred to in Figure 1.10 and Table 1.1.
Zone 2: The central zone of Maputo and Incomati, has patches of low
medium-dense forests and open forests, and shrub-thorn savanna with scattered trees. Patches of grassland are observed in depressions. The grass layer can reach 1.5 to 3.5 m high. In addition to the species referred in the previous zone, Combretum spp., Vangueria spp. and Syzygium cordatum grow in depressions. Types 2.2,2.3,3.2, and 3.1.
Zone 3: The interior zone with a narrow and long strip of a semi-deciduous
open forest with a superior strata, an intermediate strata and a well defined grass layer. Pteleopsis myrtifolia, Spirostachys africana, Afzelia quanzensis, Balanites maughamii, Entandophragma caudatum and Euphorbia spp. grow in mosaics of thorn-savanna with Acacia, Spirostachys, Terminalia, Sclerocarya and Strychnos species. Types 2.3 and 3.2.
Zone 4: The Libombos plateau zone with shrub-savanna and scattered trees,
17 Zone 5; The slopes of the Libombos Mountains are covered with open shrub-savanna and patches of open forest with Pterocarpus, Combretum, Sclerocarya, Acacia, Lannea and Bauhinia species predominantly. Types 3.3 and 4.1 and locally type 23.
Zone 6; The high Libombos zone with altitudes above 500 m is mainly composed of low grassland and patches of evergreen open forests on the slopes, with a predominance of Uapaca spp. Type 4.1.
Zone 7: The Littoral north zone with tree savanna, an intermediate shrub layer and grassland. The common species are: Afzelia quanzensis, Sclerocarya caffra, Dialium schlechten, Trichilia emetica, Albizia adiantifolia and A.versicolor, Garcinia livingstonei, Strychnos spp., Combretum spp., Phoenix reclinata, Guibourtia spp., Syzygium cordatum and Mimusops spp. Type 3.1.
Zone 8 : The Mangrove zone, found in the tidal zone and shores of Maputo river estuary and on Inhaca Island, are composed of halophyte shrubs or small trees such as: Avicennia marina, Rhyzophora mucronata, Bruguiera cylindrica, Sonneratia alba, Heritiera littoralis and Lumnitzera racemosa.
1.1.4. Existing stock
(Kir, 1984; Malleux, 1980; Ferreira de Castro, 1978).
The 1980 inventory of the Mozambique forestry resources by Malleux (1980) showed 79% of Maputo province to be covered with some kind of vegetation. The forest types ranged from low-medium dense forest (type 2.2), open forest (type 2.3) and thicket forest (type 3.1) - the commercial forests -, to savanna and grassland formations (from types 3.2 to 4.2) - the agroforestrv potential areas (Table 1.1). Other types were mangrove and dunes vegetation.
Commercial forests cover only 24.5 % of the area (650 000 ha). The forests are classified "commercial" regarding their volume, presence and frequency of commercial and valuable species (Kir, 1984; Kalberg, 1986). This area is further subdivided into: (i) forest areas with medium potential (or medium productivity) of 120 000 ha representing a mean volume of 81.8 cu.m./ha and, (ii) forest areas with low potential (or low productivity) of 530 000 ha representing a mean volume of 50.6 cu.m./ha.
The remaining area is classified as (i) areas with forestry or agroforestry potential comprising 1.25 million ha with a mean volume of 26.2 cu.m./ha, (ii) areas with wildlife and livestock potential comprising 190 000 ha and, (iii) areas with mangroves and dunes vegetation comprising 11 000 ha.
t a b u . 1 . 1 : T h e e x is ti n g st o ck in 1 9 8 0 pe r fo re st t y p e (M a ll eu x , 1 9 8 0 ). 19
3 1
2 I 8 9 7 9 9 .6 2 6 6 6 1 .7 3 6 .4 6 1 3 2 4 6
7 * 8«!
3
JM E (1 0 0 0 cu. I to ta l I ov er 2 5 cm 55 9 2 3 1 0 1 2 9 .4 1 5 7 2 1
.7 ♦ *
1 5 7 2 1 .7 T O T A L V O U to ta l v a lu a b le sp. * ♦ 2 0 0
6 * *
2 0 0 6 M ean c u m /h a 8 1 .8 5 0 .6 5
6 CNvO *
2
3 .23
MI
=
S
M
2 1 5 .6 4 3 2 .4 648 # *
1 B L E S P E C ] O V E R cum /h a 1 .8 2 0 .8 2
1 • #
•O F V A L U A > cm dbho b to ta l • • 1 3 5
8 * *
1 3 5 8 VO L U M I O V ER 2 1 c u m /h a
. 3 • *
1 i
J
8
»8
a
5a
• • 5 2 0 0 .9 (1 0 0 0 cu. m . O V E R « c u m /h a
R ^ oj
so 3 s * #
V O L U M E cm d b h o b to ta
l aq eq
i
i 1
* » 10521O VER 2 5 c u m /h a 2 9 .9 4 1 3 .1 5 1
7 » #
i - s ^
a 3
46
.9 7.1
5
4 3 R
A R E A AR EA
2 S 5
1
i 1
22 0 8 5 .1 F O R E S T T Y P E L C O M M E R C IA L F O R E S T O R P R O D U C T IV E fP B E S T S ; Me d iu m p o te n tia li ty or m e d iu m p r o d u c ti v it y .. .. (2 3 ) Low p ot en ti al it y or lo w p r o d u c ti v e ... (2 3 /3 .1 ) S UB -T OT AL fo res ts n . ACRO - SI L V O -PA STO RA L P O TE N TI AL Area s w it h fore st an d agro-fo re st p o te n ti a l. . (3 3 /3 3 /4 .1 ) A re as w it h w il d li fe an d li v es to ck p o te n ti a l ___ (4 3 ) SUB -T OT AL § < 1 a C S a 2
i
U <2c TO
1.2. FORESTRY PRODUCTS DEMAND
The forestry sector plays a fundamental role in Mozambique's National Development Strategy as it provides goods and public services to the population and supports agriculture and industrial development and environment protection. In 1984, the forestry sector contributed 1.3% of the total export values achieved by the country and was ranked as the eighth export product out of 19 (CNP, 1985). But the export status has been declining and the current target (DNFFB, 1990) is to increase this value to 2.6% (short term strategy) and 7.4% (long term strategy). This would re-establish the 1981 and 1975 levels, respectively. Only a small portion of the total wood production comprises industrial roundwood (Kir, 1984). Most is utilized as firewood and small building materials. Firewood is the main source of energy for much of the urban population and also some industries (60%) as well as the rural population (Pereira and Mansur, 1988). Therefore, 80% of the total energy consumed in the country comes from firewood and of this, 81% is for domestic consumption and the remainder for industry and agriculture (18% and 1%, respectively) (GTA, 1990).
21
The consumption of firewood is dependent on availability. In 1984, the Eduardo Mondlane University (cited by Pereira et al, n.d.) in a study of four communal villages found firewood consumption varied from 0.5 to 1.3 cu.m ./person/yr depending on the ease of access to firewood. One village with firewood nearby had a consumption of 0.9 cu.m ./person/yr whilst another with difficult access to firewood had a consumption of only 0.5 cu.m./person/yr. The estimate was an overall need of 0.8 cu.m ./person/yr but this would increase in areas with a good supply of the product. Urban firewood consumption was estimated at 0.7 cu.m./person/yr.
Maputo province with a rural population of 500 000 and an urban population of 900 000, is having its forest resources depleted by the need for firewood. Table
n.l-Appendix II estimates the total firewood needs for both rural and urban population to year 2002, calculates the overall available volume (from native forests - based on the 1980’s existent biomass estimated by Malleux, 1980 - and plantations) and forecasts the forest biomass balance of the province (i.e., the difference between the available volume and the needs). The result is summarized in Figures 1.11 and 1.12. Because of the low productivity of the existing forests in the region, the negative balance increases with time (Figure 1.11). The calculation estimates that in the year 2002 the biomass will have been reduced to 71% of that existing in 1980 (Figure 1.12). This reduction will be aggravated if plantations are not established from year 1992 onward.
V
O
L
UM
E
(
1
0
0
0
c
u
m
.)
K
V
O
L
U
M
E
(1
0
0
0
c
u
m
.)
FIGURE 1.11: The forecast biomass balance considering the total available volume and the total rural and urban firewood needs based on the assumptions detailed on Table II.l- Appendix II.
total available volum e E%j total n e e d s
| b alan ce
YEARS
»LIRE 1.12: The adjusted total biomass considering the initial existent stock in 1980 (Malleux, 1980), the growing stock and volume of native forests and plantations respectively and, the balance.
See Table II.1 - Appendix II for detailed calculations and assumptions.
4.0 x10 4
3.0 x10 4
2.0x10 4
1.0x10 4
0
2 3
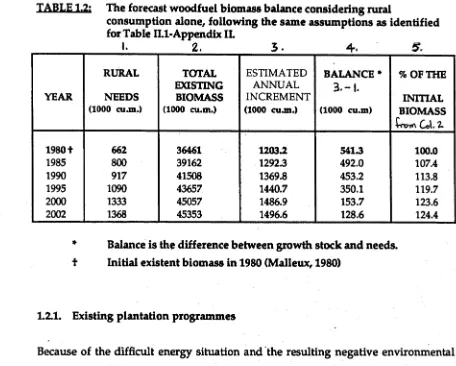
TABLE 1.2: The forecast wood fuel biomass balance considering rural
consumption alone, following the same assumptions as identified for Table II.1-Appendix IL
1 . 2. 3 . 4. 5.
RURAL TOTAL ESTIM ATED BALANCE * % OF THE
EXISTING A N N U A L 3.-1.
YEAR NEEDS BIOMASS IN C R EM EN T INITIAL
(1000 cu.m.) (1000 cu.m.) (1000 cujn.) (1000 cu.m) BIOMASS
t ’O P'rT V Col- 2 .
1 9 8 0 1 662 36461 1203.2 5413 100.0
1985 800 39162 1292.3 492.0 107.4
1990 917 41508 1369.8 453.2 113.8
1995 1090 43657 1440.7 350.1 119.7
2000 1333 45057 1486.9 153.7 123.6
2002 1368 45353 1496.6 128.6 124.4
* Balance is the difference between growth stock and needs, t Initial existent biomass in 1980 (Malleux, 1980)
1.2.1. Existing plantation programmes
Because of the difficult energy situation and the resulting negative environmental effects, a big effort is being made to increase the forest area and wood volume through the establishment of plantations of fast growing species. The final objective is to supply the energy demand through the use of the resources on a renewable basis.
The Mozambique forestry policy emphasises the use of the forest resources for supply of the basic needs of the population as well as the country’s economic development The strategy is to achieve targets through:
(i) Reforestation programmes for energy purposes - using large scale plantations with fast growing species around cities, and forest extension activities in the rural areas with multi-purpose species.
(ii) * Reforestation programmes for forestry industrial development.
According to a land use classification based on the use of the soil for agriculture (Pereira et al., n.d.), the afforestation potential for Maputo province is estimated to be 15% of the total area of the province, i.e., approximately 395 000 ha. Therefore, land area is not a limiting factor for the development of afforestation programmes to fulfil the objectives above. The main constraints to the programmes are the lack of security in the rural areas, the lack of financial support, lack of known species, lack of knowledge of silvicultural practices, lack of skilled personnel and lack of experience to deal with agro-forestry schemes.
Despite the constraints, the following man-made plantations have been established in the region (PNR's annual reports):
• 4 082 ha of eucalypt plantations for firewood purposes established around Maputo city to supply urban needs. Most of the area was planted after 1978. Only 500 ha were established before that date. Of these only 1588 ha can, at this time, be exploited.
• 1 567 ha of plantation mainly for wood industry and poles purposes in areas near Maputo city. Of these 64% are Eucalyptus spp., 14% Pinus spp., 10.% Juniperus spp., 6% Casuarina spp. and 6% others. Most of these plantations
(approximately 53%) were established before 1978.
• 560 ha established with some of the valuable native species as an experimental activity. This area was planted in the 1930's.
25 The initial target was to establish a total of 25 000 ha of fast growing plantations, within a radius of 30 km from Maputo, to supply 60% of the urban needs of firewood (Pereira and Mansur, 1988). This target was not achieved due firstly to several economic and political reasons. The initial targets were set too high to supply the needs without considering the lack of expertise in both managerial and technical activities. Secondly, a very low average survival rate was obtained in the early years of the plantations. This was due to poor quality of the seedlings, low rainfall in some years, use of unsuitable species and substantial losses from fires.
The productivity of fuelwood plantations must be maximised with the choice of the right species, better cultural practices and improved fire protection. In addition, the introduction of agro-forestry schemes in rural and semi-urban areas and the training of forestry personnel is expected to increase the forest area and improve the quality and productivity of the plantations.
TABLE 1.3: The % of the urban firewood needs to be supplied from the existing eucalypt plantations, assuming a rotation of 10 years and a
production of 12 cu.m./ha/yr.
YEAR
EXISTING PLANTATIONS
TOTAL URBAN
NEEDS (1000 cum)
% OF THE URBAN
NEEDS AREA
(ha)
VOLUME (1000 cum)
1990 1588 190.5 684 27.9
1991 253 30.4 719 4.2
1992 418 50.2 754 6.7
1993 331 39.7 792 5.0
1994 182 21.8 832 26
1995 263 31.6 873 3.6
1996 312 37.4 917 4.1
1997 410 49.2 963 5.1
1998 180 21.6 1011 21
1.2.2. The ideal plantation target
A total of 154 000 ha needs to be planted by the year 2000 to supply the requirements up to the year 2010. The calculations for these data are shown in Tables 1.4 and 1.5. They are based on an existing volume increment rate of native and planted forests. Of this, 110 000 ha will be needed to supply urban needs and 44 000 ha in the rural areas with difficult access to firewood. This means that the mean annual target from year 1992 to 2000 should be 12 000 ha in urban areas and 5 000 ha in rural areas, giving a total of 17 000 ha/year.
T A B L E 1 .4 : P la n ta tio n t a rg e t fo r rura l a re a s co n s id e ri n g t h e e x is tin g v o lu m e of n at iv e an d p la n te d fo re s ts ba se d in th e 198 0 ii s to c k (M a ll e u x , 1 9 8 0 ) an d 3 .3 % a n n u a l in c re m e n t fo r n a tiv e fo re s ts an d 12 0 c u m /h a fo r p la n ta tio n s . 27
I
N E W P L A N T A T IO N A R E A S (H A ) * * 4 3 0 7 4 4 5 7 4 6 2 4 4 7 7 4 4 9 4 9 5 1 3 2 5 3 1 5 5 5 1 5 5 7 3 4 5 9 7 4 1 8 7 5 1 9 4 2 1 9 9 2 2 0 6 7 2 2 3 4 2 4 7 5 2 7 3 4 2 9 9 4 3 2 0 0 4 48 0 7 7 22 9 4 B A L A N C E ( . . . ) (m il lio n c u m ) 0 .2 8 0 .2 6 0 .2 3 0 .1 5 0 .1 0 0 .0 3 -0 .0 1 -0 .1 1 -0 .2 1 -0 .3 1 -0 .39 00
0 0 0 0 0 0 0 0 0 0 t v o
-o oooo
o oooo
d dddd
F R O M 19 92 TO 20 00 F R O M 19 92 TO 20 10 NA T IV E F O R E S T V O L U M E A V A I L A B L E (•*) T O T A L (m il lio n c u m ) 1 .2 0 1 .1 9 1 .1 8 1 .1 6 1 .1 4 1 .1 2 1 .0 9 1 .0 6 1 .0 3 0 .9 9 0 .9 4 0 .9 0 1 .3 7 1 .3 9 1. 41 1 .4 2 1 .4 5 1 .4 7 1 .4 9 1. 51 1 .5 4 S T A T IO N S V O L U M E (m il lio n c u m ) * 0 .5 2 0 .5 3 0 .5 5 0 .5 7 0 .5 9 0 .6 2 0 .6 4 0 .6 6 0 .6 9 F R O M P U A R E A (H A ) * 4 3 0 7 4 4 5 7 4 6 2 4 4 7 7 4 4 9 4 9 5 1 3 2 5 3 1 5 5 5 1 5 5 7 3 4 F R O M N A T IV E F O R E S T (m il lio n c u m ) 1 .2 0 1 .1 9 1 .1 8 1 .1 6 1 .1 4 1 .1 2 1 .0 9 1 .0 6 1 .0 3 0 .9 9 0 .9 4 0 .9 0 0 .8 5 0 .8 5 0 .8 5 0 .8 5 0 .8 5 0 .8 5 0 .8 5 0 .8 5 0 .8 5 A N N U A L IN CR E ME NT (m il lio n c u m ) 1 .2 0 1 .1 9 1 .1 8 1 .1 6 1 .1 4 1 .1 2 1 .0 9 1 .0 6 1 .0 3 0 .9 9 0 .9 4 0 .9 0 0 .8 5 0 .8 5 0 .8 5 0 .8 5 0 .8 5 0 .8 5 0 .8 5 0 .8 5 0 .8 5 G R O S S VOLUM E * (m il lio n c u m ) 3 6 .4 0 3 6 .2 0 3 5 .7 0 3 5 .3 0 3 4 .7 0 3 4 .0 0 3 3 .1 0 3 2 .2 0 3 1 .2 0 3 0 .0 0 2 8 .7 0 2 7 .4 0 2 5 .8 0 2 5 .8 0 2 5 .8 0 2 5 .8 0 2 5 .8 0 2 5 .8 0 2 5 .8 0 2 5 .8 0 2 5 .8 0 (0 Z R U R A L N E E D S (100 0 c u m ) 0 .9 2 0 .9 3 0 .9 4 1. 01 1 .0 4 1 .0 9 1. 11 1 .1 7 1 .2 4 1 .3 0 1 .3 3 1 .3 5 1 .3 7 1 .3 9 1. 41 1 .4 3 1 .4 5 1 .4 7 1 .4 9 1. 51 1 .5 4 0
1
CL . 8 Y E A R 1 9 9 0 1 9 9 1 1 9 9 2 1 9 9 3 1 9 9 4 1 9 9 5 1 9 9 6 1 9 9 7 1 9 9 8 1 9 9 9 2 0 0 0 2 0 0 1 2 0 0 2 2 0 0 3 2 0 0 4 2 0 0 5 2 0 0 6 2 0 0 7 2 0 0 8 2 0 0 9 2 0 10 zJ
1
® n w ~
c ®
o ®
«3 V) ® '— ’
s jjj
O C
1 1 •e o Q . X ® s XU
* - i . ><
In ®
- ® ® ® «— -O - Q - a
flj c
® <—>
® </)
1
£ ® ® _3
° s
1 > ® ® ® Cfl ® - £ CH So
•G *
® O)
* I i
as §
Q. ® O 3: -Q >
3 05
(/) ~ CÖ
w* O-
£ « c 8
SI
® CO
5
CO ® CO £
1 s I 5fp ® -Q z= > 2 _ c o
. 8 8 I 3 8 I 2
1 * 4
f ° S
• • • • * *
o
[image:42.531.72.474.57.699.2]M
C
O S 5 I a
s S
3
m
• -e o
ll
c• « a m T3 £
C 0
* * * ■
> > ■s s
m m
c c 0 Ö •
1 c
! i
| i « — M «
: l
5 • ? * § " • «
2 -o
« e c • o • § a » £ - « * 3 1 i r « 1 ? •
2 « C ' 5
.2 c
w « a m < H-A D J U S T E D
S L | C UJ
* a § « 3 - j J E 3 O E
> 3 6 .1 6 35 .7 4 3 5 .2 7 3 4 .6 7 3 3 .9 6 3 3 .1 5 3 2 .2 6 3 1 .2 3 3 0 .0 3 2 8 .6 8 2 7 .3 9 2 5 .8 2 2 5 .8 2 2 5 .8 2 2 5 .8 2 2 5 .8 2 2 5 .8 2 2 5 .8 2 2 5 .8 2 2 5 .8 2 2 5 .8 2 N E W P L A N T A T IO N A R E A S (H A ) 1 5 0 1 5 0
9824 1 04
2 0 1 1 11 0 1 1 5 8 7 1 2 13 0 1 2 65 7 1 35 37 1 4 39 2 1 3 48 7 1558 9 65 42
6875 7217 7584 795
8
83
50
8775 9075 9567
1 0 9 1 4 4 1 9 6 6 7 6 i „ ? u 3 J u
1 : *
I -0 .21 -0 .4 3 -0 .4 7 -0 .6 0
-0.71 -0.81 -0
.8 9 -1 .0 2 -1 .2 0 -1 .3 5 -1 . 3
0 £ o o o o
^ o o o o ^ o o o o
o o o o o o o o o o d d d d d
F R O M 1 9 9 2 T O 2 0 0 0 F R O M 1 9 9 2 T O 2 0 1 0 1 LU I U I A L A V A IL . V O L U M E (m il lio n c u m ) • 0 .4 7 0 .2 9 0 .2 8 0 .1 9 0 .1 2 0 .0 6 0 .0 2 -0 .0 6 -0 .1 9 -0 .2 9 -0 .1 8 -0 .4 0 1 .2 3 • 1 .2 9 1 .3 5 1 .4 2 1 .4 9 1 .5 7 1 .6 5 1 .7 0 1 .8 2 J M E A V A I L A B L 4 N I A IK JN 3 V O L U M E (m il lio n c u m ) 0 .1 9 0 .0 3 0 .0 5 0 .0 4 0 .0 2 0 .0
3 O O O O CM
d d d d d 0.0
5 1 .2 3 1 .3 1 .3 6 1 .4 2 1 .4 9 1 .5 7 1 .6 5 1 .7 4 1 .8 3
i l l
UL 1 5 8 8 25 3 41 8 3 1 1 1 8 2 263 31 2 41 0 1 8 0 1 5 0 1 7 3 8 40 3 1 02 4 2 1 0 7 5 1 1 1 2 9 2 1 18 50 1244 2 1306 7 1 3 71 7 1 45 42 1 52 25 - i O > IMP O RT ED N A T . F O R .( *) (m il lio n c u m ) 0 .2 8 0 .2 6 0 .2 3 0 .1 5 0 .1 0 .0 3
-0.01 -0.11 -0.2
1
-0.31 -0
.3
7
. o o o o
o o o o o o
CO z U R B A N N E E D S (m il lio n c u m ) 0 .6 8 0 .7 2 0 .7 5 0 .7 9 0 .8 3 0 .8 7 0 .9 2 0 .9 6 1 .0 1 1 .0 6 1 .1 1 1 .1 7 1 .2 3 1 .3 1 .3 5 1 .4 2 1 .5 1 .5 7 1 .6 5 1 .7 4 - 1 .8 3 0 i 3 a £ Y E A R
1990 19
9 1 19 92 19 93 1994 19 95 1 99 6 1 9 9 7 1 99 8 1 99 9
2000 20
0
1
2002 2003 20
0 4 200 5 200 6
2007 2008 200
2 9
1.3. THE PROPOSED SPECIES
1.3.1. The n eed s for research program m es
A lack of technical knowledge is a constraint to the development of plantations in Mozambique. This knowledge should be acquired and developed using results of applied research allied with the experience from neighbouring countries with similar conditions. Research priorities identified for firewood purposes are in the areas of:
(i) plantation and management of man-made plantation programmes and,
(ii) extension and agroforestry systems.
1.3. Z R eview of research program m es
The pre - independence period:
These findings were used to start the fuelwood plantation programmes in 1977. E.grandis, E.saligna and E.camaldulensis were selected and the majority of the seeds needed to implement the programme were collected locally with some imported, mainly from Zimbabwe (Cezerilo, 1990). The resulting plantations were very poor with a high mortality rate.
The post - independence period:
Willan (1981) produced a list of forest tree species suitable for testing in the different ecological regions of the country. Since then, eleven different species and provenance trials have been established in the region (Table 1.6). Of these, five are trials with eucalypt species suitable for firewood, five with legumes for multi-purpose uses and one to determine species suitable for flooded/saline areas. To meet the national seed requirements and become self-sufficient in seed supply in a short period of time, an early selection was effected in the new trials. Six Seed Production Areas were established with known provenances: three with Eucalyptus, one with Casuarina and two with Leucaena species (Table 1.6).
Parallel studies were conducted on the existing problems of plant production, plantation and establishment. Several demonstration trials were conducted in order to give technical guidance on:
(i) nursery practices: soil mixture and fertilizer, pot size, manual watering, hardening and topping of the seedlings and plant quality. (ii) plantation and establishment: site preparation, season, depth and
pitte size of planting and weeding systems.
(iii) In addition to obtaining information on agro-forestry systems, three agroforestry demonstration trials with Leucaena and Sesbania
TABLE 1.6 The established introduction trials and Seed Production Areas in the region since 1982. Numbers in brackets are the correspondent number of sites per each locality.
PROGRAMME
YEAR OF ESTABLISH.
NUMBER OF TRIALS
LOCALITY
L SPECIES INTRODUCTION TRIALS
. Eucalypts species / provenances 1982 4 M arracuene (2) 1 M aputo (1) 4 Salamanga (1)
1988 1 Moamba (1)
. Various Leguminous species 1987 1 M arracuene (1)
1988 1 Moamba (1)
. Legum inous of Central America 1988 2 Matola (1) 2 M arracuene (1)
. Legum inous of Australia 1989 1 Matola (1)
. Species for flooded / saline areas 1989 1 M ahotas (1)
IL SEED PRODUCTION AREAS
. Euc.cam aldulensis - Gilbert river 1986 1 M arracuene (1) (Austr.)
. Euc.cam aldulensis -Petford (Austr.) 1987 1 M arracuene (1)
. Euc.tereticom is - Kennedy river (Austr.) 1987 1 M arracuene (1)
. Leucaena leucocephala-K 28 (Filip.) 1989 1 M arracuene (1)
. Leucaena leucocephala - K 8 (Filip.) 1989 1 M arracuene (1)
1.3.3. Summarized performance of the Eucalyptus spp. trials
During 1981/1982 several Eucalyptus species and provenances trials were established. In Maputo province, four different sites were selected: Michafutene I and Michafutene II (at Marracuene), Salamanga and Maputo city (Figure 1.13). In the first three sites, four trials were established; one with provenances of E.camaldulensis, one with provenances of E.tereticornis, one with several Eucalyptus species and one with Eucalyptus and otherspecies. In Maputo city one trial only was established, that with Eucalyptus species.
Results from one year old (for Michafutene and Salamanga), 2.5, 3.5 and seven years old (Maputo) and, three and four years old (Michafutene) were analysed by different authors: Rudin et al ., 1983 ; Larrobla, 1985; Pudivitr et al, 1989; and Cezerilo, 1990.
With slight changes in the order of the species, similar patterns were maintained at three and four years of age on both Michafutene and Maputo trials. In both sites, E.camaldulensis was bigger than E.tereticornis though no significant differences were observed in the Maputo trial: the Zimbabwe and Petford provenances of E.camaldulensis were the best with the Zimbabwe provenance superior to the Petford provenance. Among the E.tereticornis provenances, the Kennedy River provenance was the leader followed by N.Lakeland. When provenances of E.brassiana were considered, the SE.Coen provenance was the best followed by Kennedy River. Other species with good growth performance included E.grandis (using seed from Zimbabwe and Brasil).
3 3
[image:48.531.16.526.152.810.2]The next Chapter describes and analyses a field experiment established to investigate silvicultural methods to improve the performance of E.grandis and E.camaldulensis for the conditions of Maputo province.
OHIAFTTEM 2
The effect of site preparation procedures on the
establishment of eucalypt plantations
2.1. OBJECTIVES
When selecting species to be planted in a specific site it is important not only to identify those which are suitable for the environmental conditions (climate and soil) but also to determine the silvicultural technologies to be applied when using such species.
The objective of this trial was to investigate the responses of two Eucalyptus species (camaldulensis and grandis) to different silvicultural techniques of land preparation, fertilizer and weeding applied during the establishment phase. Of main concern was the survival and growth of the seedlings during the first three to four years after planting.
The experiment compared performance of the species with:
• Two site preparation procedures: (i) mechanical clearing plus ploughing and, (ii) hand clearing plus pitting;
• Two weeding treatments: (i) total weeding and, (ii) partial weeding;
3 5
2.2. MATERIAL
Site description:
(a) The trial was established at Marracuene District (Maputo Province) in Michafutene (Cumbeza area). The area belongs to the FO2 - Maputo Fuelwood
Forestation Project, situated at 25.44° S Lat., 32.41° E Long, and at an altitude of 26 m. (see Figure 1.13 for location of Michafutene).
(b) The area receives a mean annual rainfall of 750 mm distributed mainly in the five months from November to March and has a mean annual temperature of 23°C (29°C max; 17°C min) (Kassam et al., 1981). It has a mean annual evapotranspiration of 1391 mm and a relative humidity of 70%. According to Reddy's (1984, 1986) modified Thornthwaite's moisture index the trial is situated in the wet semi-arid climatic zone.
ly
(c) The soils are Cambic Arenosols of poor/differentiated sands of a light brown colour formed by older fixec^ They are coarse in texture with more than 65% of sand (10% being bleached sand). These soils are of low fertility, acidic, deep (more than 1 m) and very well drained.
(d) The trial occupies a total gross area of 1.8 ha.
The land preparation:
(i) The mechanical land preparation consisted of:
• Felling of trees and shrubs with the area left free of debris and stumps by using a Komatsu-D 80 with a front blade; The area was not burnt.
• To improve the soil's tilth, the area was ploughed and double-harrowed along the row using a 3 disc-harrow connected to the rear of an agricultural wheeled tractor.
(ii) The manual land preparation consisted of:
• Manual felling of existing trees and shrubs and stumping only the big stumps ; placing the debris into heaps and broadcast burning all the area;
• Hoeing 20 cm x 15 cm pits at planting time.
Seedling production:
Seedlings of two species of Eucalyptus, E.camaldulensis (Gilbert River provenance from QLD, Australia, lot no. 337) and E.grandis - unknown provenance (though from Zimbabwe), were produced at the Michafutene nursery. They were produced according to the normal procedures of this nursery, including direct
\«\Vo
sowing to seed-beds, pricking-ou^ watering, root pruning and hardening-off. Seedlings were maintained in the nursery till planting.
Establishment:
3 7
Fertilizer:
For the fertilized treatments 100 g per plant of the fertilizer N:P:K (15:30:15) was applied 15 days after planting. The fertilizer was placed within a 30 cm radius from the seedling at a depth of 10 cm and covered with a layer of soil.
W eeding:
Both the partial and total weeding treatments were applied twice a year before and after the rainy season (that is approximately in April and October each year). The weeding treatments consisted of:
(i) Partial weeding: a spot, manual, weeding within a 50 cm radius around each plant using hoes.
(ii) Total weeding: a complete mechanized weeding by ploughing inter- row and a supplementary complete hand line weeding by hoeing between plants.
The design and layout of the experiment:
A strip plot design (factorial design 3x2x2 - see Figure 2.1) was used with three replicates (blocks), three main treatments - the land preparation (strips), 2x2 subtreatments - fertilizer and species (plots), with a unit plot of 50 trees (in 5x10 seedlings). These were: (with the abbreviations used for reference shown)
(a) The main treatments were arranged in strips:
(b) The subtreatments were randomized within the strips as combinations of 2 fertilizer treatments x 2 species, where:
(i) GR-NO: E.grandis without fertilizer.
(ii) GR-YES: E.grandis with fertilizer.
(iii) CAM-NO: E.camaldulensis without fertilizer. (iv) CAM-YES: E.camaldulensis with fertilizer.
(c) The gross plot was 5x10 seedlings. To avoid border effects, the trees used in the analyses were the central 3x8 seedlings (24).
Measurements:
Measurements were made of:
(a) survival Expressed as % of the initial stock) at six months, one year, two years, three years and four years after planting.
(b) height (in m) at six months, one year, two years, three years and four years after planting.
(d diameter (in cm) at two years, three years and four years after planting.
(d) tree quality at three and four years after planting with the following subjective observations:
(i) Stem form: A - straight single stem;
B - straight single stem but slightly twisted;
D - double stems or multiple leaders; or principal stem highly twisted ; or suppressed tree.
(ii) Healthy condition: 0 - 100% of the tree being healthy; 1 - only 50% of the tree in good healthy condition;
2 - only 25 % of the tree in good healthy condition ; or nearly dying.
The data of healthy condition of the trees was grouped into two classes: (i) healthy trees (100% healthy) and, (ii) sick trees (50% and 25% healthy or nearly dying).
(iii) maturity stage: MF - mature fruit; IF - immature fruit; FI - with inflorescence; BD - with buds;
NE - neither of the above.
Because the number of trees on each of the five maturity classes was not enough to make inferences, those classes were grouped into two: (i) mature trees (for the first four stages); and (ii) immature trees (trees with neither inflorescence or fruits).
New variables: