Ames Laboratory Technical Reports Ames Laboratory
2-1964
Base hydrolysis of
trans-dichlorodiammineplatinum (II)
Ronald George Gunther
Iowa State University
D. S. Martin
Iowa State UniversityFollow this and additional works at:http://lib.dr.iastate.edu/ameslab_isreports Part of theChemistry Commons
This Report is brought to you for free and open access by the Ames Laboratory at Iowa State University Digital Repository. It has been accepted for inclusion in Ames Laboratory Technical Reports by an authorized administrator of Iowa State University Digital Repository. For more information, please contactdigirep@iastate.edu.
Recommended Citation
Gunther, Ronald George and Martin, D. S., "Base hydrolysis of trans-dichlorodiammineplatinum (II)" (1964).Ames Laboratory Technical Reports. 61.
Abstract
The reactions t- [Pt(NH3)2Cl2] + OH- ->t- [Pt(NH3)2C1(OH) ] + CIt- [Pt(NH3)2Cl(OH)] + OH-- -> t-[Pt(NH3)2(OH)2] + Cl in aqueous solutions were studied by measuring the changes in specific
conductivity and in ultraviolet absorption which occurred during the course of the reactions. The rates of reaction were determined from a plot of ln L(t) vs time, where L(t) is either (optical density at infinite time)( optical density at time t) for the spectrophotometric determinations or (conductivity at time t)
-(conductivity at infinite time) for the conductometric experiments. The conductometric experiments also required correction for hydroxide attack upon the measuring vessel. Both reactions were found to be zero order in hydroxide, to be the only reactions occurring between the platinum complex and the hydroxide for times up to one day, and to involve the formation of an aquo intermediate. The rates for the first hydrolysis were 6. 21 x 10-5sec-1- at 20 °C, 10. 6 x 10⁻⁵sec-1at 25°C, and 29.3 x 10⁻⁵sec-1at 35°C, with an energy of activation of 18.0 kcal and an entropy of activation of -16 cal/ °K. The rates for the second hydrolysis were 0.17 x 10⁻⁵sec-1at 25°C and 0. 50 x 10-5sec-1at 35°C, with an energy activation of 19.1 kcal and an entropy of activation of -21 cal/ °K.
Disciplines Chemistry
IS-883
.
,
PHYSICAL
S
C1E~~":~~S
READING
ROOM
IOWA STATE UNIVERSITY
BASE HYDROLYSIS OF
TRANS-DICHLORODIAMMINEPLA TINUM(II) by
Ronald George Gunther and D. S. Martin
RESEARCH AND
DEVELOPMENT
REPORT
'•
TID 4500, June 1, 1. 964
UNITED STATES ATOMIC ENERGY COMMISSION
Research and Development Report
BASE HYDROLYSIS OF
TRANS-DICHLORODIAMMINEPLA TINUM(II)
by
Ronald George Gunther and D. S. Martin
February, 1. 964
Ames Laboratory at
Iowa State University of Science and Technology F. H. Spedding, Director
ii
IS-883
This report is distributed according to the category Chemistry (UC-4) as listed in TID-4500, June l, 1964.
LEGAL NOTICE
- - - _ _ _ ,
This report was prepared as an account of Government sponsored work. Neither the United States, nor the Commission, nor any person acting on behalf of the Commission:
A. Makes any warranty or representation, expressed or implied, with respect to the accuracy, completeness, or usefulness of the information contained in this report, or that the use of any information, apparatus, method, or process disclosed in this report may not infringe privately owned rights; or
B. Assumes any liabilities with respect to the use of, or for
damages resulting from the use of any information, apparatus, method, or process disclosed in this report.
As used in the above, "person acting on behalf of the Commission" includes any employee or contractor of the Commission, or employee of such contractor, to the extent that such employee or contractor of the Commission, or employee of such contractor prepares, disseminates, or provides access to, any information pursuant to his employment or contract with the Commission, or his employment with such contractor.
TABLE OF CONTENTS
Page
ABSTRACT . . . · · . . 1 I. INTRODUCTION . . . · 2 II. EXPERIMENTAL... 12
III.
IV.
v.
VI. A.
B.
Materials ..
.
...
.
Equipment . . . . TREATMENT OF DATA.
A.
B.
Spectrophotometric Data ....•••••...••.•••••.••.••...•
Conductometric Data . . . . RESULTS
...
DISCUSSION ..
LITERATURE CITED 0 • • • • • • • • • • • • • • • • • • • • • • • • • • • • • • • • • • • 12
12
19
19
21
30
1
IS-883
BASE HYDROLYSIS OF TRANS-DICHLORODIAMMINEPLATINUM (II)•:'
Ronald George Cu:qther and D. S. Martin
ABSTRACT
The reactions
t- [Pt(NH3)2 Cl2 ]
+
OH- - !_- [Pt(NH3)2 Cl(OH) ]+
CI-t- [Pt(NH3) 2 Cl(OH)]
+
OH-- !_- [Pt(NH3) 2 (OH) 2 ]+
Cl-in aqueous solutions were studied by measurCl-ing the changes Cl-in specific conductivity and in ultraviolet absorption which occurred during the course of the reactions. The rates of reaction were determined from a plot
of ln L(t) vs time, where L(t) is either (optical density at infinite time)-(optical density at time t) for the spectrophotometric determinations or (conductivity at time t) - (conductivity at infinite time) for the con-ductometric experiments. The concon-ductometric experiments also required correction for hydroxide attack upon the measuring vessel. Both
reactions were found to be zero order in hydroxide, to be the only
reactions occurring between the platinum complex and the hydroxide for times up to one day, and to involve the formation of an a~uo intermediate. The r?'tes for the first hydrolysis were 6. 21 x 10-5 sec- at 20 °C, 10. 6 x 10- sec-1 at 25°C, and 29.3 x 10⁻⁵ sec-1 at 35°C, with an energy of activation of 18.0 kcal and an e~tropy of activati<:z; of -16 cal/ °K. The rates for the second hydrolys1s were 0.17 x 10 sec-1 at 25°C and 0. 50 x 10-S sec-1 at 35°C, with an energy activation of 19.1 kcal and an entropy of activation of -21 cal/ °K.
I. mTRODUCTION
The purpose of this research has been the study of the kinetics and mechanism of the reaction of traps-dichlorodiammineplatinum(II) with hydroxide. This study is a continuation of previous work at this labora-tor,y on the chloroammineplatinum(II) complexes(l, 2,
3,
4,5,
6, 7,
8,9,
10, ll).Despite previous work done at this laboratory (8) and at others (12) on the ~stem herein considered, several questions remained unanswered. The rate at which the complex reacts with a second equivalent or
hydroxide was undetermined. Some question existed as to whether a
previous~ undetected rapid reaction between the complex and the hydroxide was occurring during the initial minutes of the reaction. Fin~, there was the question as to whether the reactions of this system are dependent
upon the nydroxide concentration (8).
The trans-dichlorodi8JIIIIineplatinum(n) complex was first prepared
by Reiset (13) in 1840, and is sometimes referred to as Reiset' s salt, particularly in the Russian literature. Synthesis of ois-dichlorodi8JIIIIine-platinwa(II) five years later by Peyrone (14) caused some controversy,
because these two complexes have the
sa.-
COilpOSition but different .3
Jorgenson (17), another of the early workers on the chemistry of
platinum(II), found in his studies of the substitution reactions of
[Pt(NH;)4]++ and [PtCl4]= that two products were formed depending on
the starting materials. When [ Pt(NH3)4]++ was treated with chloride,
.1-
[Pt(NH;)2Cl2] was formed, whereas when [PtC4]= reacted vrith ammonia,g,-
[Pt(NH;)2Cl2] was formed. These reactions are classical examples ofthe ~-effect of Chernyaev (18). The trans-effect, coupled with the
general inertness of ammine ligands in platinum(II) complexes, is the
basis for Kurnakov1s test for the cis and trans isomers of
diammine
-platinum(II) complexes (19). The trans isomer will react with thiourea
(tu) to yield ,1-[PtA2(tu)2
]++,
while the.s11
isomer under the sameconditions will yield [ Pt(tu)4]++, where A is either ammonia or an amine.
The aqueous solutions of the trans and
.s11
isomers were subjectedto investigation
qy
conductometric methods b,y Werner and Miolati (20),and
qy
Drewl l
!!J:..
(21)' and were found to undergo conductivity changes indicative of soine chemi-cal reaction. These changes were interpreted b,yGrinberg and Ryabchikov (22, 23) and Jensen (24) to be the result of the
acid ~drolysis reactions:
[Pt(NH;)2Cl2 ] + H20 ~ [Pt(NH;)2Cl(H2o)J+ + Cl-, (1.1)
[Pt(NH;)2Cl(H20) ]+ + H20 ~ [}>t(NH;)2(H20)2]++
+
Cl-. (1.2)The aqueous solutions of these complexes were titrated with sodium
hydroxide, and the acid strengths of the species present in the solution
were dete:nnined (22, 23, 25). The reaction was interpreted as being the
n~utralization of the aquo species formed b,y the reactions given in Eqs.
1.1 and 1.2. The hydrolysis reaction of Eq. 1.1 has been studied for both
having been determined. The reaction rate for the trans isomer has been found to be higher than that for the ~ isomer; this difference has been attributed to differences in the trans labilizing influence of chloride compared to ammine and is a further example of the importance of the traps-effect in studies of platinum(II) complexes.
The trans-effect has been considered in several reviews (27, 28, 29), so no comprehensive treatment of all the experimental evidence for the nature of the trans-effect
-
will be given here. Just a statement of a general definition of the trans-effect and the theor,y profferedto
explain its existence will be presented. The trans-effect is exhibited by any group which affects the rate of substitution reactions of the ligand which is in the position trans to it in the square plane of the complex. The important idea in this presentation of the effect is that it is the rate of the substitut.ion reaction which is concerned in the trans-effect. Thus, consider a complex in which a ligand, designated as
!.
on a complex, is replaced by groupI·
I f with comparable groups cisto
!
the reaction for the complex with~ transto
!
is more rapid than that for the complex with1£
1 traas to!.
then ~ is consideredto
have astronger traps-directing property than ~· • I f in the same complex,
1£
and1&'
occupy~ positions, and each is trans to equivalent ligands, then sub-stitution reactions wUl yield most]J' the product in which the group traas to ~has been replaced. Since 01- has a greater traps directing effect than NH;, the ldnetics for the replacement of a chloride by ammonia inthe complex [Pt(NH;)Cl;]• leads
to
the cis-dichlorodiammineplatinum(II)5
An explanation of the trans-effect suggested
qy
Grinberg (30) isthat an induced dipale on the central metal atom weakens the bond of the
ligand in the position trans to the labilizing group. thus enhancing the
rate of the substitution reactions of the leaving group. The dipole is
induced on the platinum when the primar,y charge of the platinum(!!)
polarizes the electron cloud of the tr&ns-labilizing ligand. The dipole
induced on this polarized ligand in turn interacts with the electron cloud
of the platinum to yield an incre•nt in the electron charge density in
the region of the ligand which is in linear opposition to the polarized,
labilizing ligand, as is seen in Fig. 1, where
!
is the leaving group and~ is the labilizing group.
L -
Pt -
X
Figure 1. Distribution of charge in induced dipoles in the I-Pt-X coordinates of trans- [ptA2LX ]
This increment in electron density causes a weakening of the bond o! the leaving group, with a resultant increase in the rate of reaction.
Accord-ing to this theor,y, the higher the polarizability of the traps labilizAccord-ing
group, the greater is its trans influence, which is in accord with
experi-•ntal evidence. When stated in this bald fashion, however, this theor.r
has so• inadequacies which require further explanation and elaboration
Another factor to be taken into account is that the hi:;hly polari?,able
groups 'lrhich have a la1·::;e tra:1s ii1f'luence hay,; l::J~·: electronegat.ivities,
and form covalent bonds with the platinum ;vhich 3 .. nvolve extensive electron
transi'er to the platinum. This transferal to the I-•latL'1um l~.:t'lhJfJ the
directional nature of the trans-effect un~xplained? however, be~~use a
general decrease of the strength of all plati.In.un-ligand bonds wou}.d be
expected !'ram a decrease in the net positive cbargo on the plat~1~1,
rather than a stereospecifi.c effect. The directionality has been
ex-plained by Syrkin on the basis of the platinum o!'"bitals which are U.:;..2d in
forming the covalent bonds with the ligands {Jl), and the electron pr~;~
babUity distribution which is found when one of the ligands is strongly
covalent in its bonding. Considering that the d 2 2 along with the §_, X
•Y
the
Px•
andPy
orbitals of the platinum are involved in the bonding, behas claimed that strong coval.ettt bonding by one
o
r
the ligands causes anincrease in the covalent character of the bonds
to
ligands which are .21§.to it and a decrease 1n r..ovaleney
ot the
~ans position. on the basis ofresonance models for the system. This lessening of the covalent character
of the trans ligand was tak>en to correspond to a weakening or the bond in
that position, according to t.his treatment .. Because the d
-
orbital isor
lower energy than the .2 orbit.al,
'..r
this orbital was more strongly involvedin the bond
ot
one of the ligarAs, then it could not be usedb7
the ligandwhich is
trans
to that ligand, given the directional character or the.st.
orbital involved.
Basolo and Pearson have proposed a different approach to this problem
7
those ligands which are easilY polarized have low lying excited states,
and that polarization can be explained in terms of the wave functions of
these low lying excited states mixing with the wave function of the
ground state (32). Because the excited states of the ligand which are
involved in the mixing are presumably orbitals with rr -symmetry character,
the resultant hybrid will cause the ~ orbital electrons of the platinum
to be displaced towards the trans position with, again, an increment in
the electron probability in this region causing the bond to be weakened.
When considered in this fashion, the
Pauli
exclusion principle is broughtto bear, besides the purely electrostatic consideration.
Inasmuch as an electrostatic basis involving polarization of the
ligands and covalent rr -bonds is inadequate to explain the strong
trans-effect of such groups as R3P,
c
2H4,
and CO, an alternative theor.y forthe trans-effect was introduced by Chatt ~
,!1.
(JJ) and Orgel ()4).Certain ligands which exhibit a strongly labilizing influence on the
trans ligand are definitely known to have no weakening effect on the bond
of that ligand, and for these the increase in the rate of reaction of this
trans ligand is ascribed to stabilization of the transition state. In
order that this may be more clearly seen, a digression to the possible
transition states for the reactions of platinum(II) COilplexes is apt.
To start with, it has been found that a number of substitution
reac-tions of platinum(!!) complexes can have their rate of reaction expressed
by the equation,
Rate= k1 [complex]
+
k2 [complex] [Y] (l.J)where [Y] is the concentration of the incoming ligand (J5). Furthermore,
hydrolysis rate for the complex
(9).
Other observations of import in theassessment of the reactions of the platinum(II) complexes are the following (29). The rates of reactic:m are dependent both on the entering and
leaving group; the :t'9action rates of the various complexes with the
sol-vent are relative~· insensitive to the charge of the complex
(££.
Table 2,p. 49). When complexes contain ligands which sterically hinder the
positions above and below the plane of the complex, both k1 and k2 of the
reaction are decreased
(36).
Also, the rate of reaction with differentsolvents depends on the coordinating properties of the solvent, with the
dielectric constant and the solvating properties of the solvent being
immaterial
(37).
The ionic strength of the solution has no influence onthe reaction rates of
many or
the complexes (8,9).
These observations about the substitution reactions of platinum(II)
complexes indicate that in general any reaction mechanism which involves
bond breaking as the rate determining step is untenable, and that a
mechanism involving bond fo~tion as the rate determining step is
fol-lowed in these reactions. Two such mechanisms are proposed (28, pp.
188-189), both of which start with the square plar1ar complex in solution
with the positions above and below the plane of the complex having solvent
molecules coordinated to form a distorted octahedral configuration.
Be-cause the axial ligands are boimd loosely, they can rapidly be replaced by
solute molecules or ions. These axially boWld ligands are used
to
fonneither a square pyramid intermediate, or a trigonal bip,yramid intermediate,
as shorm in Fig. 2. For the square pyramid intermediate
(££.
Fig. 2a),the axial ligands move in to displace the leaving group X. This square
FAST
-
---XSLO~
+Z-
F'AST 9 y :/A L- Pt-X/ I
A I
s
y
I
A
'"
L-~t-Z~!
(a)s
Figure 2a. Bimolecular reaction involving a square pyramid intermediate
s
: A
T
I A
1/
• /
L-Pt-X + Y
--
L-Pt-X/ I
A/: I
s
A 1
I
s
SLO~
y,/A
Pt' ' / FAST
L- \ - -A/ '
'
Xs
: A 1 / L-Pt-Y
/ I
A I
I
X
FAST
---
~ [image:15.599.90.512.32.755.2] [image:15.599.169.500.46.354.2]or with solvent molecules
s.
If it reacts with the solvent, the generallability of aquo complexes, when aqueous solutions are involved, will
contribute to repeated formation of the intermediate u.~til a more stable
product is formed.
The other mechanism (,5!. Fig. 2b) starts with one of the axial
ligands moving in towards the platinum, the other axial ligand leaving,
and the leaving group shifting towards the axial position thus vacated.
At this point the intermediate is in the form of a trigonal bipyramid
with the trans-labUizing group, the leaving group, and the group from
the axial position forming the equator of the bipyramid. This
inter-mediate can then go to the product by attaining the distorted octahedral
configuration with the leaving group nov located in the axial position,
where it will be in labile equilibrium with the solution.
It is this trigonal bipyramid intermediate that is employed by
Chatt
!1
~. (JJ) and Orgel (34) to explain the traas-etfect. The ~zorbital
ot
the platinum has its highest electron density in the directionot
the incoming Y and the leaving X groups of the trigonal bipyramidinter-mediate, so that any group which can shift the density away from these
positions will enhance the stability of the intermediate by reducing the
repulsion to the formation of this configuration. I f the traps labilizing
group L is capable of forming a TT -bond with the <ixz orbital electrons
of the platinum(II), just such a shifting w1l1 occur. Ligands which are
capable of forming such a rr -bond have been called biph1]1c {37) because
the, are nucleophilic in the formation of their primar,r bond to the
.
platinum, and they are electrophilio in the formation of this rr -bond
11
both the mechanism of the substitution reactions of platinum( II), and
the nature of the trans-effect for those ligands capable of n -bonding
can be explained. Neither the polarization theory nor the n -bonding
theory is adequate by itself'
to
explain all cases of'~ labUization,ll. EXPERIMENTAL
A. l1aterials
The platinum used in the experiments was recovered from compounds
used in other experiments at this laboratory and was origina.lly from
many sources. Because of possible interference with kinetics studies,
the platinum was freed of iridium impurities using the fractional
cr,rstallization of K2PtBr6 as recommended by Jowanovitz ~
!l•
(38).The
1- [
Pt(RH3)
2C12 ] was prepared by the thermal decomposition of[Pt(NHJ)4C12
J
(J9). All other chemicals used in the experiments wereof analytical reagent grade meeting ACS specifications. Solutions were
made from water which was first passed through ion exchange columns and
then distilled from alkaline permanganate solution in order to remove
any organic materials, with the resultant water having a specific
con-ductivity of 0.54 x lo-6 mhos/em at 25°C. Sodium hydroxide solutions
were prepared by reacting sodium metal with conductivity water under an
argon atmosphere.
B. EquipDent
A Car,r Recording Spectrophotometer Model 14 with thermostated cell
colllpal"tments was used for the spectrophotometric experiments.
Thermo-regulation of
±
0.1oc in the cell compartment was achieved by pumpingwater from a Sargent constant temperature bath through the thermostating
jacket of the spectrophot0ll8ter. Matched quartz cells with a 100 • path
length ·were used in the experiments.
'!he conductometric studies were made with a type 716C capacitance
. 13
resistance decades in the range 0.01 ohms to 105 ohms incorporated
externally into its measurement s,ystem. A Hewlett-Packard 200CD wide
range oscillator and Tektronix type 122 low-level preamplifier were used
with the capacitance bridge for the conductivity measurements. The
con-ductivity cells were thermostated
ina modified Sargent constant
tempera-ture bath. The sensitivity of the measuring device coupled with the
relatively high variability of solution resistance with temperature
changes necessitated the use of a thermistor controlled thermoregulator,
constructed at this laborator.y, which regulates the transformer oil
thermobath to
±
0.02°C. The conductivity cells used for the kinetics
studies have cell constants of
6.)506
cm-1, 6.3344 cm-1 , and 6.2786 cm-1,
and are designed
to conform with the recollllll8ndations of Jones and
Bollinger ( 40) • Transformer oil was used as the thermostatic medium
because of its desirable electrical properties.
1. Preparation of solutigps
For both the spectrophotometric and conductometric experiments, the
~
[Pt.(NH
3)
2Cl2 ] solutions were prepared
byfirst dissolving a
knownamount of KCl in a volumetric
flask,then adding a
knownamount of the
platinum complex and dissolving this
bymeans of a shaker and a J5°C
constant temperature bath-..this latter was because of the slow rate at
which the complex dissolves, and its low solubility. The KCl served the
twofold purpose of suppressing the aquation of the platinum complex
before the introduction or hydroxide, and of providing an ionic medium
to yield desirable resistances for the conductivity measurements.
As
was
stated above, the NaOH solutions
were prepared
byreacting
metallic
sodium
concen-tration was determined by titrating potassium acid phthalate to a phenolphthalein endpoint. The NaOH solutions were prepared in this
manner with a view to keeping carbonate concentrations as low as possible. Before the inception or the experiment proper, all or the solutions to
be employed were brought to the temperature of the experiment by placing them in a constant temperature bath.
The experiments were timed from the moment of introduction by volumetric pipette of the NaOH. The reference solutions--solutions
identical to the actual experimental solutions in all respects except that they contained no platinum complex--were started first, and then the
experimental solutions. The initial minutes or the experiment were always somewhat unreliable because or the changes in the temperature of the solutions which occurred during the mixing
ot
the reactants and the necessaey rinsing out of the reaction vessels with the reaction solutions. The extreme temperature dependencyot
the conductivity revealed the room temperature to be the real determining factor in the conductivity DJBasured during the early minutes of the experiment before the solutions reached the temperature of the constant temperature bath.The platinum solutions were tested for stab111ty in general and with respect to light. They were found to be relatively stable for long
periods of time and completely stable with respect to light for the periods of time involved in the experiment (41). The reaction solutions upon being tested tor stab111ty with respect
to
light indicated either that the reaction rate was independent of light or i t dependent, the15
could not be detected under the experimental conditions used. Light was,
therefore, discounted as a factor in the present stuqy. Ionic streneth
is a known factor in rates of reaction, but the present experiments were
all conducted at low ionic strength ( < 0.02), so this factor also could
be disregarded; also, the hydrolysis reactions of platinum(II) are in
general independent of ionic strength
(9).
2. Spectrophotometric procedure
The ultraviolet absorption spectrum of the system being studied lends
itself to kinetic determinations because an absorption vall~ for
0
1-
[Pt(NH3)
2Cl2 ] at 29.50 A grows into an absorption peak as the reactionwith hydroxide proceeds. Furthermore, the changes in absorption at this
point are qui.te large for the first hydrolysis reaction of the system, ·
while any changes at this point due to any other reactions in the system
are both small and occur at a rate which is qui.te slow in comparison to
the reaction rate for the first hydrolysis reaction. The second hydrolysis
reaction proceeds at such a slow rate that its measurement is difficult in
the first place, and its measurement by spectrophotometric means is
pre-cluded
b.Y
the steep slope of the absorption spectrum in the region wherethe most characteristic changes for this reaction occur. All of these
features can be seen in Fig. ).
The general procedure in these experiments was to follow the spectral
0
changes in the 2.500 to 4000 A region, with the time elapsed since the
introduction of the NaOH into the solution always being recorded as the
0
spectral sweep passed 29.50 A. The cell compartment was completely dark
.
-
. . .
' ' ' '35°C
0.60111\ \ \
1I
I
TRANS- [Pt(NH ) Cl
J
I
32 2
4.29
XI0-
4 M
K Cl= 1.61
x
I0-2 M
0.501 " \ \
~
I
I
I
NaOH
=
1.14
x
10-3 M
I \\ \ "i\
I
I
I
~
t:
0.40
z
w
I
0
\\
I
I
I
I
I
~
0.30
(..)
-._
CL.
0
0.20
QIOI
I
I
I
I
=r
I
<i4i::
:d
0---~----~--~~--~----~---~
240
260
280
300
320
340
360
380
400
WAVE LENGTH -mJ.L
Figure ). Composite ultraviolet absorption spectra for a typical base hydralysis experiment at J5°C. Spectra obtained with solution: 4.29 x 10- M
i- [
pt(NHJ)2Cl2], 1.61 x 10⁻² l-1 KCl, 1.14 x 10-J H NaOH in 10 em silicacell. The times indicated are the times a.f~er the inception of the
· experiment at which the absorption at 2950
l
was recorded '...
[image:22.581.111.622.62.498.2]17
In order to ascertain whether other changes were occurring, through-out the course of some of the reactions concentrated HCl was added to an aliquot of the reaction solution. The high chloride and acid concentra-tion reversed the course of the hydrolYsis reacconcentra-tion so that the starting material should have been formed i f no other reactions occurred in the
system. If no such competing or subsequent reactions occurred, then the spectrum of . the reaction solution which has been reversed ~·10uld have approached that of the original solution, since the hydrolYsis reaction is reversible.
) • Conductometric procedure
Conductometric measurements of the reaction were based upon the difference in conductance between hydroxide ions and chloride ions. The reaction lUlder study lvas one in which hydroxide· ions in solution were replaced by chloride ions, thus causing a change in the resistance of the solution. The chief difficulty was that hydroxide also had a proclivity to attack glass. Th~s attack also resulted in a change in the resistance of the solution. The experimental procedure was designed in such a manner to take these facts into account.
Each experiment used at least two and sometimes three conductivity cells of approximately identical geometry. One cell contained a reference solution and the other one or two cells contained experimental solutions. The resistance of all the cells was measured over the period of the
experiment, with the reference cell giving the amount of attack upon the
glass by the hydroxide. All of the cells were constructed of the same
neutral and were at low concentrations, so that their influence on the
activity of the ionic species was negligible. As a consequence the
~droxide attack on the glass of the reference cell was eA~cted to
closely replicate the attack in the reaction vessels.
The experiments were conducted at a low measuring voltage (approx.
J
x lo-2v), to avoid introducing extraneous electrochemical effects,through the use of a preampli!ier and the higbly sensitive null detector
of the capacitance bridge. The measuring frequena.y used in all of the
experiments was 1 Kc. Interfering phenomena were virtual.l1' eliminated
through the use of properly designed conductivity cells, optimum
platinization of the electrodes, low measuring voltage, and the use of
transfonner oU as the thermostating mediUJil, so that a second measuring
19
III. TREATMENT OF DATA
A.
Spectrophotometric Data
0
As was previously noted, the spectral changes at
2950 A were fairly
specific for the first hydrolysis reaction; the data at this wave length
could therefore
betreated as though this were the
onlyreaction taking
place
inthe s.ystem in accordance with the equation:
!:.-
[
pt(NH3)
2Cl
2 ] + OFt ~!:.·
[pt(NH3)
2Cl(OH)]
+Cl-
(III.l)
(Nl)
(Nz)where
N1 and N2 represent the molar concentration of the indicated species.
I f
the hydroxide ion is present in a large excess so that the reaction can
be
considered pseudo-first order, or if the reaction is actually zero order
in
hydroxide, the rate expression is
(III.2)
where k1 is the specific rate constant. The concentration N1 at
anytime
t is given
by,If
there were no further reaction or
!:.- [
Ft(NH3)
2Cl(OH)] , then the
concentration N2 is given
b,y,-klt
N2(t)
=N1(0)(l-e
).
(III.J)
(III.4)
The concentrations or the
ptcomplexes are related to the optical density
or the solution
bythe equation,
where
D(t) = optical density at time t
E: 1 =extinction coefficient of
1-
[
Pt(NH3)zC12]1
=
length of optical path for spectrophotometric measurementE: 2
=
extinction coefficient of1- [
Pt(NHJ)zCl(OH)]Again, Nz(O) = 0, but also N1 (co) = 0 and, assuming there are no
inter-fering reactions, Nz( co ) = N1 (0), so Eq. III.5 assumes the forms,
and,
n( co )
=
€ zlNz( co )= e zlNl (o)
Substitution of Eqs. lli.3 and III.4 into Eq. III.5 yields
-klt -klt
D(t) = e llNl (O)e + e 21N1 (0)(1-e )
(III.6)
(III.7)
(III.8)
The desired equation results when Eqs. Ill.6 and III.7 are substituted
into Eq. lli.8:
or,
or,
D(t) =
D(O)e-~t
+
D( co)(1-e-~t)
8-k1t = D(t)-D( co)
D(O)-D( co )
D( co) - D(O) kl t = ln -D( co) - -D(t)
(Ill.9)
(III.lO)
(III.ll)
IV
plotting ln(D( co ) - D(t)) vs t, the rate constant k1 will be the21
intercept. Alternatively, the intercept can be used to find the half-time
for the reaction, and k1 can be calculated from the half-time. In the
actual experimental results, however, only a D(max) was obtained because
of the subsequent reactions which occurred in the system. Also, E: 2
was not known, so that the concentrations could not be calculated directly.
Since, however, the second reaction occurred at such a slow rate in
com-o
parisan
to
the first, and the changes in the spectrum at 2950 A due tothe second hydrolysis reaction were very slight, the data could be treated
b,y a method or successive reiterations. Approximate values for D(oo)
were chosen until a plot or ln(D( co ) - D(t)) vs t was obtained which
was linear over a period or 2.5 half-times for the reaction.
B. Conductometric Data
Before giving an exposition or the method in which the
conducto-metric data was treated, an explication and justification or the
assump-tians used in the treatment will facUitate the presentation. Central
to the whole development was the assumption that the specific conductance
or the solution could be represented b,y the sum of the specific conduct-ances or the individual ionic species present. From the equation
L
=
L: n~, where L is the specific conductance or the solution andIn
isthe specific conductance or the individual ions present in the solution,
the next step was
to
relate the specific conductances to the concentrationsor the conducting species present in the solution to yield L
=
10•3 L: c A ,n n n
where en is the normality or each compound present, and 1\ n is the
was justified b,y the fact that the measuring voltage and frequen~ were
both low enough that they did not constitute a disturbing influence on
the state or the ions in solution (42, p. 127). The transition from
specific conductances to concentrations followed from the basic
defini-tion or equivalent conductance--it should be noted that actual values
or the equivalent conductances did not enter into the treatment or data
at any point so that it was unnecessar,y
to
consider what equivalentconductance value to use; the onlY requirement was that each compound
which was taking part in conducting the current through the solution have
same constant which when multiplied b,y the normality or that compound
would yield the contribution or that compound to the overall conductivity
or the solution.
While this is not an egregious requirement, some further remarks
about it are required inasmuch as the composition or the solution changed
as the reaction progressed, and equivalent conductance~ at finite
concen-trations are dependent upon the composition or the solution. The factors
of importance are the following: the ions that are present, their valence
and concentration, the ionic strength of the solution, the non-ionic
species present, the viscosity of the solution, the solvent, and the
temperature. Of these, the solvent and temperature can be ignored because
these remained constant throughout the course of the reaction. Because
the nature of the solution changed during the reaction, the remaining
factors are a bit more complex. For convenience, reaining factors will
first be considered as they appear in the reaction of the platinum complex
23
Unlike the spectrophotometric determinations, the conductometric
experiments indicated changes associated with the second nydrolysis
reaction, so the following are the reactions that have to be considered:
[?t(NH;)zClz] +Oil
~[?t(NH;)zCl(OH)]
+ Cl-(III.l2)
(Nl) (Nz)
[?t(NH;)zCl(OH)] + OH- kz•[?t(NH
3)
2 (0H)2J
+ Cl-(III.lJ)
(N2) (N;}
where N is the concentration of the particular complex. The important n
features of this reaction with respect to the present consideration are
that univalent ions were involved, and the ionic strength was unaffected
by the reaction. Both of these would indicate that any changes which
occurred in the solution properties would be regular and not very
pro-nounced. Furthermore, with only one exception, the experimental solutions
contained a large excess of eydroxide. Also, the nature of the complex
with respect to its influence on the solution changed little, so that
the viscosity of the solution was unchanged by the primary reaction. All
of these taken together indicate that the equivalent conductances of the
electrolytes in the solution were unaffected by the reaction of the
pt complex.
With respect
to
the extraneous reactions-the ~xide attack on theglass, and changes which occurred in the pt complex--a very important
con-sideration is that these reactions were so slow that their influence
should be negligible during the early portions of the reaction which were
of the hydroxide in large excess in all the experiments except one has
bearing on the solution being considered to remain at approximately
constant composition with respect to the equivalent conductances of the
electrolytes present in the solution. In Chap. IV of this thesis
experimental evidence bearing on these contentions will be given.
While the above considerations on the equivalent conductances of
the electrolytes will be of importance in the treatment of the
experi-mental data, the difficulty still remains that these extraneous reactions
contribute to the experimentally measured changes in the system, and some
correction must therefore be made for these reactions before the~ate
constants for the Pt complex reactions can be ascertained. One of the
extraneous reactions is the attack of the hydroxide on the glass of the
reaction vessel; the manner of treating this problem
will
be consideredfirst.
In the design of the conductometric experiments, many factors came
into play: elimination of experimental errors such as the Parker effect,
the necessity of having a high cell constant, the desirability of
repro-ducibility and therefore of structural rigidity, • • • • Glass conductivity
cells have the virtue of wide fabrication flexibility, but also a
con-comitant drawback of susceptibility to attack by hydroxide, which can
be a limitation in sensitive conductivity measurements. Other materials
from which the cells could be manufactured were ruled out either because
of their lack of structural integrity and rigidity, or because of their
25
the s,ystem from the carbon dioxide of the atmosphere also being considered
important. Glass seeming to possess only the drawback of reaction with
hydroxide, efforts were made to correct this deficiency. Various methods
of applying protective coatings to the glass walls without at the same
time contaminating the platinized electrodes having failed, external
correction was decided upon; another cell with similar materials and
geometry was constructed, and this was used as a reference cell. The
reference cell contained a solution which was identical to the solution
of the experimental cell, with the exception of having no pt complex
present. The changes in the specific conductance of the reference
solution were recorded and then a plot of the change in specific
con-ductance with time was made using the relationship,
6 taCt)
=
1a(O) - tn(t) (III.l4)where taCt) is the specific conductance of the reference solution at
time t. The value for LR (t) at t
=
0 (i.e. taCO)) was obtained by anextrapolation. Using the additivity of specific conductances, the
experimental curve was then corrected by subtraction of the 6 LR ( t)
curve with the resultant difference curve being the changes in specific
conductance due to the reaction of the Pt complex with hydroxide along
with any other reactions of the pt complex which changed the electrolytic
composition of the solution. It was this corrected curve which was then
used in calculating the rate constants for the pt reactions. Chapter rl
will also include experimental evidence for other reactions occurring in
influence the data used in the calculation of the rate constants.
In
the derivation which follows, all the extraneous reactions will be
ignored on the basis of the arguments stated above.
For a system which initially contains only NaOH and KCl as
electro-lytes along with the pt complex, and which reacts according to Eqs.
III.12 and III.lJ, the specific conductivity L at any time t is given
by the equation, .
where c(t) is the normality of the designated electrolyte at times t, A
is its equivalent conductance, and cKCl is not written as a function of
time because it does not enter into the reaction. Inasmuch as the reaction
entails the conversion of hydroxide into chloride through the reaction with
Ft complexes, the following hold true:
cNaCl (co )
=
2Nl (0)~aOH( co ) = cNaOH(O) - ZNl (O)
cNaOH(t)
=
cNaOH(O)- cNaCl(t)cNaCl(t)
=
N2(t)+
2NJ(t)(In.l6)
(III.l7)
(III.l8)
(III.l9)
where N has the signification given in Eqs. III.l2 and III.lJ, and the
n
two reactions are assumed to be going to completion without
any
otherreactions taking place in the system. As the time goes to infinity,
the conductivity will approach an as,y.mptotic value,
L( co) = lo-J(cNaOH( 00 ) A NaOH
+
cNaCl (co) A NaCl+
cKCl A KCl)27
Subtraction of the equalities of Eq. III.l5 from
Eq.III.lO and the
appropriate substitutions from Eqs. III.l6, III.l7, III.l8, and III.l9
yields,
(L(t) - L(
oo)
)103
=
(cNaOH(O) -
N2(t) - 2N3(t)) ANaOH
or,
+
cKCl A KCl
+
(Nz(t)
+
Zl'l3(t)) A
NaCl
- (cNaOH(O) - 2Nl (O)) A NaOH
- cKCl A KCl - ZNl (O) A NaCl
(L(t) - L( oo))lo'J/( ANaOH- ANaCl)
=
2N1
(o)+
N2(t) + 2N3(t)
(Ill.21)
(III.22)
(Ill.23)
Again, through the use of high hydroxide concentrations
inorder to have
the reaction pseudo-first order, or
i fthe reaction is actuallY
zero-order
inhydroxide, the rate expressions are:
(III.24)
(III.25)
and,
(In.26)
The expressions for N1(t),
N2(t), and
N3(t) resulting from these
are:-k:I_t
(III.28)
and,
Substitution of Eqs. III.28 and III.29 into Eq. III.2J results in the
relationship,
(III.JO)
The observations to be made with regard to Eq. III.JO are the following.
L(t) is an experimentally determined variable, and L(oo) is a constant
whose value is determined in the marmer described below. (A NaOH - A NacL)
is a constant according to the arguments given previously. ~ and k2 are
the rate constants to be determined. (L(t) - L(oo)) is a function of the -~t -k2t
form Ae
+
Be , which is equivalent to saying that the changes inspecific conductivity caused by the reactions of Eqs. III.l2 and III.lJ are
expressed as two exponentials with periods characterized by the rate
con-stant for the tl-ro hydrolysis reactions. The ratio of the contribution
29
rl. RESULTS
The nature of the reacting system was shown from the changes
ob-served in the spectrophotometric experiments and the conductometric
experiments. 'lb.e spectrophotometric experiments showed that the species
present which had absorption in the ultraviolet region was undergoing
changes in the presence of hydroxide, and these changes did not occur
when hydroxide was absent. Also, addition of excess acid both as
per-chloric acid and as hydroper-chloric acid caused the spectrum of the solution
to revert substantially to that of the starting Pt complexo The
replace-ment of the ammine ligands was ruled out
b.1
this reversibility to thestarting material, and by the general inertness of the ammine ligands in
1-dichlorodiamm:i.neplatinum(II), which inertness was in part the basis
for such reactions as Kurnakov's test. Grinberg and ~bchikov (22, 23)
and Jensen (25) both have studied the aqueous solutions of this complex,
and have been able to measure an ionization quotient for the acid fo~ed
in the aqueous solution. Finally, the very basis of the conductometric
experiments was the decrease in the conductivity of the solution with
time upon the addition of hydroxide, which changes could be attributed to
the replacement of hydroxide ions in solution by chloride ions-the
experi-mentally measured changes in conductivity were closel1 approximated
theoretically by using estimated values for the equivalent conductance
of the individual ions present in Eqs. III.l2 and III.l3. The estimation
of the equivalent conductances was necessitated by the paucity of such
info~tion to be found in the literature for s,rstems of mixed electro..
31
based upon the Debye-Hueckel observation that electrolytic properties
are a function of the square root of the ionic strength. Plots of the
equivalent conductance as a function of the square root of the ionic
strength were made for solutions of the pure electrolytes, and then
the equivalent conductance of each electrolyte in a mixed solution was
estimated from these plots using the square root of the total ionic
strength of the mixed solution as the determining property. Such a
pro-cedure was justified by the low ionic strengths involved
inthe
experi-ments,
bythe fact that all of the electrolytes were of
univalent-uni-valent type, and because all of the ionic species present were regular
in
their electrolytic behavior.
Hention should be made of extraneous factors which entered into
the system, because the above statements
requiremodU'ication when the
reaction is considered at times in excess of approximately three
half-times of the second hydrolysis reaction. Both the spectrophotometric
and conductometric experiments gave indications that the
pt.complex
underwent reactions other than the primary reactions herein considered.
Af'ter the hydroxide had been exhausted in a conductometric experiment
which contained approximately one equivalent of hydroxide per equivalent
of complex, the conductivity was observed to reverse itself and
startto
increase at a steady rate, thus indicating that either the ionic
con-centration of the solution was increasing, or that ions
withhigher
con-ductance were replacing ions alreacy present, or possibly both were
occurring. One possible explanation is that the hydroxide attack upon
from the glass surface entered the solution evan after the hydroxide of
the solution was depleted. This was ruled out by an experiment in which
a solution containing KCl and NaOH was allowed to sit in a cell for a day,
at which time it was emptied out and replaced by a KCl solution. The
conductivity of this KCl solution remained unchanged for the week during
which measurements were made. It is possible that once the excess of
hydroxide was removed, very slow hydrolysis reactions occurred, with
the system subsequently reaching equilibrium. This explanation fails
to account for the positive deviations from linearity which resulted
when the experimental curves for experiments containing up to twentyfold excesses of hydroxide were resolved into their components using the
method outlined in Chapter III. It also fails to account for the
fact that excess chloride was added to the solutions to prevent hydrolysis
reactions of the chloride ligands occurring to aqy appreciable extent.
In
experiments which contained excess hydroxide9 the plots of ln(L(t)
-L(oo)) deviated positively from linearity after about two half-times for
the second hydrolysis reaction. Further elucidation of this deviation
from linearity arises from a consideration of the changes observed in the
spectra obtained from the reversal of the reaction at long times. While
the reaction was completely reversible during the times used in determi
the rates of reaction (at least any lack of reversibility fell outside
of the sensitivity of the spectrophotometer), after several days the
reversed reaction yielded a spectrum which had a new peak which partially
0
~bliterated the valley for the trans-complex at 2500 A. The unique aspect
,33
cause such a change in spectrum under the experimental conditions which
were obtained. The conclusion which follows from this is that t-here must be
formation of Pt(IV) complexes. That such a conclusion be drawn is the
consequence of the well known proclivity of Pt(II) complexes to undergo
such reactions as decomposition, oxidation, and disproportionation under
ver,y mild conditions. The time involved for the formation of appreciable
amounts of Pt(IV) was such that this cannot be regarded as invalidating
the findings with regard to the base hydrolysis of the
trans-dichlorodi-ammineplatinum(II), even though the greater sensitivity of the
conducto-metric method detected this reaction much sooner than the
spectrophoto-meter. Even in the case of the spectral detection, however, fairly low
concentrations were detectable because all possible Pt(IV) complexes
exhibit an extremely high extinction coefficient in this region. The
general conclusion to be drawn is that despite this manifestation of the
instability of Pt(II) complexes, the general experimental findings were
in no lYclY vitiated because of the time factors involved.
The experimental results are listed in Table 1 for both the
conducto-metric and spectrophotoconducto-metric determinations at 20, 25, and )5°C. No
effort was made to determine the second rate constant at 2ooc because the
reaction in general was so slow that difficulty was encountered in its
determination even at 25°C. Fig. ) shows the spectral changes observed
during the course of a typical reaction, while Fig.
4
shows a typicalconductometric experiment both before and after the application of the
corrective factor for the hydroxide attack on the walls of the cell. The
fable 1. a... ~~·ia of k!u- [Pt(RB:3)ZC12 J
Initial IDitial Added
L(O)a L(O)b
(x
10~
eec-1)k2
~· [Pt(IB:3)~2] . . CB ICl.
( (II X 104 ) (II X 103) (M X 1o2) (x 10:3 obrl orl) (x 1o' obJrol c:rl) (x 1o' eec-1)
210
S.lS
6.7.5 1.03-
0 0 6.21-
d2.25 6.75 1.0:3 c c 6.60 d
4.81 4.56 1.ot. 0 c
s.84
-
d4.92 .5.'70 1.01 c C• 6.18 d
Average 6.21
25 4.74 6.08 0.999 2.8191 2.8181 11.0 0.18
6.~ 6.)9 0.989 2.8690 2.8686
u.s
0.161.20 8.20 0.991 :3.2902 ).2927 10.2
-
•
1.16 6.18 0.996 2.8169 2.8298 10.8
-
•
4.26 6.18 1.o6 2.9129 2.91,S2 9.6:3 0.16
Awrage 10.6 0.17
:3.5 4.29 1.14 1.61 c c 27.5
-
d6.29 0.8:3:3 0.91.5 c c 28.9 d
s.94
1.19 1.6) c c 29.6-
d:3.80 6.7.5 1.04 :3.631.5 :3.64:34 28.9
o.ss
:3.31 0.9)6 1.58 2.883.5 2.88.50 31.6 0.44
Average 29.3
o.so
~rapolated value at t • 0 for specific ccmductivit;r of base IJ1dro]¥sis expert.ntal ao1utians.
~rapolated value at t
=
0 for specitic CCID.ductivit;r of reference so1ut~s. cSpectrophoto.tric detend.natian of the reaction rate.
d.na.
aecond ~ro~is specitic rate constant unobtainable from spectrophotometric data.3
.
65
'-
-EXPERIMENTAL
-IRESULTS
:E0
- --CORRECTED RESULTS
I
35°C
:E :t:
TRANS- [Pt (
NH
3
1
2c1 2]
0
-~0 ..._
__
3.80xlcf4M
. . _
-)( 3
.
55
-...J
I
...
I I IK CI•I.04x
IOc..
M
>-
I
I
~I
I
I
t-
NaOH
=
6.75X ld"3M
I
->
~
3.50
(.) :::J 0z
0 (.)u
3A5
LL
-(.)w
a..
en
3~0~~~~~~--~----L-
__
_ L _ _ _ _ L _ __ _L __~
0
1000
2000
3000
4000
5000
6000
7000 8000
npre
4.
TIME (MIN.)
ExperDantal. and oorreeted renl'b
trc.
a typical conductometric study or thebue ~ reactiaD at )SOC. Initial concentrations were [ Ft(NH3)2Cl2] =
).80 X
J.o-4
II. K01 • 1.04 X ].0-2II.
llaOH=
6 •75
X lo-3 M. The correctionoorrespaod.s
to
the ahaDp 1D ooacliictinty d• to the attack of }Vdroxideon
the glua
ot
the CCDductiYiq oell. The t t . is the time after the inceptionor
the ru.CJU.cm at 11hicb the OGDdaeU.Tity was determinedis shown in Fig.
5.
The hYdroxide attack on the glass was found to be independent of hydroxide concentration, although there was individualvariation from experiment to experiment because of differences in the
surface condition of the glass as is seen in Fig.
6,
which is a compositeof all the corrective factors applied to the various experiments. All
of these curves indicate that there was an initial rapid attack upon the
glass, which corresponds to the attack upon the hydroxide free surface,
followed by a tapering orr when the glass surface becomes saturated with
hydroxide-the cells 1o1ere filled with water between experiments, so that
the surface conditions were changed upon the introduction
of
hydroxide.As is seen in Fig. 4, the nydroxide correction was insignificant with
regard to the first hydrolysis reaction, but became important during
the course of the second reaction, so the uncertainty in the rate constant
for the second reaction is large]J attributable to the variations in the
hydroxide attack, which in turn are attributable to variations in the
surface condition or the glass.
The temperature dependence of both rate constants is given in Fig.
7,
from which the calculated values for 6 H*, 6 F*, and 6
s*
are 18.0 kcal,22.9 kcal, and
-16
cal/OK respectively for the first base hydrolysis, and19.1 kcal, 25.3 kcal, and -21 cal/°K respectively for the second base
hydrol-ysis reaction. Because of the uncertainty in the rate constant for the
sec-ond hydrolysis reaction at .35oc, there is a resultant uncertainty in the
thermodynamic quantities for this reaction. In addition, the usual.
accur-acy with which the activation energy can be detennined is only on the order
of
±
2 kcal, which introduces an additional uncertainty in the entrop,y0.1
'
\.. ~'
...
~
0.05
\
..
·-\
.
\
35°C
TRANS- [Pt(NH3)2C12]
3.80
X1()4 M
\
K Cl =1.04 x 10⁻² M
\
--
I:E
u
I:E
X 0-,.,a
0.01
) (·-·
-
8
\
NaOH
=
6.75 x I.0-3M
\
....J
0.005
I
-
--
....J L...J0.001
0
\
\
'
l
200
400
600
800
1000
1200
1400
[image:43.601.83.682.105.508.2]TIME (MIN.)
Figure
5.
Logarithmic Plot of a portion of the corrected conductivity curve given in Fig. 4, and the resolution of this logarithmic curve into its components.The components represent the reaction periods for the first and second hydrolYsis
reactions for this particular experiment, and also show that portion of the
experimental results which was employed in the detemination of the rate constants
w
-
I::E
u
I ~
:I: 0
--3
.1.
NaOH=6.75 x 10 M
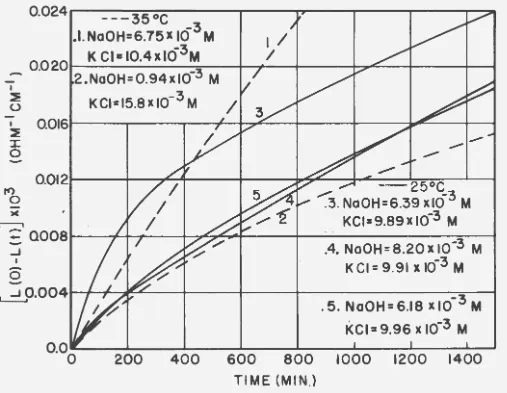
-3
0.0 20I
K
Clz= 10.4 x 10
M
.2.NaOH=0.94xi0-3
M
K
Cl= 15.8
x
I0- 3
M
1/
I
0.0161
I I /I
7 £I
I
,._.,...
I
I
,...
...
0.012
""'
- - 25oc_3
rr>0
.3. NaOH=6.39 xiO
M
;c
·
KCI=9.89XI0-3
M
~
Q008
.4.
NoOH=8.20XI0-3 M
~
KCI= 9.91
x
I0-3
M
§
I'7r
I
I
I
-3
I
~0.0041
r
r
.
5. NaOH= 6.18 X 10
M
KCI= 9.96
XI0-3 M
200
400
600
800
1000
1200
1400
[image:44.593.104.611.92.485.2]TIME (MIN.)
Figure
6.
Composite of the correction curves which were employed in the various conductometric experiments of this stuqy. Each curve represents the attack of hydroxide upon the glass of the conductivity cell under the conditions stated. Because these are corrections, they are presented as the correction increment which must be added to the experimental results. The time is the time after the addition of the hydroxide+ .... +h.o .,,.., n+.",..., !II+. 'LJhi P.n t.nA r.nndnr.tivi.tV WaS measured
.¥
.
(!)
0
_J
-3.3
-5.2
-3.51
':dJ
I
I
1-5
.
3
-3.71
\
"<
I
I
1-5.4
-3.91
" I
{ ~ <I
1-5.5
(\J~
_J
1\
~I
.
1-5.6
g
I
I
,-
I
"
I
-43
t< - 5 . 7
-4.5~---_.---~---~
·3.20
3.30
3.40
3.50
I
[image:45.581.120.643.98.502.2]-,=-(xl03)
Figure
7.
Temperature dependence of the base hydrolysis rate constant for the first andsecond base hyqrolysis reactions of
1- [
Pt(NHJ )2C12] • For the firsf reaction6W=
18.0 kca1/mo1e,6#=
-16 ca1/oK. For the second reaction 6 H = 19.1kcal/mo1e, 6 S'*= -21 ca1/oK.
Fig. 8 shows the chan~es observed in the reversal of the reaction
with time, being a plot of the optical density at three different wave
[image:46.587.5.542.52.674.2]


![Figure 7. Temperature dependence of the base hydrolysis rate constant for the first and second base hyqrolysis reactions of 1- [ Pt(NHJ )2C12] • For the firsf reaction 6W= 18.0 kca1/mo1e, 6#= -16 ca1/oK](https://thumb-us.123doks.com/thumbv2/123dok_us/8113040.237080/45.581.120.643.98.502/figure-temperature-dependence-hydrolysis-constant-hyqrolysis-reactions-reaction.webp)


![Figure 9. Mechanism for the base hydrolysis reaction of ~-[Pt(NHJ)2Cl2], and of ~[pt(NH;)2Cl(OH)]](https://thumb-us.123doks.com/thumbv2/123dok_us/8113040.237080/50.587.62.700.42.516/figure-mechanism-base-hydrolysis-reaction-pt-nhj-cl.webp)
