City, University of London Institutional Repository
Citation: Hanjalic, K. and Stosic, N. (1978). Some aspects of laboratory testing and
computer modelling of two-stage compressors with inter and after-cooling. Proceedings of
the IMechE Conference on Design and Operarion of Industrial Compressors, pp. 11-19.
This is the accepted version of the paper.
This version of the publication may differ from the final published
version.
Permanent repository link: http://openaccess.city.ac.uk/19874/
Link to published version:
Copyright and reuse: City Research Online aims to make research
outputs of City, University of London available to a wider audience.
Copyright and Moral Rights remain with the author(s) and/or copyright
holders. URLs from City Research Online may be freely distributed and
linked to.
City Research Online:
http://openaccess.city.ac.uk/
[email protected]
City, University of London Institutional Repository
Citation: Hanjalic, K. and Stosic, N. (1979). Some aspects of laboratory testing and
computer modelling of two-stage compressors with inter and after-cooling. Energoinvest
Journal for Science, Engineering and Technology, 13, pp. 39-52.
This is the published version of the paper.
This version of the publication may differ from the final published
version.
Permanent repository link: http://openaccess.city.ac.uk/19874/
Link to published version:
Copyright and reuse: City Research Online aims to make research
outputs of City, University of London available to a wider audience.
Copyright and Moral Rights remain with the author(s) and/or copyright
holders. URLs from City Research Online may be freely distributed and
linked to.
City Research Online:
http://openaccess.city.ac.uk/
[email protected]
City Research Online
CITY
UNIVERSITY OF LONDON
-C12/78
SOME ASPECTS OF LABORATORY TESTING AND
COMPUTER MODELLING OF TWO-STAGE
COMPRESSORS
WITH INTER AND AFTER-COOLING
K. HANJALIC, Dipl-lng, MSc, PhDMasinski Fakultet, Sarajevo ar,d V ,
N. STOSIC, Dipl-lng, MSc
Institute Thermal Engineering !TEN - Energoinvest, Sarajevo
SYNOPSIS Laboratory testing and computer simulation of a two-stage reciprocating air compressor with inter and after-cooling was undertaken with the purpose of studying the physical processes occurring in the compressor and obtaining information useful for design purposes. The testing includes measurements of instantaneous temperature and pressure in suction and delivery chambers and interconnecting pipes in both cylinders, instantaneous torque and average quantities, during the steady and transient state operation. Results are presented and the problems are discussed. The suitability of the micro-thennocouple for measurement of instantaneous temperatures, its dynamic behaviour and strength limitations, as well as mounting and calibration problems are considered. The measurement of pulsating pressure by means of piezoelectric and capacitive transducers in combined use are presented with specific reference to the effect of transducer location.
Results are reported of the computer modelling of the thermodynamic processes including the unsteady gas flow in the piping system with friction and heat transfer effects, and comparison made with experimental data. Some practical implications are discussed of the testing and computer modelling upon design.
INTR OD U CT ION
1. The increasing use of reciprocating compress-ors and demands for improvement of compressor performance and reliability, have prompted both the development of laboratory testing techniques and computer simulation methods. These two approaches seem to complement each other; the simulation method, being considerably less
expen-sive, appears particularly suitable for the
predict-ion of the behaviour of new or redesigned com-pressors, but has to draw heavily upon experi-mental data relating to valve characteristics, fluid flow, heat transfer, etc.
2. Some experience of both laboratory
measure-ments and computer modelling of single and two stage reciprocating compressors are reported here. The experiments involved the measurement of the instantaneous pressure and temperature in
cylinder and suction and discharge chambers, and of the instantaneous torque. Also, some results from the model of the two stage compressor will be discussed.
EXPERIMENTS
3. The oscillating charncter of the basic thenno-dynamic processes in reciprocating compressors imposes severe requirements upon the instrument characteristics, particularly when instantaneous variables are to be measured. Although the fund-amental frequency of the oscillating process in a typical compressor is only of the order of several
11
tens of Hz, sharp peaks appear on temperature and
pressure-time profiles. Superimposed are high
frequency pulsations associated with valve move-ment and pressure wave propagations, which de-mand good dynamic response of the instrument. Acceptable frequency response is needed, with small signal distortion. Furthennore, transducers must fit into the available space and the presence of the transducers should not disturb the flow. All these factors pose serious constraints upon instrument selection.
4. Various methods for temperature measurement in reciprocating compressors have been reported, but thin wire based transducers, such as resist-ance thennometers and thennocouples, seem to have the widest applicability. The limited space available for mounting, and the high frequency of temperature change dictate the use of temperature sensing devices of miniature dimensions. How-ever they may not possess the mechanical strength and durability to endure the dynamic forces being exerted upon them. It is known that the resistance thennometer has better sensitivity than the thennocouple of the same wire diameter because the thermocouple head usually has a larger dimension, but the resistance thennometer wire must be longer to achieve the same sensit-ivity in order to eliminate the influence of the ends. For the measurements described here Cr-Al microthennocouples of various wire dia-meters below 100 microns were used;that with the
wire thickness of 12 .S microns was selected as
the optimum satisfying both dynamic response
(
(_
and mechanical durability.
S. The temperature sensed by the wire and the real gas t'emperatu re are related by the energy equation which defines the instantaneous heat balance of the thermocouple head. Neglecting the radiation heat exchange between the thermocouple and the
gas:-w2 2 1t aTw (Tg - ~ cp - Tw)o(Dlrdxdt =
p
cD4
~ dxdt +1T
cf
T+
6
E (T! - T!) D1idxdt + D24
~
dxdt (1)The required gas temperature can be evaluated by
the numerica1 solution of equation (1) if the heat transfer coefficient and the temperature distrib-ution along the wire are known together with other
coefficients appearing in the equation. Some solutions of the simplified forms of equation 1 are
available in literature; in particular if the heat conduction term is neglected then equation 1 be-comes an ordinary differential equation, (Ref. 1). With the assumption of a constant heat transfer coefficient and a knowledge of the temperature and geometry of the surrounding walls, the equa-tion can be further simplified and solved for any given thermocouple. In special cases, when
the changes of the gas temperature and the heat transfer coefficient are defined by a simple analytical function, an analytical solution can be obtained, but this can serve only for the theoretical analysis of the thermocouple response to a regular·
periodic input (18). The method based upon the use of two thermocouples of different dimensions which enable the elimination of the unknown heat transfer coefficients may be mentioned here also. However, often it suffices to consider the simpli-fied form of equation 1 containing the heat
trans-fer term only.
dTW
c -
=
Tg -Twdt
(2)
where
c
= pcD/4d... represents the time constant of the thermocouple. The other effects represent-ed by the other terms in equation 1 are accountrepresent-ed for through static errors, evaluated for each effect separately. The evaluation of the thermo-couple time constant is not always straightforward due to the uncertainty in evaluation of the heat. transfer coefficient. Standard relationships of the form Nu
=
CRem have been used for evaluating the values of the constants with C and m being proposed for each particular geometry and phy-sical condition, but the main problem seemed to be the accurate assessment of the effective gas velocity needed for the calculation of the Re number. Because of the uncertainty in evaluating the gas velocity, values between 2 and 10 m/s were tested in order to assess the influence of the gas velocity upon the thermocouple wire response. In this range the Reynolds number ranges in value from 0.68 to 3.4 for which, according to Hilpert, C and m should be assigned the values of 0.89 and O .33 respectively. Because of the small©!MechE 1978 12
value of the exponent m, the influence of the gas velocity is rather small. So, for 2 m/s the
time constant has a value
1:
= 4 .88 ms, whilefor 10 m/s
'T
= 2.85 ms. Periodic chnnges ofpressure and temperature, causinCJ periodic mechanical stresses in the thermocouple, require careful manufacture of it in order to achieve
satisfactory durability. In addition difficulties are encountered when connecting the thermo-couple wire with compensating leads of consider-ably larger diameter. Fig. 1 shows two of
several variants of the thermocouple used in the experiments. The first achieved an average life
time of about fo,Jr workin,,1 h·::iu~,, while the
second one, with connections between the
thermocouple Wire and the compensating leads outside the body, gave considerably better endurance.
6. In order to verify the thermocouple time
constant and evaluate experimentally its frequency
response, the dynamic calibration of the thermo-couple was performed using the method suggested
in ref. (17). A strong light source with a system
of mirrors and lenses and an orifice, sen.·2d as a
radiation heat source. Between the light source
and the thermocouple a rotating perforated disc
was placed. The rotational speed of the disc
was recorded firstly with a photo-cell and later
with an inductive type transducer. The ratio
of the thermocouple signal amplitudes at a cer-tain ·disc speed to the steady signal gave directly the amplitude-frequency characteristics of the thermocouple, as shown in Fig. 2 together with
typical signal records at 30.7 and 94 Hz. Experimental results, presented in the form of the logarithmic amplitude response, followed qualitatively the form of the first order charact-eristics so confirming the assumption implicit in equation 1. The intersection of the asymptotes corresponds to an amplitude fall of about 3 db,
and this value gives the angular frequency of (00 = 250 rad/s (f=40 Hz) which corresponds to
a time constant value of
'?'
= 4 ms. This resultis in close agreement with the earlier calculated value of
'r
for a gas speed of about 6 m/s. The above analysis and the results obtainedindicate that the thermocouples used can follow only about the first 3 to 6 harmonics of the temperature fluctuations in a typical reciprocating compressor, considering that at 1000 rev/min the basic frequency is 16. 7 Hz. Higher harmonics would require the use of smaller diameter wire and would pose substantial practica 1 problems •
(
_
C
various effects such as different cooling and heating times and rates. The gas temperature was therefore simulated to represent closely a typical temperature-time record in a compressor cylinder and equation (2) was solved numerically to yield the thermocouple temperature Tw. The gas temperature simulation was based upon the experimental resul.ts: expansion and compression processes were represented by polytropic curves obtained from pressure records and cylinder volume calculated from the kinematic relation-ships, while the suction and discharge processes were represented by linear temperature changes. With these assumptions, the actual thermodynamic process was highly simplified, but tne temperature profile obtained served as a good qualitative representation of the actual process for the purpose of evaluating the thermocouple response to the periodic signal which is generated in a compressor cylinder. Results are given in Fig. 3, where the modelled gas temperature is shown together with the calculated thermocouple temperature for two values of the gas velocity, 2 and 10 m/s, and for two wires, 12.S}' and l00p. in diameter. The results show that the 12 . 5 _,u. diameter thermocouple follows the gas temperature closely and could. be accepted for practical use, particularly at higher gas velocit-ies. The largest discrepancy occurred at the peak temperature, where the thermocouples show a temperature 12°c lower than the actual gas temperature. These results confirm the earlier conclusion that the influence of the gas velocity is small, while the inf! uence of the wire diameter is predominant. The thermocouple with wire diameter 100 )A showed a very poor response: the difference between the maximum and minimum temperature was only 25°C whereas the actual difference was more than 2
oo
0c.
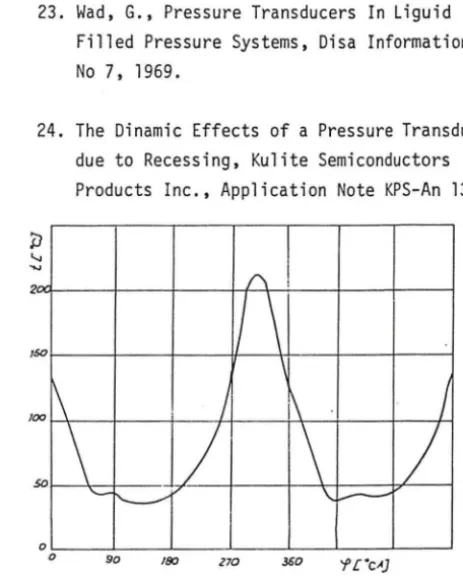
An experimental temperature-time record in the cylinder of the compressor used, showed reasonably good a9reement with the modelled temperature as presented in Fig • 4 •8. For the assessment of the thermodynamic processes, valve functioning and compressor performance in general, the pressure recod in the cylinder serves as a basic parameter. However, depending upon the dimensions and configuration of the fluid inlet and outlet systems and the valve characteristics, the pressure in the suction and discharge chamber may vary considerably, influencing the basic processes in the cylinder. Hence their measure-ment is of importance for analysis of the behaviour of valves and piping system. Of particular
interest are the pressure waves in the inlet and outlet system generated by the valve movement, the dynamic effects of which may influence the compressor efficiency and may be a source of noise. High frequency and low amplitudes impose special requirements upon the measuring instruments, which differ from those for measuring the pres sure in cylinders. In general, the
pressure transducers suitable for measurements in reciprocating compressors should possess, in
13
addition to the usual standard dynamic
characteristics, some additional qualities such as high natural frequency, high sensitivity and small dimensions, and should preferably enable measurement to be made of both absolute and differential pressures. Basically, all pressure transducers could be classified in three groups: transducers with a diaphragm (inductive,
capacitative or resistive), piezoelectric and hot wire or hot film transducers. Piezoelectric transducers have been frequently used for pressure measurements in I .C. engines, being suited for measurements of high frequency and high amplitude pressure pulsations. Their attractive feature is the high mechanical
impedance resulting in a low energy consumption, as well as high natural frequency. This latter feature is of particular use in the present application where even fortieth and higher harm-onics may contribute to the final form of the pressure diagram. Furthermore, because of the high inlet impedance there is no need for external feed back elements, enabling the manufacture of compact transducers of miniature dimensions. The main shortcoming of the piezoelectric transducers, is the high output impedance and the lack of response to a steady signal. The lack of response to a steady signal poses difficulties if the absolute pressure, e.g. the intermediate pressure in a two-stage com-pressor, is to be measured. This difficulty can be overcome by use of special adapters with fast-acting valves which permit rapid connection with the atmosphere or some other known ref-erence pressure (13).
Diaphragm transducers have the widest application for measuring unsteady pressures, both absolute and differential, but their use in reciprocating compressors is somewhat limited by their large dimensions, which prevent mounting them directly at the place where the pressure is to be measured. External mounting with a connecting channel, with its own dynamic characteristics, may result in serious errors.
9. In the present work two types of pressure transducers have been used: the "Kistler" piezoelectric, and the "Di sa" capacitive
diaphragm-type transducer. Because of the small gas velocities and fairly uniform pressure
distribution within the cylinder, the pressure measurements could be performed anywhere in the cylinder, but the transducer mounting is restricted by the compressor geometry. The cylinder head and the valve body usually serve best for this purpose. In spite of small com-pressor dimensions, a piezoelectric transducer was successfully mounted within the valve body as shown in Fig. 5, enabling direct contact of the transducer with the space concerned. However, the capacitive transducer was mounted externally, its diaphragm being conn-ected with the cylinder via a connecting passage drilled through the valve body and the connection lead through the cylinder head.
C
C
This channel must affect the dynamic c
haracter-istics of th~ transducer. In order to evaluate
the effect of the connecting passage, an approx
-imate analysis was performed and the results
compared with the measurements obtained by the
piezoelectric transducer with no such passage. Assuming the pressure changes to be small,and regarding the system as being of the lumped parameter type (justified if the channel length is short compared with the wave length of the fluctuating pressure) the channel behaviour may be represented by a second order linear dynamic system, yielding the ratio of the measured and real pressure in the cylinder in the form of the standard relationship:
E =
vi
(1 - ( ~ )2)+ 4 (_b!.._)2Pc Wo Wo
WO
= c/L·
j
~ V + 1 2s=
4 1T P..L / V 19cv
j
vk + C(3)
(4)
(5)
The natural circular frequency W
...
0 and the dampingfactor
S
for gases for the case when thechannel volume, Vk, and the volume of the space below the diaphragm V (Fig. 6) are of the same order of the magnitude, are given by equations 4 and 5 respectively. Here c is the velocity of sound. From the above relationship it can be concluded that a large volume of connecting passage improves its dynamic characteristics, introducing smaller measuring error. However, the presence of the connecting passage necess-arily increases the compressor clearance, which has several well known effects. In order not to increase excessively the compressor clear-ance, the pressure channel should be kept as small as possible, which is contrary to the earlier defined requirements for better dynamic
characteristics. The pressure channel was
selected to have the shortest possible length. Its maximum natural frequency was evaluated and the pressure measurements compared with those obtained by the piezoelectric transducer.
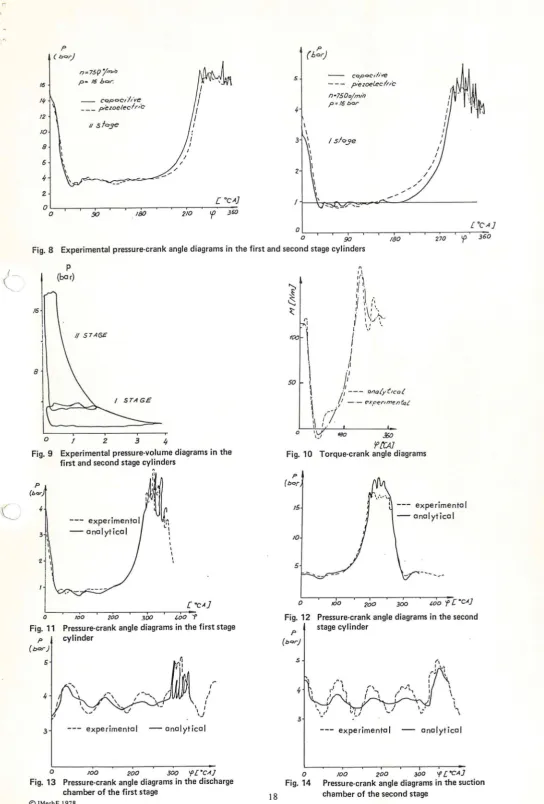
IO.Pressure recording was performed with both piezoelect:·ic and capacitive transducers in the cylinders, suction and discharge chambers and pipe systems of several types of recipro-cating compressor. Fig. 8 shows the compari-son of the pressure record in a first and
second stage cylinder of a two-stage compressor, obtained by piezoelectric and capacitive
transducers. To obtain at least an approximate level of the absolute pressure with the piezo-electric transducer, only the first record, obtained immediately after starting the transducer from rest (before the electric: charge had drifted) was used. Results indicate noticable, although not excessive, differences between the two records. Some small differences could be expected due to the variation of the ambient and working con-ditions, since the rnea s urement s had not been
© l~lcchE 1978 14
taken simultaneously. However, even if the differences in the expansion and compression lines could be regarded as acceptable, the
suction and discharge periods differ considerably.
Both transducers record some pressure
oscill-ations during these periods (generated by the
valve movement) but the record obtained with
the capacitive transducer shows in all cases
considerably higher amplitudes. Since the basic
frequency of the pressure oscillations is about
0.5 kHz, they should be recorded equally well
by both transducers, considering that their frequency response span up to 20 kHz. Perhaps the excessive amplitudes of the pressure
oscill-ations recorded by the capacitive transducer
could be a scribed to the efiect of the connecting
passage. The natural freque:1cy of the passage, calculated from equation 4 was about 800 Hz which is close to the fundamental frequency of the pulsating pressure, yielding near
resonant conditions. W~ th a value of damping
factor
S
= 0.03, as calculated from equation 5,there may have been considerable amplitude
amplification as well as phase shift. Substant-ial changes in the connecting passage dimen· sions were not possible considering the dimensions of the com;:,ressor and the trc;ns-ducer, and the records obtained with the piezoelectric transducer were taken as the more
reliable. However, the capacitive
trans-ducer records served to determine the reference pressure, repairing this deficiency of the piezoelectric trc:,1sducers.
11. In order to evaluate the compressor shaft power and gain some further insight into the dynamics of the moving components of the compressor, torque measurements were made. Several types of torque transducers were used including a self made strain gauge transducer with sliding copper rings for signal transmission. The most satisfactory results were obtained with the commercially available inductive contactless transducer "Vibrometer", which enabled the instantaneous torque to be measured with good accuracy. The recording of the instantaneous torque proved to be especially useful for the inve stig at ion of the transient dynamic behaviour of the compressor, in particular during the initial starting period, when the shaft torque reached a value several times higher than that at steady conditions. Some difficulties with respect to the signal repeatability were experienced initially, when variable speed transmission was used to vary the compressor speed at the constant speed of the driving electrical A. C.
motor. It wa 5 found later that the flexible
C
crank angle during a single cycle of a two-stage two-cylinder reciprocating compressor with cranks of the LP and HP cyiinders displaced by
9
o
0, is shown in Fig. l O for the steady stateoperation. The integral under the curve yielded the average torque and a shaft power that differed only by 3% from the shaft power evaluated by measurement of the driving motor electrical power consumption and the available data for the motor efficiency.
COMPRESSOR SIMULATION BY COMPUTER
12 • During recent years re search efforts have been directed towards the development of powerful and economical simulation methods which will predict compressor performance under working conditions. This approach could complement or replace much expensive laboratory testing. Encouraging results have been achieved, but it is evident that such simulations still have to rely upon data which can only be obtained experimentally. Simulation is achieved by mathematical modelling of the phases in the cyclical physical process: the thermodynamics of expansion and compression in the cylinders, the dynamics of valve motion and the flow through
the valves, the gas flow and the associated wave
motion in the suction and discharge piping systems, heat transfer with the surroundings, and processes in auxiliary equipment. It is notable, however, that the predictions of the pressure wave motion still pose the main difficulties; their simulation takes most of the computing time and is respon-sible for most of the uncertainties which appear in the predictions. Some of the results of the
authors work along these lines will be reported
soon elsewhere (21); here only a brief account will be presented. A series of computer models were developed to describe single and two-stage reciprocating compressors fitted with automatic reed valves. During the development, the results
· published in literature were abundantly used and
some new contributions were made concerning the numerical scheme suitable for the computer calculations. The basic method used was that of Benson et al., but recently some tests employing other numerical methods by MacLaren et al, have given encouraging results.
13.Typical predictions of the pressure-crank angle diagram during one cycle with cylinders of a two stage air compressor with air inter - and after-cooling are presented in figures 11-14, together with experimental records obtained with the piezoelectric pressure transducers, described earlier. The presented results show an acceptable agreement on the whole although some discrepan-cies are noticable on the diagram portions that correspond to the suction and discharge periods, indicating certain deficiencies in the modelling of the valve behaviour, in particular in the case of the second stage cylinder. Fig. 13, 14, pre sent-ing the pressure pulsations in the discharge chamber of the first cylinder and in the suction chamber of the second cylinder.show qualitatively
15
similar results, but even more pronounced discrepancies, clearly indicating some damping of the amplitudes of the predicted pressure variation. Although the applied numerical scheme for solving the flow equations based on the characteristic mesh method for the selected mesh size might have caused some smoothing of the pressure oscillations, the major source of uncertainties is inherent in the assumed valve characteristics which had been selected from data supplied either by the valve manufacturers or available in general literature. An extensive study would be required before these uncertain-ties, the deficiencies of the numerica 1 methods and the assumptions in the mathematical equat-tion could be reduced. Nevertheless the predicted air flow was only 3 .6% higher than that measured, while the predicted volumetric efficiency was O. 823, compared with the measured value of 0.80.
14 .A mathematical model of the dynamics of the the compressor moving parts was also developed. The predicted torque is shown in Fig. l O where it is compared with measured values. The comparison shows a satisfactory agreement despite the crudeness of the mathematical model, indicating that here too, the computer simulation may yield information useful for design and research purposes.
CONCLUSIONS
15 .Some experience of laboratory measurements and computer simulation of reciprocating
compressors has been reported. The application of the microthermocouples for measuring the instant temperatures in cylinders and other elements of the compressors yielded satisfactory results, but also indicated the limitations of the use of wire-based thermometers for transient measurements in reciprocating compressors. For pressure measurement in small compressors the piezoelectric transducers appeared to be most suitable because their small and compact dimensions enable flush mounting. Some experience with the externally mounted capaci• tive transducers and the influence of the inter-connecting channels upon the transducer's dynamic response has also been discussed. The computer simulation of the thermodynamic
processes in the compressor and the dynamics
of its moving parts showed satisfactory quality, but indicated that at present simulat-ions have to be supported by experiments and that further improvements of both the mathemat-ical models and the numermathemat-ical methods of solution should be pursued.
C
_
_,
REFERENCES
1. R.S. Benson, G.W. Brundrett, "Development
of a Resistance Wire Thermometer for
Measu-ring Transient temperatures in Exhaust
Sys-tems of Internal Combustion Engines",
Tempe-rature, its Measurments and Control in
Sci-ence and Industry, Vol 3 (1962) 631-653.
2. R.S. Benson, R.D. Garg and D. Woollatt, A
nu-merical solution of unsteady flow problems.
Int. J. mech. Sci. 6. No. 117, London (1964).
3. R.S. Benson and A. S. U~er, A theoretical and
experimental investigation of a gasodynamic
model for a single stage reciprocating
compre-ssor with intake and delivery pipe systems. J.
mech. Sci. 14, No. 635, London (1972).
4. R. S. Benson, A. Azim and A. S. U~er, Some
further analysis of reciprocating compressors
systems. Proc. 2nd Compressor Technology Conf.,
Purdue University (July 1974).
5. Boiten, R.G., The Mechanics of
Instrumenta-tion, Proc. Instn. Mech. Engrs. Lond.,(177 6269),
1963.
6. BHswirth, L., Messungen an einem
Schellauten-den Kolbenverdichter, Konstruktion, 26,
(143-151), 1974.
7. Davies, P.O.A.L., Measurement and Recording
of Transient Pressures in Unsteady Flow, Proc.
Inst. Mech.Eng., 1966.
8. Doebelin, E.O., Measurement Systems:
Applica-tion and Design, Mc Graw-Hill, 1966.
9. M.I. Frenkel. "Por~nevie Kompressorii",
Masi-nostroenie, Leningrad, (1969).
10. K. Hanjalic and N. Stosic, On the measurements
of the high frequency pressure oscillations
in reciprocating engines (in Serbocroat),
Symp. JUREMA, Zagreb (1975).
11. K. Hanjalic and N. Stosic, Application of
microthennocouples to the measurements of the
instant temperature in reciprocating engines
©IMcchE 1978
(in Serbocroat), Symp. JUREMA, Zagreb (1975)
12. K. Hanjalic, M. Arslanagic and N. Stosic,
Complex laboratory testing of small
reciproa-cting compressors (in Serbocroat), Internal
report, ITEN - Energoi nves t, Sarajevo ( 1976).
13. A.S. Leah, E.P. Booth, C
.
Rounthwaite,
"Dou-ble 1tire method of Resistance thermometry in
Gaseous Explosions", Fuel, Supl. (1955),59-70.
14. Martini, K.H., Messung van Geswechselvorg~ngen
an Brennkraftmaschinen, Technische Rundschau
Sulzer, 1963.
15. J.F.T. Maclaren, A.B. Tramschek, A. Sanjines
and O.F. Pastrana, A comparison of numerical
solutions of the unsteady flow equations
app-lied to reciprocating compressor systems.
J.Mech. engng. Sci. 17, No. 5. London (1975).
16. J.F.
T.Maclaren, A.B. Trarrschek,
A.Sanjines
and O. F. Pastrana, Unsteady
fl 0~1in a
two-stage intercooled reciprocating compressor
system. Instn. Mech. Engr. Conference,
Southampton (1975).
17. V. Pislar et al. "Determination of
microther-mocouple dynamic characteristics", Int.
Semi-nar on Heat and Mass transfer, Hercegnovi,
(1969).
18. L. Stankewitch, "Messung schnellver~nderlidhen
Gastemperaturen und Gasgeschwindigeiten an
einem Zweitakt Dieselmotor",
VDI-Forschun-gsheft 521, (1968).
19. N. Stosic, Mathematical modelling of unsteady
nonhomentropic flows in pipework with complex
boundary onditions. M.Sc. Thesis, Faculty of
Mech. Engng., University of Zagreb (1976).
20. N. Stosic and K. Hanjalic, The application
of the numerical method for solving the
pro-blem of pressure wave propagation in
nonhomen-tropic gas flow in simple pipes. 13th Jugoslav
Congress of Theoretical and Applied Mechanics,
Sarajevo (1976).
(_
(
'-
-·
modelling of two-stage
reciprocating
compressors, To appear
in
Int.
J.
of.
Mech.
Sci.
22. J.A. Vidjakin, T.F.
Kondrateeva,
F.P.
Petro-va and A.G.L. Platonov, Oscillations and
vibrations in reciprocating compressors (in
Russian).
Mashinostroenie,
Leningrad (1972).
I
!
~1
I
>I/Ox/
ro CONPEMSAr,vE w1R,e
WI/IE r' /00 j(
TIIERl10COt.lPLE
80lJY
(AIIA<lJJTTE)
wt,'/E f 12,Sfi
A~Al"ITTE C E~AMIC
1/''ISU{ATO,f
flJ?Al~ITrl:
TrlE.el-fOCOUPlE
tfEA4'
Fig. 1 Thermocouple design
0 5
-I
-z
-~
. s
I
r-j
·6 L..
I I
-71-
,
I - 8 ;.__
I -! J ~
! I I
A/A. - /O
10 20
~t •O,IJ s
"'
"lCOl'fP,CN.SAT/'11£
Wl-'<E .~ Imm
,l,(AJ.~/TTE
THE~f10C'OUPJ.£
Bobr{AUU,tTTE)
/IU8/lEI/ _ Wl"IE f' 12,S,!t
C £~.flflC IIVSUI..ATOI(
..L---~-~_
THE~HOCOI.JPt£HE.II"
J,,,!IOx/
50 loo w.
c.J· 1!13 .-,
l.1•590 .-,
23. Wad, G., Pressure Transducers In Liguid
Filled Pressure Systems, Disa Information,
No
7, 1969.
24.
The Dinamic Effects of a Pressure Transducer
due to Recessing,
Kulite
Semiconductors
Products Inc., Application
Note KPS-An
13.
0 ' - - - - ' - - - ' - - - ' - - - ' - - - ' - - - ' - - - '
0 90 180 Z70 360 'f['CA)
Fig. 4 Experimental temperature record in the cylinder
-C<.Jts·'J
soo 1000
[<18} -II ' - - - ' - - - ' - - - ' - - - ' - - - ' - - - . l - - - J
Fig. 2 Thermocouple amplitude response
200
YI
::::1
0
- -.3o.s J'en,perol"re
/80 Z70 360
---_ f' £"CA]
Fig. 3 Modelled gas temperature and thermocouple response
Fig. 5 Pressure transducer mounting
Fig. 6 Pressure channel
[image:9.605.40.544.51.805.2] [image:9.605.300.532.59.351.2]{_
( '--...
,~
(.
_.../
p
( bor)
16
II/
12
/0
B
6
4
2
0 0
n=75f7/""';, p• 16 bot:
__ copoc,/,·ye
___ pezoelecfr,c
11sfo~
.
--
-180 I
/
-5
3 I
2
[ °CA]
210
If
360a
0 p
(bor)
CQpoctli~
pezoelecloc
n•7500/m1iJ
p •l6 bor
I sloye
90 180 270
Fig. 8 Experimental pressure-crank angle diagrams in the first and second stage cylinders
/6
8
0
p
(bar)
I
I STAGE
2 3 4
Fig. 9 Experimental pressure-volume diagrams in the first and second stage cylinders
p
(bqr)
4
--- experimental
3 I - analytical
I I I I
2
[ "CA] o'---~-,..,oo-~-2~0~0-...--3"TOO--,-t-,o_o __ 'f'
Fig. 11 Pressure-crank angle diagrams in the first stage
p cylinder
(oor)
5
I I ' \J I
3 --- experimental - analytical
,~
I
0 100 200 300 'f'{"CA]
Fig. 13 Pressure-crank angle diagrams in the discharge chamber of the first stage
© IMechE 1978 18
50
0
0
,,
;
r
\
ii;
\
11· I ,•,
I \. 11
I '\' ••
I' ; ~ :../'7' ..
I r \ I \
\
I
\
j
\
F
\ 1 - - - ono/ytico/
\ ___ (, - - exper-ment,,t
\\
/
1
I
'·' J,o
Fig. 10
'f (CA]
Torque-crank angle diagrams
p
(bor
15 --- experimenta I
- analytical
,o
5
---0 JOO 300 too 'f [ "CA}
Fig. 12 Pressure-crank angle diagrams in the second
F'
(oor)
0 Fig. 14
stage cylinder
I
'-,
\
expe rimenta I analytical
100 200 JOO 'f [ "CA]
[image:10.597.17.561.26.830.2]