City, University of London Institutional Repository
Citation:
Strotos, G., Aleksis, G., Gavaises, M., Nikas, K-S., Nikolopoulos, N. and Theodorakakos, A. (2011). Non-dimensionalisation parameters for predicting the cooling effectiveness of droplets impinging on moderate temperature solid surfaces. International Journal of Thermal Sciences, 50(5), pp. 698-711. doi: 10.1016/j.ijthermalsci.2010.11.021This is the accepted version of the paper.
This version of the publication may differ from the final published
version.
Permanent repository link:
http://openaccess.city.ac.uk/13580/Link to published version:
http://dx.doi.org/10.1016/j.ijthermalsci.2010.11.021Copyright and reuse: City Research Online aims to make research
outputs of City, University of London available to a wider audience.
Copyright and Moral Rights remain with the author(s) and/or copyright
holders. URLs from City Research Online may be freely distributed and
linked to.
City Research Online: http://openaccess.city.ac.uk/ [email protected]
1
Non-dimensionalisation parameters for predicting the cooling
effectiveness of droplets impinging on moderate temperature solid
surfaces
George Strotos1,§ , George Aleksis1 , Manolis Gavaises2 , Konstantinos-Stephen Nikas1 ,
Nikos Nikolopoulos1 , Andreas Theodorakakos3
1
Technological Education Institute of Piraeus, Mechanical Engineering Department, Fluid
Mechanics Laboratory, 250 Thivon & P. Ralli str., Aegaleo, 12244, Greece
2
City University London, School of Engineering and Mathematical Sciences
Northampton Square, EC1V 0HB, London, UK
3
Fluid Research Co. 49 Laskareos Str, 11472, Athens, Greece
§
Correspondence author email: [email protected]
Abstract
The conjugate problem of fluid flow and heat transfer during the impact of water droplets
onto a heated surface is studied numerically using the Volume of Fluid (VOF) methodology;
adaptive grid refinement is used for increased resolution at the droplet moving interface. The
phenomenon is assumed to be 2D-axisymmetric and the wall temperature is moderated to
prevent the onset of nucleate boiling. Parametric studies examine the effect of Weber number,
droplet size, wall initial temperature and liquid thermal properties on the cooling process of
the heated plate during the impaction period. The main variables describing the evolution of
the phenomenon are non-dimensionalised with expressions arising from the transient
conduction theory. It is proved that for all cases examined, these non-dimensional expressions
can be grouped together for describing the hydrodynamic and thermal behavior in a similar
manner. Additionally, semi-analytic expressions are derived, which, for a given range of
variation, describe the spatial distribution and the temporal evolution of the temperature of the
wall as well also the heat flux absorbed from the droplet, cooling effectiveness and mean
2
Keywords: droplet, heated wall, VOF, transient conduction
1
Introduction
The interaction of a droplet impinging on a solid wall is an interesting phenomenon which can
be realized in many technological fields, such as internal combustion engines, cooling
systems, fire suppression devices, printing and painting processes and metallurgical
application amongst others. Previous studies suggest that the most influential parameters
affecting the evolution of the phenomenon are the Weber (We) and the Reynolds (Re)
numbers, the liquid-solid wetting contact angle and the surface roughness, the ambient gas
pressure and properties, while the temperature of the wall relative to droplet’s boiling point
plays also a major role. The latter complicates even more the physical phenomenon since
various hydrodynamic regimes may prevail at different wall temperatures. A combination of
the aforementioned parameters can lead to various modes of impact such as spreading,
rebounding or splashing followed by droplet disintegration into satellite droplets. On the other
hand, the increase of the substrate’s temperature can lead to four different regimes, namely
film evaporation, nucleate boiling, transition boiling and film boiling. A detailed description
of these phenomena can be found in [1] among others.
Due to its physical and industrial importance, a large number of experimental and numerical
studies have been performed in order to shed light into the mechanisms governing this
phenomenon. One of the earliest experimental studies was reported in [2], followed later by
[3-17]. In these studies a wide range of We numbers, surface temperatures, liquid materials
and surface qualities have been examined. Important information from these studies include
the determination of the boundaries characterizing the outcome of the impinging regime, the
estimation of the droplet lifetime impinging on a heated wall, the clarification of the
parameters affecting droplet splashing and the estimation of maximum droplet spreading on
the wall, as a function of the above mentioned parameters.
On the other hand, it is challenging to predict by numerical methodologies the various
regimes identified during droplet collision on a heated surface. Over the past decades various
methodologies have been proposed. The Marker and Cell (MAC) methodology was used by
3
Method (IBM) in [26, 27] and the Level-Set (LS) methodology in [28]. One of the most
challenging methodologies is the VOF methodology proposed initially in [29] and also
implemented in the present numerical study. This methodology has been used by [13, 30-35],
in which the spreading of the droplet onto the wall was examined. In [31-33], the
solidification of the droplet was also modeled, while in [34, 35] the levitation of the droplet
for high surface temperatures was predicted. The VOF methodology has been also used from
authors group using the GFS code [36] to predict various cases such as the impingement of a
droplet on a substrate or on a liquid film [37-39], the interaction of a droplet with a heated
wall coupled with evaporation [40-42], the evaporation of suspended single-component and
multi-component droplets in a convective gas environment [43, 44] and also for binary
droplet collisions [45-47]. In these works an adaptive local grid refinement technique was
used [48] reducing the computational cost without loss of accuracy, in contrast with other
methodologies which use a fixed numerical grid.
The present paper is an extension of the work presented by the authors group in [42]; in this
earlier work, the numerical code employed also here has been validated against the
experimental data of [13]. Here, the collision dynamics of a droplet hitting a heated wall is
examined by considering initially a reference case; then, the influence of four parameters is
investigated in detail, quantifying their effect on the heat transfer to the droplet. The details
for the numerical conditions examined are listed in section 4.1. The We and Re numbers
selected, as well as the low wall temperature, ensure that there is no droplet splashing and
thus, the 2-dimensional axisymmetric numerical approach adopted here is justifiable. It is
found that although the variables of interest may exhibit large variations in dimensional units,
when the proposed non-dimensionalisation parameters are adopted, all cases can be described
by simple relationships and semi-analytical expressions for the given range of variation
investigated.
In the following sections of the paper, a short description of the methodology used and some
basic relationships from transient heat conduction theory are presented initially, followed by a
detailed description of the main heat and flow characteristics of the examined cases. Focus is
put to the maximum droplet spreading, the detailed description of the temperature of the wall
at the upper solid surface and on the axis of symmetry, the quantification of the heat flux
absorbed from the droplet and the quantification of the droplet temperature. The conclusions
4
2
Mathematical model
The VOF methodology has been used in this study coupled with the solution of the
conduction heat transfer equation inside the heated wall. The physical properties of liquid and
gas are assumed to be function of local temperature and vapor concentration. The adopted
methodology has been described in detail in [42]. The effect of droplet evaporation is
included as in [42], together with the species diffusion term in the energy equation, as shown
in [43, 44]; both terms play a minor role, but for reasons of completeness are taken into
consideration. In [42] a fixed grid was used for the solid region and an adaptive local refined
grid was applied in the gas-liquid interface in order to enhance accuracy and achieve low
computational cost. The main numerical improvement of the present paper relative to the
work of the authors presented in [42], is the use of adaptive grid refinement both for the
gas-liquid and the solid phases during the simulation process. The advantage of this methodology
is that it reduces the computational cost for the same level of accuracy. Furthermore, the
computational cells on liquid-solid interface are common; this allows for more precise
resolution of the non-linear field equations at the interface without the need for employing
approximate interpolation schemes considering the neighborhood cells. Preliminary tests have
shown that the predictions presented in [42] are reproduced by the present model with the
same numerical accuracy at reduced computational cost. In the present study, 5 levels of local
grid refinement are employed since this was found sufficient for grid independent solution to
be achieved. The grid size at the vicinity of the gas-liquid interface is approximately equal to
D0/130 and the total cells required for the two grids used varied from 5200 at the beginning of
the simulation to 14000 at the time of maximum spreading; a uniform grid with high
resolution as that at the droplet interface would require approximately 1.3 million cells. The
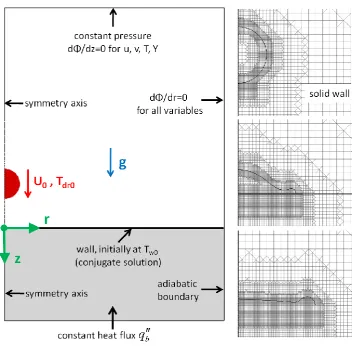
dynamic change of the grid at three instances during droplet spreading is shown in Fig. 1
together with an illustration of boundary conditions adopted in the present investigation; for
reasons of distinctness of this particular figure, a case with four levels of local grid refinement
is shown here. The boundary conditions used are described in more detail in [42]. The
boundary condition at the liquid-solid-gas interface is imposed by modifying locally the
5
3
Heat transfer theory
According to the transient conduction heat transfer theory [50, 51], when two semi-infinite
solids noted as A and B, being initially at different uniform temperatures TA and TB
respectively, are placed in contact, then their common surface reaches the so-called contact
temperature given from:
A A B B c
A B
T T T
(1) p k c
(2)
where the temperatures are expressed in the Kelvin scale. Although the phenomenon is
transient, the contact temperature remains constant in time and depends on the thermal
properties and the initial temperatures of the two materials involved. The term γ is a
weighting factor called thermal effusivity (also described as thermal capacitance in [1]) and
plays an important role since large values of the ratio γ*=γA/γB, results in a near isothermal
material A, i.e. its temperature change is negligible compared to the corresponding
temperature variation for material B. Since semi-infinite solids are assumed, the phenomenon
is one-dimensional and the one-dimensional temperature distribution along the z-axis (e.g. in
solid A) is given from:
( , )
( )
c
A c
T z t T erf
T T
or
( , )
1 ( ) ( )
A
c A
T z t T
erf erfc
T T
(3)
where erf is the error function and erfc is the complementary error function. The variable η is a dimensionless similarity variable, defined as:
2 A
z a t
(4)
where t=0 corresponds to the instant of first contact. Finally, the heat flux transferred through
the interface of the solids changes in time and it is given from:
(0, ) A c A B B c
A B
k T T k T T q t
a t a t
6
Although the theoretic contact temperature has been calculated assuming idealized conditions
between two solid plates (i.e. one-dimensional heat conduction with absence of convection,
semi-infinite solids, perfect contact at their interface and step change of temperature at the
point of contact at the time t=0), it has been also used to predict the contact temperature of an
impinging droplet onto a solid with a finite thickness. The first who made this consideration
was [52] and hereafter many others followed. For the 2-dimensional cases examined here, the
following relationships will form the basis of our analysis:
0 0
,
liq dr sol w c th
liq sol
T T
T
, liq kliqliqcp liq, , sol ksolsolcp sol, ,
* sol liq (6) * 0 , 0 ( , , )
( , , ) w
w
c th w
T z r t T T z r t
T T , * 0 , 0 ( , , )
( , , ) dr
dr
c th dr
T z r t T T z r t
T T
(7)
*
, ( , ) ( )
w th sol
T z t erfc ,
2
sol
sol
z a t
(8)
, 0
0 ,
, ( 0, , )
liq c th dr sol w c th c th
liq sol
k T T k T T q z r t
a t a t
(9)
Equations (7) are the definitions of the dimensionless temperature of wall and droplet and will
be used throughout this study. Equation (8) is the theoretic dimensionless temperature
distribution inside the solid phase and equation (9) is the theoretic transient heat flux
transferred through the upper solid surface (z=0).
4
Results and discussion
4.1
Cases examined
The thermal behavior of the interaction of a droplet with a heated wall is controlled by many
parameters such as the droplet spreading onto the wall and its surface oscillations, the
temperature difference between the droplet and the wall, the temperature of the wall relative
to the liquid boiling point, the pressure and the thermal properties of the different materials
7
on the impact velocity, the droplet size and the liquid physical properties as well as the
liquid-solid contact angle. The purpose of the present study is to examine qualitatively the most
influential of the abovementioned parameters and to derive correlations that group together
the rather scatter nature of the temporal and spatial values of the flow and heat transfer
parameters. A «reference» case study has been chosen and numerical experiments have been
performed changing one parameter each time, creating triplets of data which reveal the effect
of We number (We=40, 50, 60), the effect of droplet diameter (D0=1, 2, 3mm), the effect of
initial solid surface temperature (Tw0=80, 100, 120oC) and finally the effect of the solid
thermal properties relevant to the liquid droplet’s one (γ*=2.56, 5.1, 10.2). In the
aforementioned triplets, the middle case corresponds to the reference case which is presented
in detail in Table 1 while all other examined cases are summarized in Table 2; in Table 2
blank cells denote that the missing value is equal to the one of the reference case, shown at
the top row of the table, while the first column of Table 2 corresponds to the label used for
each case in the figures presented (e.g the label «ref» corresponds to the reference case). In all
cases examined the liquid droplet was water, initially at a temperature of 20oC with an
advancing contact angle of 110o and a receding contact angle of 10o, which are typical values
for water droplets impinging on a stainless steel surface [13, 53]. Although contact angles
depend on temperature, these were assumed to be constant for the range of temperatures
changes induced from the droplet impingement. The properties of the solid plate was those of
a stainless steel, expect of those with different ratio γ* (see Table 1 and Table 2). The
surrounding gas was air at 20oC and pressure 1 bar, while a constant heat flux qb is provided to the wall from its lower surface so as to keep the upper solid surface temperature constant;
the latter is estimated by considering steady state conditions [51]. In the simulations
performed, the droplet was initially located at a distance equal to 1.5D0 from the wall;
preliminary numerical experiments have confirmed that this distance was sufficient enough
for the flow field around the impinging droplet to be developed as if the droplet was travelling
from further upstream.
One of the most influential parameters affecting the droplet collision on a heated wall is the
temperature of the wall relative to the droplet’s boiling point. The wall temperatures
examined and the We and Re numbers selected ensure that no nucleate boiling takes place,
even in the case of the highest temperature of Tw0=120 o
C [13]; for all cases examined, the
droplet remains in contact with the heated wall. Furthermore, the selected We and Re
8
droplet break-up proposed in [7], i.e. OhRe1.2557.7 for all cases examined. That justifies the 2-D axisymmetric approach adopted here.
As it will be shown in the following sections, the temporal evolution and the spatial
distribution of the controlling hydrodynamic and thermal quantities exhibit large differences
in dimensional units. On the other hand, using appropriate dimensionless parameters, all these
data collapse to curves with much shorted range of variation between cases. This can provide
a basis for the prediction of a large number of cases for the range of parameters investigated
in the present paper.
The variables examined will be presented in two forms: a dimensional and a non-dimensional
one. Time is non-dimensionalised with D0/U0 as t *
=tU0/D0; the convection timescale (D0/U0)
has been widely used in droplet impingement dynamics where a wide range of droplet
diameters and impact velocities have been considered, for example, [13, 18-20, 24-27] among
others. The magnitudes which are related with temperature and heat fluxes will be
non-dimensionalised using the theoretic contact temperature Tc,th (see equations (7) and (9)) and
not the initial wall temperature Tw0 which seems to be the rational choice. This has been
found to give better results, especially for the cases in which different solid thermal properties
were assumed. It can also provide a measure of the deviation from the transient heat transfer
theory for semi-infinite solids. Time t=0 corresponds to the time of first contact between the
droplet and the solid surface. Finally, in order to increase the readability of the figures, some
of the cases are omitted from the presented plots. Typically, these include the curves
corresponding to the cases with different We number since they evolve generally in a very
similar manner as the reference case.
4.2
Droplet spreading
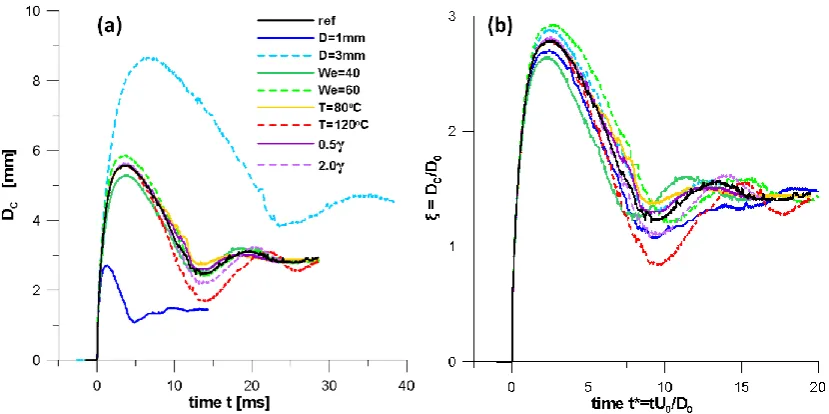
The temporal evolution of droplet spreading on the solid surface for all cases examined is
shown in Fig. 2a and Fig. 2b in dimensional and non-dimensional units, respectively. As it
can be seen, all cases exhibit similar behavior. Initially, the droplet spreads rather fast onto
the solid wall, reaching a maximum deformation and later it recoils towards its centre. After
the pass of the recoiling phase, a second expansion takes place with decreasing amplitude
since the available kinetic energy is gradually lost due to viscous dissipation. Finally, the
9
the oscillations of the droplet’s surface is in the order of 16 / ( 2 D3) as suggested in [2]. This result to different oscillating periods for the droplets examined due to the variable
droplet size and variation of its thermo-physical properties as influenced by the droplet’s
heating rate.
The maximum dimensionless spreading increases with increasing We number and droplet
size. The initial solid surface temperature, as well as the solid thermal properties doesn’t seem
to affect the droplet’s maximum spreading since the same advancing contact angle was
assumed for all cases examined (the effect of contact angle in maximum spreading is shown
later in equation (10)). In fact, an increasing theoretic contact temperature results in a slight
increase of the droplet’s spreading, since surface tension force at the triple phase region
(solid-liquid-gas) decreases and allows for higher maximum spreading.
The prediction of the maximum spreading of a droplet impinging onto a wall has been
addressed in many previous works, for example [5, 54-56]. A simple and reliable formula is
that described in [54]:
,max max,
0
12
3 1 cos 4 Re
c th adv D We D We
(10)
In the same reference, it has been estimated that the droplet reaches its maximum spreading
theoretically at a non-dimensional time equal to:
* max,
8 3
th
t (11)
Remarkably, this time does not depend on other parameters such as Re or We numbers. The
present numerical results agree quite well with equations (10) and (11) within an accuracy of
2% for the maximal droplet spreading and 10% for the corresponding dimensionless time.
Thus, equations (10) and (11) can be considered accurate enough and thus, they will be used
throughout the present study for the derivation of semi-analytic expressions.
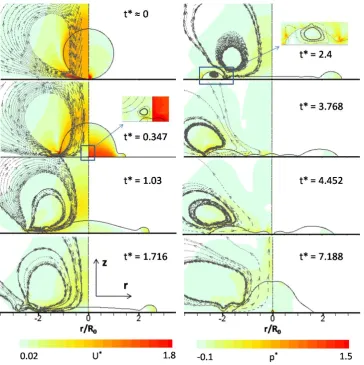
In Fig. 3 results from the simulated flow field of the reference case are presented at selected
time instances. On the left-hand-side of the pictures of Fig. 3, the dimensionless velocity
magnitude along with the streamlines is presented, while on the right-hand-side the
10 * 0 U U U
, * 0
2 0 4 1 2 liq p p D p U (12)
In the dimensionless pressure’s definition, the term inside the brackets is equal to the initial
pressure inside the droplet; using this definition, all cases exhibit the same value range for the
pressure field independently of the droplet size and impact velocity. At the initial time
instants of impact a maximum dimensionless pressure approximately equal to p*≈ 8, is built
up locally at the point of droplet’s initial contact with the solid substrate, while the mean
volume-averaged dimensionless droplet pressure is approximately 0.6 for all cases examined.
Later on, the pressure becomes almost uniform inside the droplet with a mean value of −0.06
(lower compared to the initial droplet pressure); local picks can be observed at the droplet’s
rim and the advancing points that have a relatively high local radius of curvature. Inside the
droplet a gas bubble is entrapped (caused from the initial pressure rise in the gas layer) as it
can be seen in the enlarged region at t*=0.347; this has been also reported in [1, 5]. The
approaching droplet squishes the gas layer existing beneath it; this induces locally high gas
velocities having magnitude approximately equal to 5U0. The droplet expands in the radial
direction and reaches its maximum spreading when its initial kinetic energy is lost due to
surface tension forces and viscous dissipation. Still, a portion of liquid mass continues to flow
outwards forming a recirculation zone at the droplet’s rim (t*=2.4). Rim thickening and
formation of a neck can be observed at the region where the rim is connected with the liquid
forming the lamella. At subsequent times, the droplet starts to recede and at time t*≈4.4 the
lamella breaks-up at the symmetry axis; then, a hole at the droplet centre is formed.
Nevertheless, due to the velocity field induced within the liquid phase, the lamella joins again
with the remaining liquid inducing at the same time the entrapment of a gas bubble. The
volume of the first bubble identified at t*=0.347 is equal to around 6∙10-4V0, while the volume
of the second bubble entrapped at t*≈7 is equal to around 7.5∙10-4V0. The greater volume of
the second bubble may be attributed to the different mechanisms controlling these
phenomena.
4.3
Temperature at upper solid surface
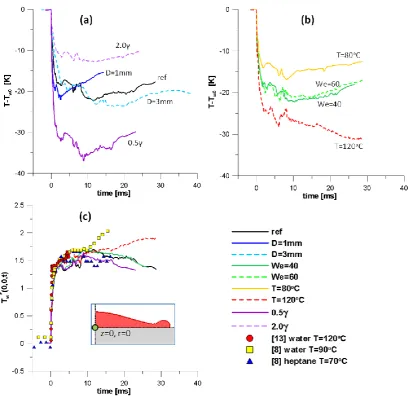
The temporal evolution of the temperature of the upper solid surface at the centre of impact
11
more convenient to present the temperature drop relative to the initial wall temperature, since
various initial solid surface temperatures have been considered. The time axis is now
dimensional (in ms), since as referred in [13], the temperature of the solid surface drops very
fast, irrespectively of the impact velocity and droplet size; this is confirmed by the present
analysis as well. The cooling of the substrate depends generally on the initial temperature of
the droplet which is not examined here since a constant initial droplet temperature equal to
Tdr0=20 o
C for all cases examined has been considered. It also depends on the initial solid
surface temperature Tw0 and on the ratio of thermal properties of the liquid and solid phases,
expressed by the variable γ*. Surface cooling increases with increasing initial surface
temperature since there is a greater amount of energy available to be transferred and decreases
with an increase of the ratio γ*. Other parameters, such as We number and droplet size doesn’t
affect the temperature drop; this is in accordance with the findings reported in [13]. In Fig. 4c
the aforementioned plots are non-dimensionalised with the theoretic temperature drop i.e.
Tc,th-Tw0; the experimental results of [8, 13] are also presented. For reasons of distinctness of
these plots, only representative curves are shown. In [13] a water droplet at 25oC falling onto
a stainless steel solid surface initially at 120oC was examined, while in [8] water and
n-heptane droplets (γwater=1589, γheptane=435) falling on stainless steel surface at 90 o
C and 70 oC,
respectively, were examined. As it can be seen, the present results are well compared with the
experimental data of [8, 13]. It is interesting to notice that for all cases examined here, the
solid surface temperature changes in a similar manner. The dimensionless temperature drop is
fast, reaching values between 1.4 and 1.6. It is worth noticing that the wall temperature falls
below the theoretic contact temperature; this fact is clearly shown in the experimental works
of [8, 57, 58] and according to [8], the enhanced surface cooling is owed to the forced
convective motion of the droplet. The wavy form of the curves is a result of the gas bubble
entrapped, which affects the thermodynamic properties locally at this region and affects the
temperature evolution. Furthermore, the movement of the gas bubble and not just its presence
amplifies this phenomenon.
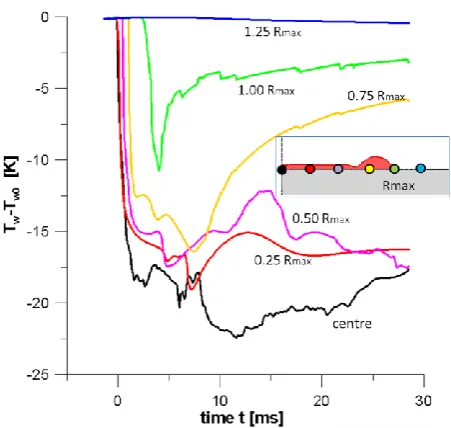
Continuing, the temporal evolution of the temperature of the upper surface of the solid at
various distances from the axis of symmetry (z=0, r) is presented in Fig. 5; these results
correspond to the reference case. The temperature at the axis of symmetry along with the
predicted temperature history at r/Rmax= 0.25, 0.5, 0.75, 1.00 and 1.25 are shown. There is a
time delay for the response of the temperature as the distance from the axis of symmetry is
increasing, as also a lower decrease in temperature. At r=1.25Rmax the solid temperature is
almost unaffected from the droplet collision (the dimensionless temperature is less than 0.03)
12
occurs at a distance between 1.15 and 1.25Rmax. This is an important outcome since it is
concluded that for an effective spray cooling, droplets should have a distance between them
less than 1.3-1.5 of their maximum spreading.
4.4
Solid temperature at centre at various depths from the upper
surface
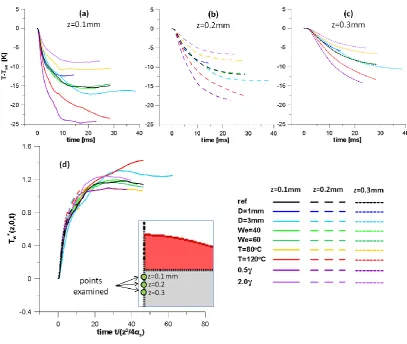
Having examined the upper surface of the substrate, the temporal evolution of the solid
temperature on the axis of symmetry (r=0) at various distances from the upper surface is
studied. Three distances from the upper solid surface were considered located at z=0.1, 0.2
and 0.3mm, respectively. The results of all cases examined are shown in Fig. 6a, b and c
respectively. The comments made for Fig. 4 also apply in this case. Additionally, the
temperature inside the wall is less affected as the distance from the surface increases.
Moreover, there is a slower response to the temperature change with increasing distance.
Despite the fact that the curves in Fig. 6a, b and c exhibit a different behavior since they are
both time and space dependent, they can be grouped together by non-dimensionalising the
temperature in the same way as in Fig. 4c and the time by using the timescale z2/4αsol which
arises from the similarity variable of equation (4). Now all curves exhibit a similar behavior;
deviations are observed only during the recoiling phase (Fig. 6d) due to the different droplet
oscillating frequency. It has to be noted that the non-dimensional temperature could be plotted
versus the dimensionless similarity variable η which could also give promising results; however this case was not found convenient as this parameter is inversely proportional to
time.
4.5
Plots at maximum spreading
After having examined the temporal evolution of the most influential parameters, our interest
is now focusing on the spatial distribution of temperature at the characteristic time of
maximum spreading (t=tmax). The temperature distribution relative to the initial solid surface
13
surface is plotted in Fig. 7a. As it can be seen, there is a high temperature drop at the surface
and as the distance from the upper surface increases, the temperature seems to be unaffected
from the droplet collision. A general conclusion cannot be extracted from the curves in Fig.
7a. On the other hand, by non-dimensionalising the temperature and plotting it versus the
dimensionless similarity variable of equation (8), all curves converge to a single one as shown
in Fig. 7b. A satisfactory approximation of these curves, although not necessarily a best fit, is:
* 1.4
2
w
sol
z T erfc
a t
(13)
In this expression, the factor 1.4 denotes the deviation from the transient conduction heat
transfer theory expressed by equation (8). The curve corresponding to equation (13) is also
shown in Fig. 7b. This relation has greater validity since it depends both on the time and the
depth inside the wall. An inspection of Fig. 6d and Fig. 7b reveals that equation (13) can be
used to describe satisfactory the temperature of every point of the wall in the symmetry axis
at any time.
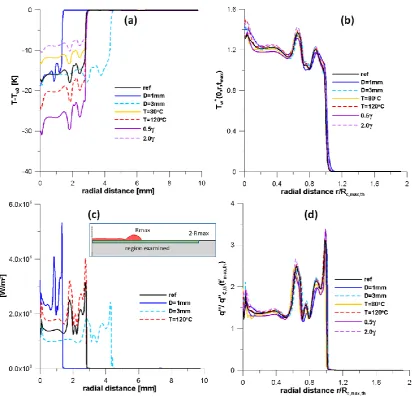
Finally the distribution of temperature and heat flux in the radial direction on the upper solid
surface (z=0, t=tmax) is studied. The temperature distribution is shown in Fig. 8a; Fig. 8b
expresses the same variation but this time in dimensionless form. The radial distance is
non-dimensionalised with the theoretic maximum contact radius. The dimensionless temperature
distribution has the same form for all cases examined. Its wavy form is primarily owed to the
non-uniform thickness of the liquid mass and secondarily to the non-perfect contact of the
liquid phase with the wall, i.e. the entrapment of a small portion of gas between the liquid and
the solid. The corresponding heat flux distribution is shown in Fig. 8c and Fig. 8d in
dimensional and non-dimensional units, respectively, adopting equation (9). The reasons for
selecting the transient reference heat flux are explained in section 4.6. The heat flux
distribution has the same form for all cases examined and its maximum values are observed at
the edge of the droplet, where the cold liquid front meets the hot wall. This is also governed
by a wavy form and a local maximum is observed at 0.6-0.7Rmax due to the neck formed at
this region. Similar trends for the temperature and the heat flux distribution have been
presented in previous numerical studies such as those of [13, 27].
In Fig. 9 the dimensionless temperature field T*
TTdr0
Tc th, Tdr0
is shown on right-hand-side and the corresponding heat flux field on the left-right-hand-side, respectively. The heat14
from a limitation of the graphics software used to calculate the gradients of temperature when
connecting grids are used. The temperature beneath the liquid falls rapidly in the entire
contact region during the droplet expansion. At the receding phase, despite the fact that the
droplet has reduced its contact region with the wall, the wall’s temperature remains still low
(t*=7.188) at the points where there was a previous contact. The gas phase temperature
exhibits a spatial distribution affected by the recirculation zone in the gas phase (see Fig.
3).The dimensionless heat flux exhibits its pick values at the front of the droplet and at the
points where the lamella is thinner.
4.6
Mean heat flux per unit area absorbed from the droplet
The time evolution of the mean heat flux per unit area absorbed by the droplet is shown in
Fig. 10a. The heat flux transferred to the liquid droplet exhibits large values at the initial
stages of contact (theoretically infinity) and then decreases with time more than one order of
magnitude. It increases with increasing theoretical contact temperature and with decreasing
droplet size.
In [13] the mean heat flux absorbed by the droplet was estimated using the boundary layer
theory for axisymmetric stagnation flow. Preliminary tests performed here confirm the
formula proposed in [13] but with the replacement of Tw0 with Tc,th; this can provide a good
non-dimensionalisation for the curves of Fig. 10a since they all converge to a single one and
at time of maximum spreading they all have a value equal to around 1.4. On the other hand,
the problem that they all change more than one order of magnitude during the evolution of the
spreading still exists.
The approach adopted here, is to non-dimensionalise the curves of Fig. 10a with the transient
conduction heat flux of equation (9) expressed from the liquid side. The results are shown in
Fig. 10b and as seen, all curves are grouped together and furthermore, the temporal variation
of dimensionless heat flux has been suppressed (it varies between 1 and 2 due to the
oscillatory motion of droplet on the wall); thus it can be considered relatively constant in time
and equal to 1.7. This is an important outcome, since the mean heat flux absorbed from the
droplet can be estimated as:
, 0
, ( ) 1.7 , ( ) 1.7
liq c th dr liq mean c th
liq
k T T
q t q t
a t
15
4.7
Thermal energy absorbed from the droplet
The total energy absorbed by the droplet is also of interest to a number of applications. This
can be estimated through integration of the heat flux absorbed from the droplet in time and
space. The results are shown in Fig. 11a. The energy absorption from the droplet increases
with droplet size and impact velocity, since the available area for the heat to be transferred
increases as also increases with the increase of the theoretical contact temperature. The
cooling effectiveness of the droplet was defined in [13] as the energy absorbed from the
droplet, non-dimensionalised with the maximum energy that the droplet can absorb, while the
phase change was neglected since it plays a minor role for the low wall temperatures
examined. Here a similar approach is adopted, but the initial wall temperature Tw0 has been
replaced with the theoretic contact temperature Tc,th:
, 0 0
,max , , 0
( )
t A
liq liq tot
liq imum liq p liq c th dr
q dA dt Q
t
Q m c T T
(15)This parameter is plotted versus the non-dimensional time in Fig. 11b. It is increased for small
droplets due to their smaller thermal mass and high We numbers due to increased spreading,
while the theoretic contact temperature doesn’t affect significantly the cooling effectiveness.
For practical applications, it may be of interest to predict in an analytic way the cooling
effectiveness without the need of solving the complicated field equations. A semi-analytical
expression for the temporal evolution of cooling effectiveness can be obtained by combining
equation (15) with the transient conduction heat flux of equation (14) and integrate in time
and space:
2
0 0 3 ( ) 1.7
2 t liq th a t dt D t
(16)The correction factor of 1.7 has been used to correct the heat flux as it has been shown in
previous section 4.6. In the integral of the nominator of equation (16), a transformation of t
16 * 2 * * 0 3 1
( ) 1.7
2 Re Pr
t
th t dt
t
(17)Also, the following definitions are adopted:
2* * t t , * * * 0 ( ) t
t dt
(18)Based on the definitions (18), the theoretic cooling effectiveness is given from:
*
3 1
( ) 1.7 ( )
2 Re Pr
th t t
(19)
The integral Ω is difficult to be calculated analytically and in Appendix it is estimated by
using numerical integration as:
* *
max,
( )t th ffit( )t
(20)
2max, *
max, max, *
max, th th th th t t
(21)
*
*
2.93638
( ) 7.55422
0.29491
fit
f t EXP
t
(22)
where the subscript «max» refers to the time of maximum spreading. Finally, the
semi-analytical expression for the cooling effectiveness is:
* max,
( ) 1.7 ( )
th t E th ffit t
(23)
max, max,
3 1
2 Re Pr
th th
E
(24)
In Fig. 12a the cooling effectiveness predicted with the VOF methodology is plotted
normalized with the term Emax,th, while the theoretical fit curve is also shown. The
semi-analytical expression predicts accurately the normalized cooling effectiveness of droplets.
Small deviations exist at the receding phase due to the different recoiling frequencies of the
droplets. This is an important outcome, since an expression can now been given to quantify
the thermal energy absorbed from the droplet at any time:
* *
, ( ) ,max max, 1.7 ( )
liq tot liq imum th fit
17
Randomly selected cases of Fig. 11a are re-plotted in Fig. 12b along with curves
corresponding to the semi-analytical expression of equation (25) denoted with symbols. The
discrepancies observed at the recoiling phase could be avoided if a more accurate expression
for the integral Ω (e.g. a fit curve of a tenth degree polynomial) and for the assumed value of
the heat flux absorbed from the droplet of equation (14), i.e. a sinusoidal function, were used.
On the other hand, such a calculation is not performed here since the aim of the present
analysis is to keep it as simple as possible.
4.8
Mean droplet temperature
Droplets during their impact and spreading on the hotter surface are heated-up. The temporal
evolution of the mean volume-averaged droplet temperature for all cases examined is shown
in Fig. 13a. Initially the droplet’s temperature increases rapidly and later it continues to
increase but with a decreasing rate. The heating rate of the droplet is mainly affected by the
temperature difference between the droplet and the substrate, which decreases with time and
results in a decreasing droplet’s heating rate. Droplet’s warming-up increases with the
increase of the theoretic contact temperature, with increasing We number since there is more
available contact area for heat transfer and finally increases with decreasing droplet size owed
to the decrease of the available thermal mass (~ρD3cp). On the other hand, evaporation source
terms tend to suppress the temperature rise, but this effect is less important for the conditions
considered here. The non-dimensional temperature increase of the droplet using the theoretic
contact temperature is shown in Fig. 13b.
It is interesting to examine theoretically the temperature of the droplet. An energy balance on
the droplet’s mass gives:
,
liq p liq liq c
T
Vc q A t , 3 0 6 D V ,
2
4
c c
D
A (26)
Using the transient heat flux of equation (14), the dimensionless heating rate of the droplet is
equal to:
* 2
* *
3 1
2 Re Pr
dr th T E t t
18
where Eth represents the dimensionless temperature change rate (the same magnitude
expressed at maximum spreading has also been appeared in section 4.7). By integrating
equation (27) in time, it can be concluded that the temporal evolution of the dimensionless
mean droplet temperature is given from the same relationship as the one of the cooling
effectiveness:
* *
, max, 1.7 ( )
dr mean th th fit
T E f t (28)
The latter is not surprising, since the nominator and the denominator of equation (15)
represent the right and the left-hand-side, respectively, of equation (26) when integrated in
time; that is why Fig. 11b is identical to Fig. 13b. Unfortunately, the aforementioned results
have not yet been validated against experimental data; the only relevant published work is
that [15], but the results presented there refer to the total temperature rise of droplets and not
the temporal evolution of the temperature, which bounce off a heated wall. Furthermore, the
wall temperatures examined in [15] are close to the Leidenfrost point; thus, direct comparison
with the present results cannot be performed.
5
Conclusions
The VOF methodology has been used to predict the complicated transport phenomena
occurring during the impact of a droplet onto a heated wall at the film evaporation regime,
while an adaptive local grid refinement technique was used in both the gas and
liquid-solid regions, achieving low computational cost without loss of accuracy. The effect of We
number, droplet size, wall temperature and solid thermal properties has been studied
parametrically. Using appropriate non-dimensionalisation variables which originate from the
transient heat conduction theory for semi-infinite solids, it has been proved that a wide range
of cases can be described by simple semi-analytical expressions. If the theoretic contact
temperature, maximum theoretic spreading and the corresponding time are known from the
equation (6) , (10) and (11), respectively, then the following conclusions can be drawn:
1) The dimensionless temperature of the upper solid surface at the symmetry axis falls
40-60% more than theoretically expected one, while it is almost unaffected at
19
2) The in-depth dimensionless temperature of the wall at the symmetry axis can be given
by equation (13). A 40% deviation from the transient conduction heat transfer theory
exists.
3) The heat flux absorbed from the droplet exhibits large variations in time and it is
approximately 70% higher than the theoretic one given by equation (14).
4) The temporal evolution of the cooling effectiveness of a droplet and its dimensionless
temperature are described from the same semi-analytic expression, i.e. equation (28)
along with equations (21),(22) and (24).
6
Appendix
In the analysis in section 4.7 the term
t* 2 t* and the integral Ω appear. The integral Ω is difficult to be calculated analytically, since an analytic expression for the temporalevolution of dimensionless spreading does not exist. In order to calculate its value, the term ω
is plotted in Fig. 14a normalized with its value calculated theoretically at maximum spreading
*
max,th tmax,th
for all cases simulated and integrated numerically as shown in Fig. 14b. A
best fit curve for the data of Fig. 14b is used to approximate the integral Ω. This curve, called
ffit, is also shown in Fig. 14b and it is given from the relationship:
* *
max,
( )t th ffit( )t
,
2 max, *
max, max, *
max, th th th th t t * * 2.93638
( ) 7.55422
0.29491
fit
f t EXP
t
20
7
Nomenclature
Roman symbols
Symbol Description Units
A surface area m2
cp heat capacity J/kgK
D droplet diameter m
Eth
theoretic non-dimensional droplet
temperature change rate -
k thermal conductivity W/mK
Oh Ohnesorge number Ohliq/ liq D0 -
p pressure Pa
Pr Prandtl number -
q heat transfer rate W
q heat flux W/m2
b
q heat flux given from below W/m2
Q thermal energy J
R radius m
r distance from symmetry axis m
Re Reynolds number ReliqU D0 0/liq -
T temperature K
t time s
21 infinite solids
U velocity m/s
V volume m3
We Weber number WeliqU D02 0/ -
z distance from upper surface m
Greek symbols
Symbol Description Units
α thermal diffusivity m2/s
γ thermal effusivity J/m2Ks0.5
γ*
ratio of thermal effusivities γsol/γliq -
ε cooling effectiveness -
η similarity variable -
θ contact angle degrees
μ viscocity kg/ms
ξ spread factor -
ρ density kg/m3
σ surface tension N/m
Φ general magnitude
ω term 2 *
t
-
22
Subscripts Overscripts
Symbol Description Symbol Description
0 initial Φ* non-dimensional Φ
∞ infinity Φ″ Φ per unit area
adv advancing
c contact
dr droplet
liq liquid
max at maximum spreading
rec receding
sol solid
th theoretic value
w wall
8
References
[1] Rein M., Drop-Surface Interactions, Springer, New York, 2002.
[2] Wachters L.H.J., Westerling N.A., The Heat transfer from a hot wall to impinging water
23
[3] Akao F., Araki K., Mori S., Moriyama A., Deformation behaviors of a liquid droplet
impinging onto hot metal surface, Transactions of the Iron and Steel Institute of Japan, 20
(1980) 737-743.
[4] Xiong T.Y., Yuen M.C., Evaporation of a Liquid Droplet on a Hot Plate, International
Journal of Heat and Mass Transfer, 34 (1991) 1881-1894.
[5] Chandra S., Avedisian C.T., On the Collision of a Droplet with a Solid-Surface,
Proceedings of the Royal Society of London Series a-Mathematical Physical and Engineering
Sciences, 432 (1991) 13-41.
[6] Anders K., Roth N., Frohn A., The Velocity Change of Ethanol Droplets During Collision
with a Wall Analyzed by Image-Processing, Experiments in Fluids, 15 (1993) 91-96.
[7] Mundo C., Sommerfeld M., Tropea C., Droplet-wall collisions: experimental studies of
the deformation and breakup process, International Journal of Multiphase Flow, 21 (1995)
151-173.
[8] Qiao Y.M., Chandra S., Boiling of droplets on a hot surface in low gravity, International
Journal of Heat and Mass Transfer, 39 (1996) 1379-1393.
[9] Ko Y.S., Chung S.H., An experiment on the breakup of impinging droplets on a hot
surface, Experiments in Fluids, 21 (1996) 118-123.
[10] Bernardin J.D., Mudawar I., Walsh C.B., Franses E.I., Contact angle temperature
dependence for water droplets on practical aluminum surfaces, International Journal of Heat
and Mass Transfer, 40 (1997) 1017-1033.
[11] Bernardin J.D., Stebbins C.J., Mudawar I., Mapping of impact and heat transfer regimes
of water drops impinging on a polished surface, International Journal of Heat and Mass
Transfer, 40 (1997) 247-267.
[12] Bernardin J.D., Stebbins C.J., Mudawar I., Effects of surface roughness on water droplet
impact history and heat transfer regimes, International Journal of Heat and Mass Transfer, 40
(1997) 73-88.
[13] Pasandideh-Fard M., Aziz S.D., Chandra S., Mostaghimi J., Cooling effectiveness of a
water drop impinging on a hot surface, International Journal of Heat and Fluid Flow, 22
24
[14] Sikalo S., Marengo M., Tropea C., Ganic E.N., Analysis of impact of droplets on
horizontal surfaces, Experimental Thermal and Fluid Science, 25 (2002) 503-510.
[15] Castanet G., Lienart T., Lemoine F., Dynamics and temperature of droplets impacting
onto a heated wall, International Journal of Heat and Mass Transfer, 52 (2009) 670-679.
[16] Shen J., Graber C., Liburdy J., Pence D., Narayanan V., Simultaneous droplet
impingement dynamics and heat transfer on nano-structured surfaces, Experimental Thermal
and Fluid Science, 34 (2009) 496-503.
[17] Panao M.R.O., Moreira A.L.N., Heat transfer correlation for intermittent spray
impingement: A dynamic approach, International Journal of Thermal Sciences, 48 (2009)
1853-1862.
[18] Hatta N., Fujimoto H., Takuda H., Deformation process of a water droplet impinging on
a solid surface, Journal of Fluids Engineering, Transactions of the ASME, 117 (1995)
394-401.
[19] Fujimoto H., Hatta N., Deformation and rebounding processes of a water droplet
impinging on a flat surface above leidenfrost temperature, Journal of Fluids
Engineering-Transactions of the ASME, 118 (1996) 142-149.
[20] Zhao Z., Poulikakos D., Fukai J., Heat transfer and fluid dynamics during the collision of
a liquid droplet on a substrate .1. Modeling, International Journal of Heat and Mass Transfer,
39 (1996) 2771-2789.
[21] Fukai J., Shiiba Y., Miyatake O., Theoretical study of droplet impingement on a solid
surface below the Leidenfrost temperature, International Journal of Heat and Mass Transfer,
40 (1997) 2490-2492.
[22] Waldvogel J.M., Poulikakos D., Solidification phenomena in picoliter size solder droplet
deposition on a composite substrate, International Journal of Heat and Mass Transfer, 40
(1997) 295-309.
[23] Butty V., Poulikakos D., Giannakouros J., Three-dimensional presolidification heat
transfer and fluid dynamics in molten microdroplet deposition, International Journal of Heat
25
[24] Bhardwaj R., Longtin J.P., Attinger D., A numerical investigation on the influence of
liquid properties and interfacial heat transfer during microdroplet deposition onto a glass
substrate, International Journal of Heat and Mass Transfer, 50 (2007) 2912-2923.
[25] Bhardwaj R., Attinger D., Non-isothermal wetting during impact of millimeter-size water
drop on a flat substrate: Numerical investigation and comparison with high-speed
visualization experiments, International Journal of Heat and Fluid Flow, 29 (2008)
1422-1435.
[26] Francois M., Shyy W., Computations of drop dynamics with the immersed boundary
method, Part 1: Numerical algorithm and buoyancy-induced effect, Numerical Heat Transfer,
Part B: Fundamentals, 44 (2003) 101-118.
[27] Francois M., Shyy W., Computations of drop dynamics with the immersed boundary
method, Part 2: Drop impact and heat transfer, Numerical Heat Transfer, Part B:
Fundamentals, 44 (2003) 119-143.
[28] Ge Y., Fan L.S., 3-D Direct Numerical Simulation of Gas-Liquid and Gas-Liquid-Solid
Flow Systems Using the Level-Set and Immersed-Boundary Methods, in: Advances in
Chemical Engineering, 2006, pp. 1-63.
[29] Hirt C.W., Nichols B.D., Volume of Fluid (Vof) Method for the Dynamics of Free
Boundaries, Journal of Computational Physics, 39 (1981) 201-225.
[30] Trapaga G., Szekely J., Mathematical modeling of the isothermal impingement of liquid
droplets in spraying processes, Metallurgical transactions. B, Process metallurgy, 22 (1991)
901-914.
[31] Liu H., Lavernia E.J., Rangel R.H., Numerical simulation of substrate impact and
freezing of droplets in plasma spray processes, Journal of Physics D: Applied Physics, 26
(1993) 1900-1908.
[32] Pasandideh-Fard M., Bhola R., Chandra S., Mostaghimi J., Deposition of tin droplets on
a steel plate: simulations and experiments, International Journal of Heat and Mass Transfer,
41 (1998) 2929-2945.
[33] Bussmann M., Mostaghimi J., Chandra S., On a three-dimensional volume tracking
26
[34] Harvie D.J.E., Fletcher D.F., A hydrodynamic and thermodynamic simulation of droplet
impacts on hot surfaces, Part I: theoretical model, International Journal of Heat and Mass
Transfer, 44 (2001) 2633-2642.
[35] Harvie D.J.E., Fletcher D.F., A hydrodynamic and thermodynamic simulation of droplet
impacts on hot surfaces, Part II: validation and applications, International Journal of Heat and
Mass Transfer, 44 (2001) 2643-2659.
[36] Fluid_Research_Company, Manual on the GFS CFD code, in, 2002 ,
www.fluid-research.com.
[37] Nikolopoulos N., Theodorakakos A., Bergeles G., Normal impingement of a droplet onto
a wall film: a numerical investigation, International Journal of Heat and Fluid Flow, 26
(2005) 119-132.
[38] Theodorakakos A., Ous T., Gavaises A., Nouri J.M., Nikolopoulos N., Yanagihara H.,
Dynamics of water droplets detached from porous surfaces of relevance to PEM fuel cells,
Journal of Colloid and Interface Science, 300 (2006) 673-687.
[39] Nikolopoulos N., Theodorakakos A., Bergeles G., Three-dimensional numerical
investigation of a droplet impinging normally onto a wall film, Journal of Computational
Physics, 225 (2007) 322-341.
[40] Nikolopoulos N., Theodorakakos A., Bergeles G., A numerical investigation of the
evaporation process of a liquid droplet impinging onto a hot substrate, International Journal of
Heat and Mass Transfer, 50 (2007) 303-319.
[41] Strotos G., Gavaises M., Theodorakakos A., Bergeles G., Numerical investigation on the
evaporation of droplets depositing on heated surfaces at low Weber numbers, International
Journal of Heat and Mass Transfer, 51 (2008) 1516-1529.
[42] Strotos G., Gavaises M., Theodorakakos A., Bergeles G., Numerical investigation of the
cooling effectiveness of a droplet impinging on a heated surface, International Journal of Heat
and Mass Transfer, 51 (2008) 4728-4742.
[43] Strotos G., Gavaises M., Theodorakakos A., Bergeles G., Evaporation of a suspended
multicomponent droplet under convective conditions, in: ICHMT, Marrakech, Morocco,
27
[44] Strotos G., Gavaises M., Theodorakakos A., Bergeles G., Influence of species
concentration on the evaporation of suspended multicomponent droplets, in: ILASS 2008,
Como Lake, Italy, 2008.
[45] Nikolopoulos N., Nikas K.-S., Bergeles G., A numerical investigation of central binary
collision of droplets, Computers & Fluids, 38 (2009) 1191-1202.
[46] Nikolopoulos N., Theodorakakos A., Bergeles G., Off-centre binary collision of droplets:
A numerical investigation, International Journal of Heat and Mass Transfer, 52 (2009)
4160-4174.
[47] Strotos G., Nikolopoulos N., Nikas K.-S., A parametric numerical study of the head-on
collision behavior of droplets, Atomization and Sprays, 20 (2010) 191-209.
[48] Theodorakakos A., Bergeles G., Simulation of sharp gas-liquid interface using VOF
method and adaptive grid local refinement around the interface, International Journal for
Numerical Methods in Fluids, 45 (2004) 421-439.
[49] Brackbill J.U., Kothe D.B., Zemach C., A continuum method for modeling surface
tension, Journal of Computational Physics, 100 (1992) 335-354.
[50] Carslaw K.S., Jaeger J.C., Conduction of Heat in Solids, Oxford University Press,
London, 1959.
[51] Incropera F.P., de Witt D.P., Fundamentals of Heat and Mass Transfer 3rd ed., Wiley,
New York, 1990.
[52] Seki M., Kawamura H., Sanokawa K., Transient temperature profile of a hot wall due to
an impinging liquid droplet, Journal of Heat Transfer, 100 (1978) 167-169.
[53] Qiao Y.M., Chandra S., Experiments on adding a surfactant to water drops boiling on a
hot surface, Proceedings of the Royal Society of London Series a-Mathematical Physical and
Engineering Sciences, 453 (1997) 673-689.
[54] Pasandideh-Fard M., Qiao Y.M., Chandra S., Mostaghimi J., Capillary effects during
droplet impact on a solid surface, Physics of Fluids, 8 (1996) 650-659.
[55] Roisman I.V., Rioboo R., Tropea C., Normal impact of a liquid drop on a dry surface:
28
[56] Park H., Carr W., Zhu J., Morris J., Single Drop Impaction on a Solid Surface, AIChe J.,
49 (2003) 2461-2471.
[57] Abu-Zaid M., Droplet evaporation on porous and non-porous ceramic solids heated from
top, Heat and Mass Transfer, 38 (2002) 203-211.
[58] Tarozzi L., Muscio A., Tartarini P., Experimental tests of dropwise cooling on
infrared-transparent media, Experimental Thermal and Fluid Science, 31 (2007) 857-865.
9
List of Tables
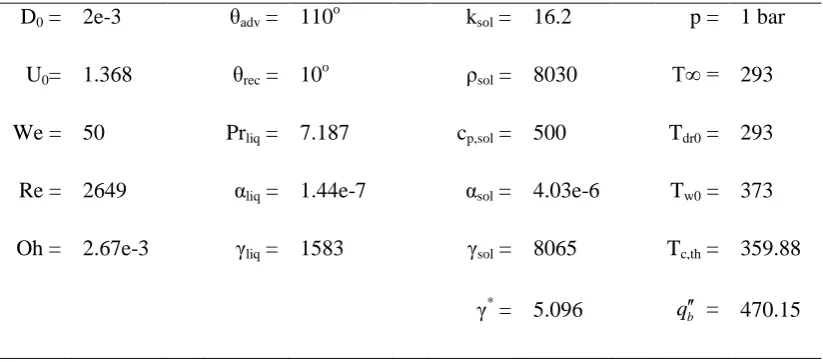
Table 1: Simulation parameters for the reference case (water droplet)
D0 = 2e-3 θadv = 110
o
ksol = 16.2 p = 1 bar
U0= 1.368 θrec = 10
o ρ
sol = 8030 T∞ = 293
We = 50 Prliq = 7.187 cp,sol = 500 Tdr0 = 293
Re = 2649 αliq = 1.44e-7 αsol = 4.03e-6 Tw0 = 373
Oh = 2.67e-3 γliq = 1583 γsol = 8065 Tc,th = 359.88
γ* = 5.096 qb = 470.15
Table 2: Simulation parameters for all cases examined. Blank cells denote that the missing
[image:29.595.93.505.433.614.2]29
case name We Re Oh
(×103) U0
[m/s] D0
[mm]
γsol
[J/m2Ks0.5] γ*
Tw0
[K] Tc,th
[K]
b
q
[W/m2]
ref 50 2649 2.67 1.368 2 8065 5.10 373 359.9 470.2
We=40 40 2369 1.224
We=60 60 2902 1.499
D=1mm 1873 3.77 1.935 1
D=3mm 3244 2.18 1.117 3
T=80oC 353 343.2 327.4
T=120 oC 393 376.6 620.0
0.5γ 4057 2.56 350.6
2.0γ 16130 10.2 365.9
30
Fig. 1: The computational domain together with the boundary conditions used is shown on
the left-hand-side. On the right-hand-side, a detail of the dynamical locally refined grid is
[image:31.595.122.483.72.418.2]31
Fig. 2: Temporal evolution of the droplet spreading in (a) dimensional and (b) and
[image:32.595.91.506.71.278.2]32
Fig. 3: Temporal evolution of the non-dimensional velocity field (left-hand-side of pictures)
33
Fig. 4: Temporal evolution of the cooling of the substrate in (a,b) dimensional units and (c)
34
Fig. 5: Temporal evolution of the temperature of the upper solid surface (z=0) at various
distances from the axis of symmetry for the reference case. The inset figure shows the points
[image:35.595.90.316.68.282.2]35
Fig. 6: Temporal evolution of the cooling of the substrate at symmetry axis (r=0) at three
distances from the upper surface in dimensional units (a, b, c) and non-dimensionalised (d).
[image:36.595.90.498.67.411.2]36
Fig. 7: Temperature distribution at maximum spreading of the solid wall along the symmetry
axis (r=0) for all cases examined (a) in dimensional units and (b) non-dimensionalised. The
37
Fig. 8: (a) Temperature distribution of the solid wall in the radial coordinate in dimensional
units and (b) non-dimensionalized, (c) heat flux distribution of the solid wall in the radial
coordinate in dimensional units and (d) non-dimensionalized. The plots presented refer to the
time of maximum spreading at the upper solid surface (z=0), while the inset figure shows the
38
Fig. 9: Temporal evolution of non-dimensional heat flux field (left-hand-side of pictures) and
39
Fig. 10: Temporal evolution of (a) the mean heat flux absorbed from the droplet in
dimensional units and (b) non-dimensionalised using the transient conduction theory.
Fig. 11: Temporal evolution of (a) the total energy absorbed by the droplet in dimensional
[image:40.595.90.510.70.276.2] [image:40.595.90.507.398.601.2]40
Fig. 12: (a) Normalized cooling effectiveness plotted along with the semi-analytical
expression, (b) temporal evolution of the total energy absorbed by the droplet for selected
cases. In (b) the solid lines correspond to VOF predictions and the symbols to the
corresponding predictions with the semi-analytical expression.
Fig. 13: Temporal evolution of the mean volume-averaged droplet temperature in (a)
[image:41.595.89.512.98.302.2] [image:41.595.88.510.461.667.2]41
Fig. 14: Temporal evolution of (a) term ω/ωmax,th and (b) its integral Ω along with the best fit