City, University of London Institutional Repository
Citation
:
Maras, K. L. and Bowler, D. M. (2011). Brief Report: Schema Consistent Misinformation Effects in Eyewitnesses with Autism Spectrum Disorder. Journal of Autism and Developmental Disorders, 41(6), pp. 815-820. doi: 10.1007/s10803-010-1089-5This is the accepted version of the paper.
This version of the publication may differ from the final published
version.
Permanent repository link:
http://openaccess.city.ac.uk/4727/Link to published version
:
http://dx.doi.org/10.1007/s10803-010-1089-5Copyright and reuse:
City Research Online aims to make research
outputs of City, University of London available to a wider audience.
Copyright and Moral Rights remain with the author(s) and/or copyright
holders. URLs from City Research Online may be freely distributed and
linked to.
City Research Online: http://openaccess.city.ac.uk/ [email protected]
Brief Report: Schema consistent misinformation effects in eyewitnesses with
autism spectrum disorder
Katie Maras
Dermot M Bowler
Autism Research Group
City University London
Abstract
A number of studies have demonstrated schema-related misinformation effects in
typical individuals, but no research to date has examined this with witnesses with
autism spectrum disorder (ASD), despite their impaired ability to generate core
elements that define everyday events. After witnessing slides depicting a bank
robbery, 16 adults with ASD and 16 matched comparison individuals were exposed
to post-event misinformation that was either schema typical or atypical. Consistent
with previous work, the comparison group went on to report more schema typical
misinformation than atypical misinformation. However so too did the ASD group,
suggesting that individuals with ASD do have understanding of the causal links
between events, persons and actions, an important finding from both theoretical and
applied perspectives.
Key Words: Autism Spectrum Disorder, Schema, Typicality, Misinformation,
Eyewitness, Memory
Event schemas are general event representations containing schematically
organised knowledge and sequences of actions within particular spatial-temporal
contexts; useful in organising information in memory and understanding different
events (Schank & Abelson, 1977). However these schemas can have a negative
effect such as when eyewitnesses spontaneously use them to aid their memory for a
previously witnessed event of a particular type, and erroneously recall typical details
even when the details were not actually seen (Holst & Pezdek, 1992).
Schema-related misinformation (e.g. Hekkanen & McEvoy, 2005; Luna & Migueles,
2008; Roediger, Meade & Bergman, 2001) and false memory effects (e.g.
Garcia-Bajos & Migueles, 2003; Holst & Pezdek, 1992; Tuckey & Brewer, 2003a, 2003b)
have been demonstrated in eyewitness paradigms with typical individuals. However
no research to date has examined this with witnesses with high-functioning autism,
despite their well-documented difficulties in event memory and memory organisation.
Individuals with autism spectrum disorder (ASD) have reduced generalisation and
global understanding of the meaning of an event; reduced influence of schematic
expectations on spontaneous attention is evidenced by their slower response in
detecting scene unrelated objects (Loth, Gomez & Happe, 2008). They also show
reduced generalised event knowledge in narratives (Loveland & Tunali, 1993) and
impaired ability to spontaneously generate core elements defining everyday events
including going to a restaurant or the cinema (Volden & Johnson, 1999), however the
ASD participants in that study were able to predict what would happen next in these
The perceptual schema model (Biederman, 1981) and the priming model (Friedman,
1979) both explain the facilitating effect of context in typical individuals by the
priming of the presentation of contextual scenes with stored representations of
schema-consistent information. Previous research using the cognitive interview
(Fisher & Geiselman 1992; Geiselman 1984), which involves the reinstatement of
contextual details experienced at the time of encoding, found that this technique not
only failed to increase the number of correct details reported by individuals with ASD,
but also significantly reduced their accuracy (Maras & Bowler, in press). It is possible
that individuals with ASD qualitatively differ from typical individuals in how they store
representations of an event, which would go some way to explaining the damaging
effect of this interviewing technique on recall accuracy. However, if indiviuals with
ASD rely less on typical schemas to organise event details in memory, they may be
less susceptible to schema-related post-event misinformation than are typical
individuals. We aimed to examine this possibility by introducing schema typical and
atypical post-event misinformation for a previously witnessed bank robbery, an event
for which most individuals are likely to have well-established schemas, before
examining how witnesses with ASD compare to a typical matched comparison group
in subsequently reporting this misinformation erroneously. We predicted that the
ASD group would be less susceptible to accepting typical post event misinformation
than the comparison group, and that whilst the comparison group would make
significantly more schema-typical than atypical intrusions, there would be no such
difference in the number of typical versus atypical intrusions made by the ASD
group. We also examined participants’ free recall for details from the event, and in
predicted that the ASD group would recall significantly fewer correct details than the
comparison group.
Method
Participants
Sixteen individuals with ASD (14 male, 2 female) and 16 typical individuals (12
males, 4 females) took part in this study. Comparison participants were individually
matched to the ASD participants within 7 points of Verbal IQ as measured by the
WAIS-R or WAIS-III UK (Wechsler, 1997), and groups did not differ on Performance
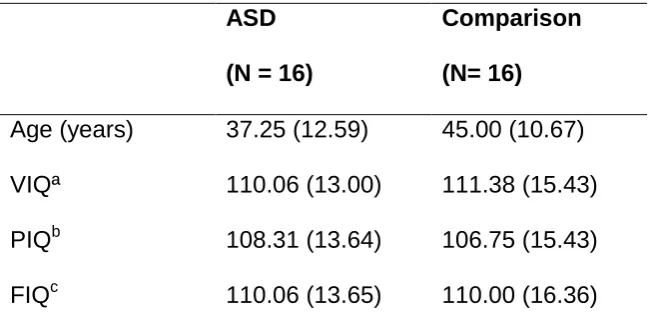
IQ, Full Scale IQ, or age. One-way ANOVAs (Group x Interview) for chronological
age, verbal IQ, performance IQ, and full-scale IQ found no significant main effects or
interactions. Table 1 summarises these data.
Individuals with ASD were diagnosed by clinicians using a range of approaches, and
a review of records and/or assessment with the Autism Diagnostic Observation
Schedule (Lord, Rutter, DiLavore & Risi, 1999) confirmed that all met DSM-IV criteria
for ASD excluding the requirement for absence of clinically significant delay or
abnormality of language development. Clinical diagnoses were checked against the
DSM-IV criteria, and diagnoses were accepted only if explicit information on the
criteria were present in the letter of diagnosis. ASD participants were recruited from
autism support groups and societies, and from word of mouth in the Greater London
and South East of England area. The comparison group was recruited from an
existing database via local newspaper advertisements and none had a history of
neurological or psychiatric illness. All participants were British-born. Participants
INSERT TABLE 1 HERE
Materials
The witnessed event comprised a slide sequence of stills taken from a video of a
staged bank robbery previously used by Tuckey and Brewer (2003b). A total of 27
slides were presented on a 17” monitor at a rate of 4 seconds per slide. They
depicted two robbers wearing balaclavas approaching and entering a bank. One of
the robbers approached the counter and demanded money from a female member of
staff. The robber took the money and approached the door of the bank to leave, and
as it opened looked up at the camera. Both robbers exited the bank and were seen
running away. Misinformation was presented in the form of a mock newspaper
extract (available from the first author on request). The extract contained an account
of the bank robbery together with some related but irrelevant information (the rise in
robberies over the past year in the UK and abroad). The extract also reported ten
incorrect details that were not seen in the slides, five of which were schema typical
(the robbers stuffed the money into a bag; one was carrying a gun; the customer was
forced to the floor; the cashier was forced to put her hands up; one of the robbers
kept watch), the other five were schema atypical (they removed their balaclavas;
they held the door open for a customer before entering the bank; one the robbers
had a can of cola in his hand; the cashier initially laughed at the robbers; one of the
robbers poked his tongue out at the CCTV camera). To disguise this misinformation
manipulation, we also included details that were correctly reported as having been
seen in the slides. Typicality of items was determined by previous normative work
from a small pilot study by the present authors. Items were then rated by a second
independent rater who was blind to the first rater’s coding. The second rater scored
each detail in the final transcription according to whether they were schema typical,
atypical, or schema irrelevant. An inter-rater reliability analysis using the Kappa
statistic was performed to determine consistency among raters. The inter-rater
reliability for the raters was found to be Kappa = 0.74 (p < 0.0001), 95% CI (0.60, 0.87).
Filler tasks comprised of two questionnaires (‘attitudes to crime and punishment’).
The recall questionnaire contained 19 questions, ten of which pertained to the
misinformation details. The other nine questions were filler questions and were used
to again disguise the critical questions. Filler questions only referred to information
seen in the slide sequence (e.g. “what was the name of the bank?”), whereas the
critical misinformation questions referred to details that were only read in the extract
(e.g. “what did the robbers do with the money?” referred to the misinformation
“stuffed the money into a bag”).
Procedure
Participants were tested individually and informed that they would view a series of
still slides taken from a video of a bank robbery before answering some questions
relating to their attitudes toward crime and punishment (to maintain the cover story
for the experiment and persuade participants that we really were interested in their
attitudes to crime and punishment). Following presentation of the slides participants
They were then exposed to misinformation and told they were to read an extract
from a newspaper clipping about the bank robbery they had previously viewed slides
of. Participants were allowed to read through the narrative at their own pace.
Following completion of this and the other filler task (again lasting approx. 20
minutes) participants were given the surprise memory test and asked to write down
in as much detail as they could recall everything they remember from the slides.
Participants were explicitly warned at this point to only report what they had seen in
the slides. Following free-recall participants were presented with the recall questions
and again warned to only answer with information they actually saw in the slides.
After each question participants were asked to indicate how confident they were that
their answer was correct on a 7-point Likert-scale (1 not at all; 7 very confident).
Free recall coding.
Each detail provided by participants in their free recall was coded against the original
transcript for the slides as being correct or incorrect, and whether it was schema
typical, atypical, or irrelevant. Subjective statements of opinion (e.g. “he looked a bit
shifty”) were ignored, and details were only scored the first time that they were
reported. Accuracy scores were also calculated by dividing the number of correct
details reported by the total number of details reported (i.e. correct + incorrect).
Misinformation questions coding.
Answers to each of the five typical and five atypical misinformation-related questions
were scored as intrusions if the critical item of misinformation was incorporated.
Initially, we examined the data for distribution of normality and outliers. Three ASD
participants were identified as outliers due to a high rate of correct details, high rate
of incorrect details, and low accuracy respectively. Analyses were carried out with
and without these participants and findings changed only marginally. For this reason,
in line with the diversity inherent in ASD, they were included in the analyses.
Analyses examined free-recall in relation to correct and incorrect details, and
accuracy scores overall, before examining proportions of the incorrect details given
in terms of whether they were previously read in the extract or new errors, and
whether they were schema typical or atypical. Analyses then examined whether
participants erroneously reported details that were only read in the extract (and not
seen in the slides) in response to specific questions, and whether these differed
depending on whether they were schema typical or atypical. Estimates of effect size,
Cohen’s d, are reported.
Results
Free recall
Accuracy of free recall.
Mean numbers of correct and incorrect details recalled by the two groups and their
accuracy scores are set out in Table 2. Inspection of the means shows that the ASD
group recalled fewer correct details but more incorrect details than the comparison
group, and also had a lower overall accuracy rate. This impression was confirmed by
a one-way ANOVA, which showed that the ASD group were significantly less
correct details, F (1, 30) = 8.02, p < 0.05, Cohen’s d = 1.00, and marginally
significantly more incorrect details, F (1, 30) = 4.02, p = 0.054, Cohen’s d = 0.70 than the comparison group. Thus, the ASD group were significantly worse in terms of both
quantity and quality of recall.
INSERT TABLE 2 HERE
Source of errors
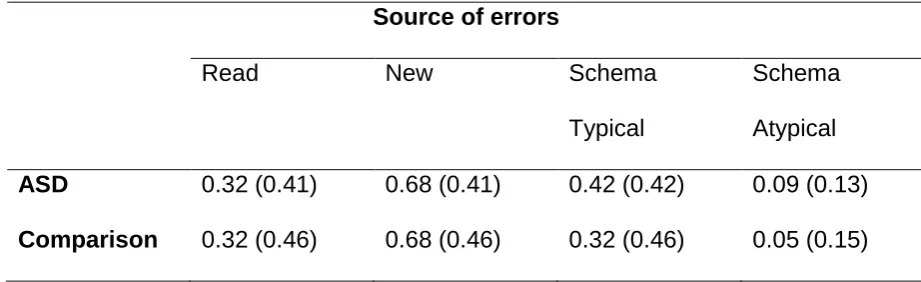
Read vs. New errors.
In order to examine whether, compared to the comparison group, the ASD group
were reporting a higher proportion of inaccurate details that they had read in the
extract, or whether they were erroneously reporting more new errors not previously
read, we conducted a one-way ANOVA with proportions of errors that were for
details previously presented in the extract, and proportions of errors for details that
were new. These proportions were calculated by dividing by the total number of
errors each participant had made. Inspection of the means in Table 3 and
subsequent ANOVA confirmed that the ASD and comparison group did not differ in
the proportion of errors they made for details that they had previously read in the
extract. Nor did they differ for the proportion of their errors that were new details that
were neither seen in the slides nor presented in the extract, all F’s < 1.00, ns.
Typical vs. Atypical correct and incorrect details.
no difference between groups for the proportion of correct details that were typical, F
(1, 30) = 1.08, p = 0.31, Cohen’s d = 0.37, or atypical, F (1, 30) = 0.02, p = 0.90, Cohen’s d = 0.04. There was also no difference between groups for the proportion of
errors that were typical, F (1, 20) = 0.31, p = 0.59, Cohen’s d = 0.23, or atypical, F (1, 20) = 0.60, p = 0.45, Cohen’s d = 0.28. A 2 (group: ASD vs. control) x 2 (schema: typical vs. atypical) mixed ANOVA did however reveal a main effect of schema
typicality, F (1, 20) = 8.87, p < 0.01, Cohen’s d = 0.94. A significantly higher proportion of errors were for details that were schema typical (Mean = 0.37, SD =
0.43) than details that were atypical (Mean = 0.07, SD= 0.14). There was no group x typicality interaction, F (1, 20) = 0.08, p = 0.78, indicating that both groups similarly made more schema typical than atypical errors (due to floor effects, we were unable
to analyse within read only and new errors for typical and atypical details).
INSERT TABLE 3 HERE
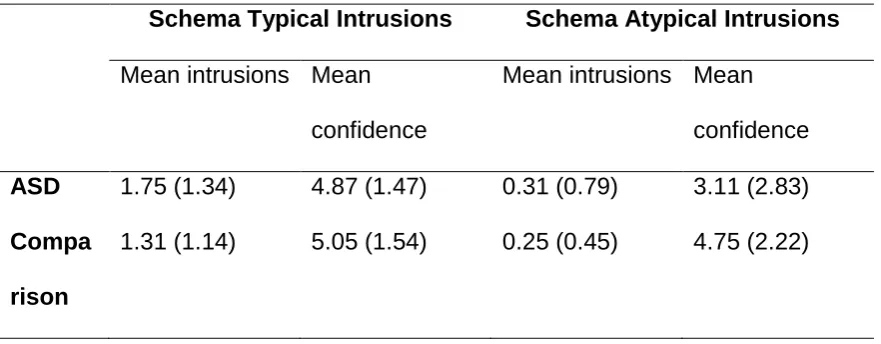
Specific questions
Mean numbers of typical and atypical intrusions made in response to the questions
by the two groups are set out in Table 4. Inspection of the table shows that the ASD
and comparison groups both made more typical than atypical intrusions, but the
groups did not appear to differ from one another on the number of intrusions they
made for each type. This impression was confirmed by a 2 (group: ASD vs.
comparison) x 2 (schema: typical vs. atypical) mixed ANOVA, which revealed a
interaction between typicality of intrusions and group, F (1, 30) = 0.51, p = 0.48; the groups were similar in that they made more schema-typical intrusions than they did
atypical ones. Next we examined whether confidence differed for typical vs. atypical
intrusions, and whether both groups reported these intrusions with similar rates of
confidence in the accuracy of their answers. There was no main effect of confidence
between typical and atypical intrusions, F (1, 4) = 2.37, p = 0.20, Cohen’s d = 0.45, nor was there a significant group x typicality interaction for confidence, F (1, 4) = 1.40, p = 0.30; both groups reported typical and atypical intrusions with similar rates of confidence (see Table 4).
INSERT TABLE 4 HERE
Discussion
Our study examined free-recall and schema-related misinformation effects in
witnesses with ASD. In line with some previous research (e.g., Bennetto, Pennington
& Rogers, 1996; Bowler et al., 2000), but inconsistent with others (e.g. Maras &
Bowler, in press; Renner, Kilner & Klinger, 2000) we found that the ASD group
recalled fewer correct details and were less accurate than their matched comparison
group in their free recall for a previously witnessed event. Coupled with previous
research showing that individuals with ASD can recall as much and as accurately as
typical individuals when support is provided at test (Bowler, Gardiner & Berthollier,
2004), this finding highlights the need for future work to assess effective retrieval
and quality of details that they recall. That the ASD group did not differ from the
comparison group in the types of errors that they made ( typical, atypical, read, or
new) suggests that individuals with ASD equally erroneously report schema typical
details, and are as susceptible to confuse source from a post-event extract as are
typical individuals. Both groups made more schema typical than atypical errors,
suggesting that individuals with ASD do use existing schemas to aid their memory
leading them to erroneously report schema-consistent but inaccurate details.
We also found that both ASD and typical individuals were more likely to go on to
report previously presented misinformation that was schema typical than information
that was atypical, and that both groups did so with similar rates of confidence. This is
at odds with some previous research (e.g. Loveland & Tunali, 1993; Volden &
Johnson, 1999), however other work suggests that higher functioning ASD
individuals do use event schemas and that this is related to factors such as theory of
mind (Loth, Gomez & Happe, 2008). This suggests that individuals with ASD do
have some understanding of the causal relationship between events, persons and
actions, and previous findings of an impairment for these types of details when
interviewed with a cognitive interview (Maras & Bowler, in press) highlights the
necessity for further examination as to why this is.
Our finding of no difference between groups for schema-related intrusions appears
to pose problems for the weak central coherence account (WCC, Frith, 1989) in that
a local processing style might not necessarily mean global processing impairments
and reduced susceptibility to schema-related misinformation effects. However the
ASD have a detail-focussed cognitive style which does not necessarily lead to a
difficulty in ‘seeing the bigger picture’. The present study did not specifically assess
local versus global processing of details per se, and we acknowledge that some of
the details may have reflected more global elements central to the event schema
(e.g. robbers carrying a gun in a bank robbery), whilst others may have reflected
more local elements not central to the story (e.g. the cashier being forced to stick her
hands up) however a full examination of this was beyond the scope of this paper. We
do however acknowledge the limitations of the present study, including the modest
sample size, the fact that the sample was restricted to high-functioning individuals
with ASD, and the close to ceiling effect for accuracy score for the typical group.
Nevertheless the present study is the first of its kind to examine schema-related
misinformation effects in witnesses with ASD. That they are just as susceptible to
these misinformation effects as are typical witnesses is important from both
theoretical, in terms of WCC, and applied perspectives. Findings indicate that
practitioners should be aware that witnesses with ASD are as susceptible to
References
Bennetto, L., Pennington, B. F., & Rogers, S. J. (1996). Intact and impaired memory
functions in autism. Child Development, 67, 1816-1835.
Biederman, I. (1981). Do background depth gradients facilitate object identification?
Perception, 10, 573-578.
Bowler, D. M., Gardiner, J. M., & Berthollier, N. (2004). Source Memory in
Adolescents and Adults with Asperger's Syndrome. Journal of Autism and Developmental Disorders, 34, 533-542.
Bowler, D. M., Gardiner, J. M., Grice, S., & Saavalainen, P. (2000). Memory illusions:
False recall and recognition in adults with Asperger's syndrome. Journal of Abnormal Psychology, 109, 663-672.
Fisher, R. P., & Geiselman, R. E. (1992). Memory-enhancing techniques for investigative interviewing: The cognitive interview. Springfield, IL England: Charles C Thomas.
Friedman, A. (1979). Framing pictures: The role of knowledge in automatized
encoding and memory for gist. Journal of Experimental Psychology: General, 108, 316-355.
Frith, U. (1989). Autism: Explaining the enigma. Oxford: Blackwell.
Garcia-Bajos, E., & Migueles, M. (2003). False memories for script actions in a
mugging account. European Journal of Cognitive Psychology, 15, 195-208. Garcia-Bajos, E., Migueles, M., & Anderson, M. C. (2009). Script knowledge
Geiselman, R. E. (1984). Enhancement of eyewitness memory: An empirical
evaluation of the cognitive interview. Journal of Police Science & Administration, 12, 74-80.
Happe, F., & Frith, U. (2006). The Weak Coherence Account: Detail-focused
Cognitive Style in Autism Spectrum Disorders. Journal of Autism and Developmental Disorders, 36, 5-25.
Hekkanen, S. T., & McEvoy, C. (2005). Source monitoring in eyewitness memory:
Implicit associations, suggestions, and episodic traces. Memory & Cognition, 33, 759-769.
Holst, V. F., & Pezdek, K. (1992). Scripts for typical crimes and their effects on
memory for eyewitness testimony. Applied Cognitive Psychology, 6, 573-587. Lord, C., Rutter, M., DiLavore, P., & Risi, S. (1999). Autism diagnostic observation
schedule—Generic. Los Angeles: Western Psychological Services.
Loth, E., Gomez, J. C., & Happe, F. (2008). Event schemas in autism spectrum
disorders: The role of theory of mind and weak central coherence. Journal of Autism and Developmental Disorders, 38, 449-463.
Loveland, K. A., & Tunali, B. (1993). Narrative language in autism, the theory of mind
hypothesis: a wider perspective. In S. Baron-Cohen, H. Tager-Flusberg, & D.
Cohen (Eds.), Understanding other minds. Perspectives from autism (pp. 247–266). Oxford: Oxford University Press.
Luna, K. & Migueles, M. (2008). Typicality and misinformation: Two sources of
distortion. Psicologica, 29, 171-187.
Maras, K. L. & Bowler, D.M. (in press). The cognitive interview for eyewitnesses with
Renner, P., Klinger, L. G., & Klinger, M. R. (2000). Implicit and explicit memory in
autism: Is autism an amnesic disorder? Journal of Autism and Developmental Disorders, 30, 3-14.
Roediger, H. L., III, Meade, M. L., & Bergman, E. T. (2001). Social contagion of
memory. Psychonomic Bulletin & Review, 8, 365-371.
Schank, R. C., & Abelson, R. P. (1977). Scripts, plans, goals and understanding: An inquiry into human knowledge structures. Oxford England: Lawrence Erlbaum. The Psychological Corporation. (2000).Wechsler Adult Intelligence Scale III UK
edition (WAIS III UK) (3rd ed.). London: The Psychological Corporation. Tuckey, M. R., & Brewer, N. (2003a). How schemas affect eyewitness memory over
repeated retrieval attempts. Applied Cognitive Psychology, 17, 785-800. Tuckey, M. R., & Brewer, N. (2003b). The influence of schemas, stimulus ambiguity,
and interview schedule on eyewitness memory over time. Journal of Experimental Psychology: Applied, 9, 101-118.
Volden, J., & Johnston, J. (1999). Cognitive scripts in autistic children and
adolescents. Journal of Autism and Developmental Disorders, 29, 203-211. Wechsler D. (1981). Wechsler Adult Intelligence Scale Revised (WAISR). New York:
Author Note
Katie Maras and Dermot Bowler, Autism Research Group, Department of Psychology, City University,
Northampton Square, London, UK
The work reported in this paper was undertaken as part of ongoing research in fulfilment of a City
University-funded PhD by the first author.
Thanks to Neil Brewer (Flinders University, South Australia) for kindly lending the slides
Address Correspondence to: Katie Maras, Autism Research Group, Department of Psychology,
Table 1
Age and IQ scores for the ASD and comparison groups (standard deviations in parentheses)
ASD
(N = 16)
Comparison
(N= 16)
Age (years) 37.25 (12.59) 45.00 (10.67)
VIQª 110.06 (13.00) 111.38 (15.43)
PIQb 108.31 (13.64) 106.75 (15.43)
FIQc 110.06 (13.65) 110.00 (16.36)
Table 2.
Mean number of correct and incorrect details, and accuracy scores for free recall by
ASD and comparison groups (standard deviations are in parentheses)
Correcta Incorrectb Accuracya
ASD 19.00
(10.37)
2.56 (2.94) 0.90 (0.10)
Comparison 27.50
(6.04)
1.00 (1.03) 0.97 (0.03)
a
significant between group difference p < 0.005; b
Table 3.
Mean proportion of errors made in free recall for details that had been previously
read in the extract, details that were neither seen in the slides nor read, details that
were typical, and details that were atypical for ASD and comparison groups
(standard deviations are in parentheses)
Source of errors
Read New Schema
Typical
Schema
Atypical
ASD 0.32 (0.41) 0.68 (0.41) 0.42 (0.42) 0.09 (0.13)
Table 4.
Mean numbers of intrusions made by ASD and comparison groups and mean
confidence with which they were made (standard deviations are in parentheses)
Schema Typical Intrusions Schema Atypical Intrusions
Mean intrusions Mean
confidence
Mean intrusions Mean
confidence
ASD 1.75 (1.34) 4.87 (1.47) 0.31 (0.79) 3.11 (2.83)
Compa
rison