1
Optimizing Waste Management Systems Design for Energy Recovery
Athanasios A. Rentizelas 1*, Athanasios I. Tolis 1**, Ilias P. Tatsiopoulos 1***
1 Sector of Industrial Management and Operational Research, School of Mechanical Engineering, National Technical University of Athens,
Iroon Polytechniou 9 str., GR-15780 Zografos, Athens, Greece *
arent@central.ntua.gr ** atol@central.ntua.gr *** itat@central.ntua.gr
Abstract
Municipal Solid Waste (MSW) disposal has been a controversial issue in many countries over the past years. Issues such as the increasing public opposition in creating new landfills, stricter environmental regulations, as well as a change in the European Union directives for MSW management, have complicated further the decision of locating a MSW disposal facility. One of the ways of treating/disposing MSW is energy recovery, as waste is considered to contain a considerable amount of bio-waste, therefore being able to lead to renewable energy production. Especially if co-generation or tri-generation is performed, the overall efficiency can be very high. In this paper, a model is presented, aiming to support decision makers on issues relating to Municipal Solid Waste energy recovery. The idea of using more fuel sources, including MSW and agricultural residue biomass types that may exist in a rural area is explored. The model aims at optimising the system specifications, such as the capacity of the Waste-to-Energy co-generation facility, the capacity of the peak-load biomass boiler and the location of the energy conversion facility. Furthermore, it defines the quantities from each potential fuel source that should be used annually, in order to maximise the financial yields of the investment in the energy conversion facility. The results of a case study application at a rural area of Greece are presented, for energy tri-generation from mixed MSW and biomass fuel. Furthermore, a sensitivity analysis is performed on the effect of the most important parameters of the model on the optimum solution.
Keywords: Optimization, Municipal Solid Waste, Waste Management, Energy Conversion, Tri-generation.
1. Introduction
Management of waste has been an issue causing major social conflicts during the last years. The increase of public opposition to sitting waste management facilities, as well as the adoption of the official EU Waste Framework Directive, have changed significantly the way waste should be managed. Furthermore, the increasingly stricter environmental restrictions have increased multifold the cost of treating waste, and especially Municipal Solid Waste (MSW). Developed countries face mainly the problem of dealing with very large amounts of MSW generated per capita, forcing them to develop new technologies and systems. On the other hand, developing or transitional countries may currently generate lower amounts of MSW per capita, but the rate of increase is high and their current practices of MSW management are not as advanced as those used in developed countries. Therefore, these countries could benefit from adopting MSW management technologies used by developed countries.
The starting point of the present study is a rural area in Greece, where apart for MSW, there exist several types of agricultural residue biomass. Despite the fact that Greece belongs to the developed countries group, its waste management system is almost entirely based on landfilling with low rates of recycling and no energy recovery from waste, thus having different structure from most West-European countries.
The scope of this work is to present a model for optimizing the location of a Waste-to-Energy (WtE) facility in a rural area. The optimization is performed in financial terms, in order for the system developed to present the highest investment yield for the investor, or equally bear the least cost for the stakeholders, who are mainly the citizens of the region examined. The model includes several aspects of a waste management system, such as technical constraints (e.g. minimum heating value of the fuel used in the energy recovery unit), logistical operations, distance from existing inhabited areas etc. Furthermore, more than one fuel sources may be examined, as in rural areas large quantities of seasonal agricultural waste (biomass) exist, which could be used in the same facility, securing its year-round operation and fuel supply, as well as ameliorating the fuel mix characteristics.
2. Literature review
Energy conversion of MSW is included in the waste management system of many countries. For example, the United States had about 872 operational MSW-fired power generation plants in the year 2007 (EPA, 2011), generating approximately 2500 megawatts, whereas in Europe, about 20% of the waste generated in the year 2009 was incinerated in the about 440 waste-to-energy plants (CEWEP, 2011).
Integrating WtE in a waste management system has the great advantage of significantly reducing the amount of waste to be landfilled or disposed of. The output of waste energy conversion is usually less than 10% of the incoming volume. Nonetheless, attention should be given to the management of the ashes produced, as they may contain toxic substances such as heavy metals or dioxins. Some researchers claim that these ashes may be used for several alternative uses, such as in cement or road infrastructure, instead of being landfilled. Another point of criticism in introducing energy conversion of MSW at the early stages of waste incineration technology was the concern over the health effects from dioxin and furan emissions in the flue gases. However, the new technologies adopted and the new stricter emissions regulations in many countries have reduced these emissions to such an extent, that waste-to-energy facilities are no longer considered a significant source of dioxin and furan emissions (Porteous, 2001). Apart from waste incineration, energy conversion may be performed by gasification, which is a more elaborate method for energy conversion of waste. For example, Koukouzas et al. (2008) examined the case of co-gasification of MSW and coal, but reached the conclusion that it is not profitable.
Some authors have performed research in the issue of locating WtE facilities. Perkoulidis et al. (2010) presented a mixed-integer linear programming (MILP) model for the determination of optimum locations of transfer stations for an efficient supply chain between the waste producers and the WtE facility, aiming at minimum cost supply of the facility, focusing though solely on electricity generation.
have also included the biomass-to-energy conversion facility in their models (Tatsiopoulos and Tolis, 2003; Voivontas et al., 2001). Some researchers have developed demand driven biomass-to-energy models, such as the model presented in this work. More specifically, Nilsson (1999) modelled a biomass supply chain of two fuels (straw and reed canary grass) for district heating applications, the bioenergy facility location being defined by the model user and the intermediate storage locations calculated by the simulation model. A similar but single-biomass approach was adopted by Nagel (2000) to cover existing heating demand with district heating network. The problem was formulated as a MILP optimization problem using a dynamic evaluation of economic efficiency, and binary operators to determine whether to construct or not a district heating network, a heating plant or a co-generation plant at pre-defined potential locations. Finally, a combination of GIS, mathematical modelling and optimization for energy supply at a regional level from forest biomass was presented by (Freppaz et al., 2004). The system in question attempts to partially satisfy locally existing heat and electricity needs.
However, few researchers have included simultaneously MSW and biomass as the potential fuel sources, such as in the work of Papadopoulos and Katsigiannis (2002) who have also taken into account the potential need of an extra conventional fuel source to achieve the fuel mix critical heating value. The authors focused mainly on sitting the bioenergy facility to reduce the biomass logistics costs, and more specifically, on eliminating biomass warehousing needs by performing a two-stage optimization: firstly, the CHP power plant location is determined to minimize the transportation distance and secondly, dynamic programming optimization is employed to identify the optimum biomass fuel mix.
As far as emissions reduction eligibility is concerned, the Clean Development Mechanism has already been used for funding projects for improving MSW management in developing countries. According to the work of Unnikrishnan and Singh (2010), it is interesting to note there were already 119 energy recovery projects from MSW examined in the frames of the CDM mechanism, out of which 88 projects involved generation of electricity that is supplied to the grid, which is also the case examined in this work. Similarly, Barton et al (2008) examine the options for funding MSW management projects in developing countries, through the CDM mechanism. Energy exploitation of waste has been also examined in the past, mainly in areas with lack of space for landfills, such as in the work of Kathirvale et al. (2004) for Malaysia.
3. Model
The multi-fuel concept is adapted from the multi-biomass model of Rentizelas et al. (2009) and is expanded to include the changes required to include both MSW and biomass as input fuels. More specifically, it should be noted that the MSW logistics is different than the biomass and is treated in a distinct manner. It is assumed that the WtE facility is responsible only for transporting the MSW from each centrally located municipal waste transfer station to the facility. On the other hand, the facility is responsible for all biomass logistics from collection and loading to transportation. Even more, MSW is an income source for the facility due to the gate fee charged to the municipalities for treatment/disposal, whereas biomass has a purchasing cost. Additionally, biomass may be used to increase the fuel mix heating value when MSW has lower than the critical heating value. In this model, the potential income from emissions reduction achieved is included. Emissions reduction may be credited for substituting conventional fuel generation of electricity, heat and cooling with renewable fuels and are calculated using the relevant approved methodology (UNFCCC-AM0025, 2012). The optimization method applied is a hybrid optimization method presented in Rentizelas et al. (2010).
Sets and Indices Description
i i=1…n Biomass type (including MSW)
t t=1…T Time period
l l=1…L Distance class from power plant
Variables Units Description
Bil tn wet biom. Annual amount of the i
th
biomass type to be procured from distance class l Pmh kW Thermal capacity of the base-load MSW WtE plant
Pp kW Thermal capacity of the peak-load biomass boiler
V0 m
3
Initial annual biomass inventory
Xp & Yp km Longitude & Latitude of bioenergy facility (geographical coordinates)
Parameters Units Description
Cbi €/tn wet Purchasing and loading cost of biomass type i
Cc €/MWh Selling price of cooling
Cch €/kW Chiller specific investment cost CCO2 €/tn CO2eq. Market price of a ton CO2 equivalent
Cd €/m Main district heating pipeline specific investment cost
Cdn € Distribution network & connection cost per district energy customer Ce €/MWhel Selling price of electrical energy
Cetf / Cetv € / €/km Fixed / Variable investment cost of electricity transmission line Ch €/MWh Selling price of heat
Cm €/kWel Specific investment cost of base-load unit
CMSW €/tn wet Gate fee for MSW
Cp €/kW Specific investment cost of peak-load unit Ctdi €/(km*tn) Distance-specific transportation cost of biomass i
Ctti €/(h*tn) Time-specific transportation cost of biomass i
Df - Discounting coefficient
Dl km Biomass transportation trip distance for class l
dm kg/ m3 Mean biomass density Ect MWh Cooling generated in period t
Eet MWhel Net electricity generated in period t
Eht MWh Equivalent heat demand of district energy consumers in period t
Emht MWh Heat generated from the base-load CHP plant in period t
Epht MWh Heat generated from the peak-load biomass boiler in period t
Gnet tn CO2eq. Net greenhouse gas (GHG) emissions reduction (UNFCCC-AM0025,2012)
Table 1. Notations
3.1 Objective Function. The objective function to be maximized is the Net Present Value
(NPV) of the investment for the project’s lifetime. All the elements of the system are included in the investment analysis, i.e. the power plant, the supply chain of MSW and biomass, the district heating and cooling (district energy) network with the connection to the customers, as well as the electricity transmission line and connection to the grid. All operational costs are also taken into account. The NPV function to be maximized is:
Df OMc OMd OMet OMw OMp OMm T Ctt D Ctd B Cb B CchPch CdnNd CdLd Cetf CetvLe CpPp CmPmhPHR Iw Df Gnet Cco Ec Cc Eh Ch Ee ne Ce C B MaxNPV i l l i l i il MSW i l i il t t t t t t MSW i l MSW il
) ( ) 1 ( 2, (1)
where in (1) the first group of terms in brackets refers to the revenue streams of the investment, the second group to the investment costs and the third group to the operational costs. All the annual monetary amounts are multiplied by an appropriate discounting coefficient Df, which turns them into present values, assuming that the annual amounts will follow the inflation rate, which will remain fixed for the investment’s lifetime:
i i Df N ] ) 1 ( ) ( 1 [ 1
. (2)
It should be noted that the objective function calculates the NPV before taxes.
3.2 Optimization Variables. Two of the optimization problem variables are the longitude and
latitude of the facility, which determine the exact location of the energy conversion plant. However, there are several more independent variables that describe the system and are
Iw € Warehousing and related equipment investment cost
Ld / Le m / km Length of main district heating pipeline / of electricity transmission line LHVm KJ/kg Mean lower heating value of biomass & MSW mix
Ls km Safety distance from heat & cooling consumers N years Investment lifetime
Nd - Number of district energy customers ne % Electricity transmission losses
nm / np % Total efficiency factor of base-load WtE unit / peak-load unit OMc/d/et/m/
p/w
€/year Operational &Maintenance cost for (c) Chilling equipment /(d) District heating / (et) Electricity transmission line / (m) Base-load unit / (p) Peak-load unit / (w) Warehousing
Pch kW Chillers installed capacity
PHR - Power-to-Heat ratio
Phdt kW Mean monthly equivalent thermal demand of customers
Pme kWel Electrical capacity of the base-load CHP unit (=Pmh*PHR)
Tl h return trip time for distance class l
Vt m3 Biomass inventory in period t
Xd / Yd km Longitude / Latitude of heat & cooling consumers
determined by the optimization method. The independent variables of the optimization problem are the following:
• Xp & Yp: The optimum location (geographical coordinates) of the facility.
• Pmh: The thermal capacity of the base-load WtE plant. The electrical capacity of the plant (Pme) is assumed to be proportional to the thermal capacity.
• Pp: The thermal capacity of the peak-load biomass boiler.
• Bi: The total amount of the ith biomass type to be procured each year.
• V0: The initial annual biomass inventory. This variable is necessary, as the calculations are based on a rolling horizon framework, similarly to (Cundiff et al., 1997).
3.3. Constraints. Several constraints have been introduced in the mathematical formulation of
the problem. The first one requires that there should be enough biomass from all types except MSW to allow the operation of the biomass boiler, which cannot use MSW as fuel input:
np Eph B
LHV t
t
MSW
i l
il i
. (3)
The second constraint states that the mean lower heating value (LHVm) of the fuel mix should exceed a minimum value for safe operation of the power plant. In the literature it has been proposed that LHVmin should be more than 7 MJ/kg at an annual basis (World bank, 1999):
min
LHV
LHVm . (4)
Another constraint is that the power plant must have enough capacity installed to satisfy the thermal or cooling peak loads of the consumers:
t
Phd Pp
Pmh max . (5)
where max Phdt is defined as the maximum thermal (or cooling) demand of the customers for a predefined confidence level, converted into equivalent heat demand. This constraint ensures that the heat produced each time period by the base-load MSW WtE unit and the peak-load biomass boiler will satisfy the thermal or cooling energy demand of the customers.
Furthermore, there should be a fuel safety stock in the warehouse at any time to meet the energy needs of the customers for a certain timeframe, here assumed equal to seven days (T7) of full-load operation for both base-load and peak-load units:
t T np Pp nm
PHR Pmh
dmLHVm
Vt
(1 ) 7 . (6)
Another constraint is introduced, due to the rolling horizon of the model: The finishing season stock (VT) must be at least as much as the starting season stock (V0):
0
V
VT . (7)
Ls Yd
Yp Xd
Xp )2( )2
( . (7)
The independent variables are required to be non-negative and upper bounds are also defined for many of them. For example, the annual amount of MSW and biomass types is bounded by the maximum available quantity of this type (maxBil) in the distance class l under examination:
l i B
Bil max il ,
0 . (8)
For security of supply reasons, the biomass boiler size has a lower bound equal to the minimum monthly heating and cooling demand of the final consumers, multiplied by a safety factor equal to 1,2. The idea is that the boiler should be able to serve the heat and cooling demand at least for the month with the minimum demand, in order to allow maintenance of the main WtE unit without disrupting the energy supply to the consumers:
t
Phd
Pp120%min . (9)
4. Case study
The case study region examined is a part of the district of Thessaly, close to the city of Larisa in Greece. The region has a significant number of inhabitants, therefore large amounts of MSW and several types of agricultural residue biomass are available, such as wheat straw, maize, cotton stalks and prunings from olive and almond trees. These biomass types have been characterized as dominant in the region, using Pareto analysis, and all of them are considered as potential fuel sources for the power plant. The district energy customer will be the local community of Ampelonas of about 1900 households, identified to roughly match the expected energy generation of the available MSW quantities. The consumers are assumed to be currently using heating oil for space heating and electrical heat pumps for cooling. The facility will operate on heat-match mode. The investor could either be a private entity or a regional authority, and no subsidies of any kind have been included in the case study.
The revenue sources of the WtE facility under consideration are electricity sales to the national grid, heat and cooling supply to the customers via a district heating network as well as emissions reduction trading. The electricity produced will be sold directly to the national grid, at prices fixed by a contract with the Greek energy authority. The price of heat is assumed to be a fixed percentage of the cost of heat obtained by using oil whereas the price of cooling is a fixed percentage of the cost obtained by electrical compression chillers. Some of the most important parameter values used for the case study are presented in Table 2.
Interest rate (%) 8 Investment lifetime (yr) 20
Inflation (%) 3 Electrical efficiency of CHP unit (%) 23 MSW gate fee (€/tn) 50 Total efficiency of CHP unit (%) 85 Electricity selling price (€/MWh) 105,4 Thermal efficiency of biomass boiler (%) 80 Heat selling price (€/MWh) 90,8 COP of absorption chillers 0,7 Cooling selling price (€/MWh) 40 O&M of CHP unit (%inv.cost/yr) 5,5 Oil price (€/kg) 0,95 O&M of biomass boiler (%inv.cost/yr) 3
Table 2. Main case study input data
5. Results
WtE thermal capacity (MWth) 19,091 Biomass boiler thermal capacity (MWth) 16,943
Quantity MSW (tn/yr) 87821
Biomass 1 Wheat straw (tn/yr) 78 Biomass 2 Corn stalks (tn/yr) 0 Biomass 3 Cotton stalks (tn/yr) 5156 Biomass 4 Olive tree prunings (tn/yr) 0 Biomass 5 Almond tree prunings (tn/yr) 1092
Initial biomass inventory (m3) 8176 Facility longitude (km in GR87) 359
[image:8.595.149.451.69.245.2]Facility latitude (km in GR87) 4398
Table 3. Optimum solution
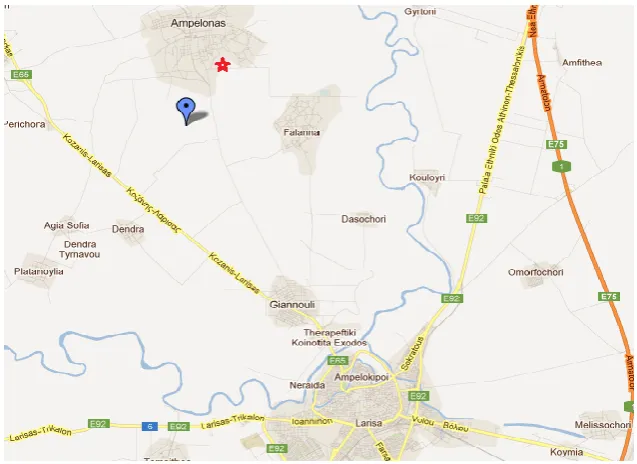
[image:8.595.138.457.370.602.2]From the optimum solution one may see that the WtE facility will have a capacity of about 19MW thermal, or equally 7MW electrical. Furthermore, a 17MW thermal biomass boiler will be required to deal with the thermal peak load. The energy conversion facility will be primarily using MSW as a fuel, utilising annually 87821 tons, which is almost the total of 91000 tons available at the regions included in the study. The rest of the fuel will be biomass comprising of 5156 tons of cotton stalks and 1092 tons of almond tree prunings. The facility location has been determined and is presented in the map of Figure 1 as a blue mark.
Figure 1. WtE facility location (blue mark) and heat demand customers (red star)
It is interesting to note that the WtE facility location is on the lower bound of the proximity constraint of the model (equal to 2 km), obviously in order to reduce the investment cost and the energy losses of the district heating and cooling network.
NPV (Million Euros) 102,603
IRR (%) 22,78
Pay Back Period (years) 5,9
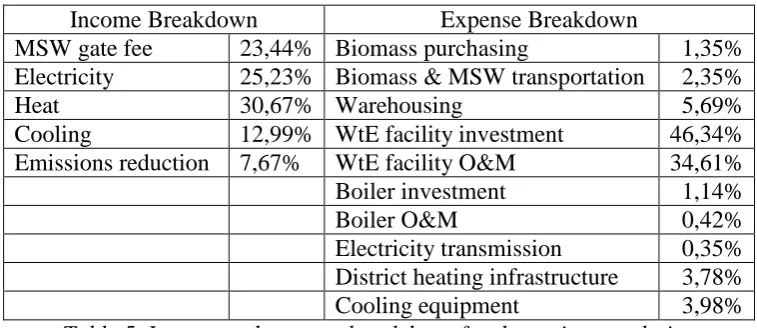
[image:8.595.177.418.695.738.2]The financial criteria of Table 4 suggest that the proposed investment is attractive, with an expected NPV of around 102 million Euros within the 20-year operational period, an Internal Rate of Return (IRR) of 22,78% and Pay Back Period of approximately 6 years. It should be noted here that the objective function optimises based on the investment NPV, which means that solutions with higher value of IRR or lower Pay Back Period could be found, by changing the objective function. It is also interesting to present the income and expense breakdown of the investment, which is performed in Table 5.
Income Breakdown Expense Breakdown
MSW gate fee 23,44% Biomass purchasing 1,35%
Electricity 25,23% Biomass & MSW transportation 2,35%
Heat 30,67% Warehousing 5,69%
Cooling 12,99% WtE facility investment 46,34%
Emissions reduction 7,67% WtE facility O&M 34,61%
Boiler investment 1,14%
Boiler O&M 0,42%
Electricity transmission 0,35% District heating infrastructure 3,78%
[image:9.595.108.487.179.343.2]Cooling equipment 3,98%
Table 5. Income and expense breakdown for the optimum solution
As far as the income sources are concerned, one may see that selling heat is the primary income source of the facility, providing 30% of the total income. This is an immediate effect of the recent high increase of the oil price used for domestic heating in Greece. Electricity and MSW gate fees are almost of equal importance for the facility providing about 25% and 23% of the total income. Cooling sales contributes about 13% of the total income and finally, the income from emission reduction trading could reach 7,7% of the total.
As far as expense streams are concerned, the primary cost factor is the investment as well as operation and maintenance of the WtE facility, adding up to a 81% of the total system costs. This fact was expected, as these facilities have very high investment and operational cost, to comply with the very strict emissions regulations. On the other hand, the biomass peak load boiler, which does not need such elaborate emissions control devices, is a low cost device responsible for 1,5% of the total cost. Infrastructure and equipment required for district heating and cooling contribute another 7,8% of the total cost, whereas the electricity transmission network is accountable for only 0,35%. The biomass supply chain adds 1,35% of the total cost for biomass purchasing, which is very low due to the low quantities of biomass required, as the main fuel source is MSW. Furthermore, another 2,35% is added for biomass and MSW transportation and 5,7% for warehousing, storage and handling.
year, when heat is required, and therefore a high investment such as the MSW WtE unit is not attractive. A low-cost biomass boiler may bring only half the NPV compared to the base case scenario, however it is characterised by a much higher IRR and lower Pay Back Period, due to the very low investment cost required. It should be noted that the facility location is not presented as it remains practically the same.
Base Case No GHG CHP only
WtE thermal capacity (MWth) 19,091 18,329 0
Biomass boiler thermal capacity (MWth) 16,943 17,701 23,891
Quantity MSW (tn/yr) 87821 89599 0
Biomass 1 Wheat straw (tn/yr) 78 0 0
Biomass 2 Corn stalks (tn/yr) 0 0 0
Biomass 3 Cotton stalks (tn/yr) 5156 6101 5417
Biomass 4 Olive tree prunings (tn/yr) 0 0 2702
Biomass 5 Almond tree prunings (tn/yr) 1092 1028 12855 Initial biomass inventory (m3) 8176 50000 9585
NPV (Million Euros) 102,603 84,824 53,188
IRR (%) 22,78 20,57 67,68
[image:10.595.75.521.152.357.2]Pay Back Period (years) 5,9 6,71 1,70
Table 6. Optimum solution
4. Sensitivity analysis
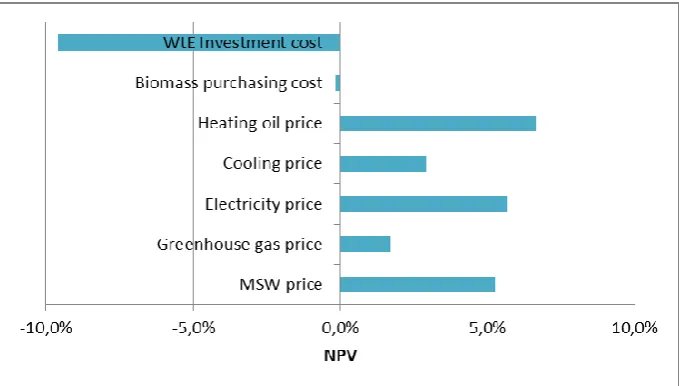
Due to the fact that most parameters included in the model have a degree of uncertainty, a sensitivity analysis of the optimum solution has been performed in relation to the most important financial parameters. A 10% increase of the base-case value of each parameter has been assumed, and the resulting change in the NPV value of the investment is presented in Figure 2.
Figure 2. NPV change for a 10% increase of each parameter’s value
[image:10.595.128.468.473.666.2]purchasing cost has a negligible negative effect on the NPV, as it is only a small fraction of the total fuel used.
As far as the prices of the WtE facility products are concerned, a change in the heating oil price seems to bear the most significant change in the NPV (6,6%). It should be noted that an increase of heating oil price has a dual effect: on the one hand the heat may be sold at a higher price, as it has been assumed that it is always charged at the 80% of the cost of using heating oil, and on the other hand it increases the cost of transporting and handling biomass and MSW, as the related equipment use diesel oil, which follows the fluctuations of heating oil price. It is obvious though that the first effect is dominating the second. Electricity price increase by 10% leads to a 5,6% increase of the NPV value, whereas MSW gate fee follows closely, leading to a 5,2% increase of the NPV. A 10% increase of the cooling price and of the ton CO2 equivalent price lead to 2,9% and 1,7% increase of the NPV respectively. Therefore, the interested investors should pay careful attention to the potential fluctuation of future oil prices, as they have a strong effect on the yield of the investment. Electricity prices are fixed via long-term contracts with the grid operator for renewable source energy generation as in this case, and therefore present no risk for the investment. MSW gate fee has also a significant effect, therefore one should focus on securing its value with long-term contracts, which should probably offer a safety over the potential fluctuations of future oil prices. Finally, the greenhouse gas value has fluctuated tremendously over the past few years, and therefore it is very difficult to predict its future value.
5. Conclusions
This work is concerned with the issue of using MSW as a fuel source for energy conversion. A model is presented that examines the case of using mixed MSW and biomass in the same energy conversion facility, by simulating the processes of MSW and biomass logistics, energy conversion and supply of the energy products to the consumers. The energy products included in the study are electricity, heat and cooling (tri-generation), as this strategy presents advantages for regions with warm climates. The system simulated is optimized in terms of basic design characteristics (location of the facility and capacities of base-load and peak-load units) as well as operational parameters (amounts of each fuel type to use annually). The optimization criterion is the NPV of the investment.
The model has been applied to a case study, which is a rural area in the prefecture of Thesally, Greece. The results show that the investment for a tri-generation facility that will use almost the entire available MSW amount of the municipalities included in the study is financially attractive, even with the modest assumption of a MSW gate fee of 50 €/tn. The most important income source is heat sales, followed by electricity sales and MSW gate fee. It is important to note that the sensitivity analysis has determined heat sales as the major income-related parameter influencing the financial yield of the investment. This fact, combined with the significant fluctuations of oil price lately, indicate that a potential investor should be very careful in estimating both future price of oil as well as quantities of heat sales. On the cost side, the investment cost of the MSW WtE unit seems to be a very influential parameter, which may easily change the financial outlook of the investment, and therefore requires close attention. Furthermore, if only co-generation is considered, the results show that it would be much more efficient in terms of investment yield to construct only a biomass boiler using only biomass and not MSW as fuel sources.
12. References
Brimberg, J., Juel, H., 1998. A bicriteria model for locating a semi-desirable facility in the plane. European Journal of Operational Research, 106 (1), 144-151.
CEWEP - Confederation of European waste-to-energy plants, 2011. Available from: http://www.cewep.eu/index.html, [accessed 14/11/2011].
Cundiff, J.S., Dias, N., Sherali, H.D., 1997. A linear programming approach for designing a herbaceous biomass delivery system. Bioresource Technology, 59 (1), 47-55.
EPA – United States Environmental Protection Agency, 2011. Available from: http://www.epa.gov/cleanenergy/energy-and-you/affect/municipal-sw.html [accessed 12/11/2011]
Freppaz, D., Minciardi, R., Robba, M., Rovatti, M., Sacile, R., Taramasso, A., 2004. Optimizing forest biomass exploitation for energy supply at a regional level. Biomass and
Bioenergy, 26 (1), 15-25.
Kathirvale, S., Yunus, M.M., Sopian, K., Samduddin, A.H., 2003. Energy potential from municipal solid waste in Malaysia. Renewable Energy, 29 (4), 559–567.
Koukouzas, N., Katsiadakis, A., Karlopoulos, E., Kakaras, E., 2008. Co-gasification of solid waste and lignite – A case study for Western Macedonia. Waste Management, 28 (7), 1263-1275.
Luoranen, M., Horttanainen, M., 2007. Feasibility of energy recovery from municipal solid waste in an integrated municipal energy supply and waste management system. Waste
Management Research, 25, 426–439.
Nagel, J., 2000. Determination of an economic energy supply structure based on biomass using a mixed-integer linear optimization model. Ecological Engineering, 16, 91-102. Nilsson, D., 1999. SHAM--a simulation model for designing straw fuel delivery systems. Part
1: model description. Biomass and Bioenergy, 16 (1), 25-38.
Papadopoulos, D.P., Katsigiannis P.A., 2002. Biomass energy surveying and techno-economic assessment of suitable CHP system installations. Biomass and Bioenergy, 22 (2), 105-124.
Perkoulidis, G., Papageorgiou, A., Karagiannidis, A., Kalogirou, S., 2010. Integrated assessment of a new Waste-to-Energy facility in Central Greece in the context of regional perspectives, Waste Management, 30 (7), 1395-1406.
Porteous, A., 2001. Energy from waste incineration — a state of the art emissions review with an emphasis on public acceptability, Applied Energy, 70 (2), 157-67.
Rentizelas, A., Tatsiopoulos, I.P., Tolis, A., 2009. An Optimization Model for Multi-biomass Tri-generation Energy Supply. Biomass and Bioenergy, 33 (2), 223-233.
Rentizelas, A., Tatsiopoulos, I.P., 2010. Locating a bioenergy facility using a hybrid optimization method. International Journal of Production Economics, 123 (1), 196-209. Tatsiopoulos, I.P., Tolis A J., 2003. Economic aspects of the cotton-stalk biomass logistics
and comparison of supply chain methods. Biomass and Bioenergy, 24 (3), 199-214.
UNFCCC-AM0025, 2012. Approved baseline and monitoring methodology AM0025: Avoided emissions from organic waste through alternative waste treatment processes. version 13.0.0, United Nations Framework Convention on Climate Change -CDM Executive Board
Unnikrishnan, S., Singh, A., 2010. Energy recovery in solid waste management through CDM in India and other countries. Resources, Conservation and Recycling, 54 (10), 630-640. Upreti, B.R., 2004. Conflict over biomass energy development in the United Kingdom: Some
observations and lessons from England and Wales. Energy Policy, 32 (6), 785-800.
Voivontas, D., Assimacopoulos, D., Koukios, E.G., 2001. Assessment of biomass potential for power production: A GIS based method. Biomass and Bioenergy, 20 (2), 101-112. World Bank, 1999. Technical guidance report: Municipal Solid Waste Incineration, The