INTRODUCTION
In recent years, more and more research attention has been paid to the NOx emissions caused by marine diesel engines. Selective catalytic reduction system is an after treatment device for reducing NOx emissions from marine diesel engines, which has been proven to be an effective technology for removal of NOx in the marine exhaust emissions.
The urea solution injected into the pipeline decompose to ammonia, which reacts with the nitrogen oxides in the exhaust1
. The distance from nozzle to reactor is usually short by the limi-tation of space in practical application. The uneven distribution of ammonia in reactor caused by high exhaust velocity will lead to low NOx reduction rate and high NH3 slip.
The volume of exhaust and ammonia which generated from urea solution is in a ratio of more than 100 to 1, so it is difficult to mix the two components uniformly in such a ratio. It is hard for ammonia to mix with exhaust by diffusion in the situation of high exhaust velocity. The ammonia injection grids and static mixers are usually used in the pipeline upstream reactor in order to achieve uniform distribution of ammonia.
Investigation on the Effect of Ammonia Distribution on
Selective Catalytic Reduction Conversion Efficiency†
XINNA TIAN1, WENPING ZHANG1, YOUHONG XIAO1,* and PEILIN ZHOU2
1
College of Power and Energy Engineering, Harbin Engineering University, Harbin, Heilongjiang, P.R. China
2Department of Naval Architecture and Marine Engineering, Universities of Glasgow and Strathclyde, Scotland, UK
*Corresponding author: E-mail: [email protected]
AJC-11786
The effect of ammonia distribution upstream selective catalytic reduction converter on selective catalytic reduction conversion efficiency has been studied in this paper. The results indicate that the more uniform ammonia concentration distribution upstream converter is, the higher NOx reduction rate and lower NH3 slip can be achieved. By using static mixers fixed in the pipeline upstream converter, ammonia
and exhaust streams can be mixed effectively on the limitation of mixing distance for marine selective catalytic reduction system. Different kinds of static mixers could lead to different degree of mixing between ammonia and exhaust streams, which will affect selective catalytic reduction conversion efficiency directly. Then comparing with the complete mixing degrees of ammonia and exhaust streams, selective catalytic reduction conversion efficiency can be used as an evaluation index for static mixers. Based on CFD method, the effect of mixing degrees of different static mixers on selective catalytic reduction conversion efficiency can be obtained by simulating current commercial catalysts with several different kinds of static mixers such as GK mixer, SK mixer, contour mixer, star-shaped mixer. The trend of NOx
reduction rate and NH3 slip changing with ammonia distribution and velocity distribution before selective catalytic reduction catalyst
layers can be summarized by analyzing the simulating data. The results can be used to help engineering applications.
Key Words: Ammonia distribution, Selective catalytic reduction.
†Presented at International Conference on Global Trends in Pure and Applied Chemical Sciences, 3-4 March, 2012; Udaipur, India A criterion must be established to judge the quality of mixing since the mixing degrees of ammonia will influence the converter rate of selective catalytic reduction systems. The standard deviation can be used to measure the mixing degrees. Here, the standard deviation is called coefficient of variation, which can be also used to judge the velocity distribution and temperature distribution.
The coefficient of variation can be calculated from the equation:
n ) L L (
L 1 L
1 i
2 x x
x x x x
∑
= − =
σ =
ζ (1)
where, ζx: the coefficient of variation; σx : the standard deviation; Lx: the average value.
Here, n is the total number of sampling points, i are the sequence numbers for each point and x represent the varieties of evaluation, such as component, velocity or temperature.
Several static mixers commonly used such as GK mixer, SK mixer, Contour mixer and Star-shaped mixer combined
with current commercial selective catalytic reduction catalysts have been simulated in this paper for investigating the effect of ammonia distribution upstream reactor on NOx reduction rate and NH3 slip of selective catalytic reduction systems.
EXPERIMENTAL
[image:2.595.46.289.226.292.2]Modeling: The selective catalytic reduction reactor model is based on the DeNOx system for Wärtsilä 9L20C diesel engine. There are three catalysts fixed in the reactor, which has the length of 3500 mm, width of 1180 mm and height of 1170 mm. The mass flow rate of exhaust is 3.43 kg/s and the temperature is 623 K. The model is shown in Fig. 1.
Fig. 1. Model of selective catalytic reduction system
RESULTS AND DISCUSSION
In order to investigate the effect of ammonia distribution upstream reactor on selective catalytic reduction system efficiency, the selective catalytic reduction reactions can be simplified. The reactions between nitrogen oxides and ammonia have been simplified to gas phase reactions which only contain three reactions. The adsorption and desorption of ammonia have been ignored in simulation.
4NH3 + 2NO + 2NO2→ 4N2 + 6H2O Fast (2) 4NH3 + 4NO + O2→ 4N2 + 6H2O Standard (3) 8NH3 + 6NO2→ 7N2 + 12H2O Slow (4) The reaction rates of the reactions shown in eqn. 2 to eqn. 4 are defined in eqn. 5 and are respectively referred as '1…3' in their subscripts.
R1 = k1CNH3CNOCNO2
R2 = k2CNH3CNO (5) R2 = k2CNH3CNO2
where, ki represent the reaction rate constants which are de-fined using the Arrhenius expression as shown in eqn. 6.
ki = Aie-Ei/RT (6)
here, Ai are the pre-exponential factors and Ei are the activa-tion energies of the reacactiva-tions. R is the universal gas constant and T is the averaged catalyst temperature.
Table-1 shows the pre-exponential factors and activation energies of the reactions for Fe-Zeolite catalysts2
[image:2.595.307.549.493.558.2].
TABLE-1
PRE-EXPONENTIAL FACTORS AND ACTIVATION ENERGIES OF THE REACTIONS
A E (kJ/mol)
Fast 4.5e14
m6
/(mol2
-sec) 100
Standard 3.5e5 m3/(mol-sec) 75
Slow 2.8e8
m3
/(mol-sec) 85
Krocher et al.3
and Devadas et al.4
have reported that the reaction rate of the NO2 based selective catalytic reduction reaction shown in eqn. 4 has a reaction rate equivalent to the fast selective catalytic reduction reaction rate and greater than the standard selective catalytic reduction reaction rate at high
temperature. This is a unique feature of Fe-Zeolite catalysts and is not observed on vanadium catalysts.
Ammonia gas is used as reducing agent in the simulation for simpleness. The inlet of reactor is set for mass flow inlet boundary and the outlet of reactor is set for pressure outlet boundary. The turbulent flow is described with k-ε model and the region of catalyst layers is set for porous zone whose porosity is 85 %. The fluid through catalyst channels is consi-dered to lamina flow. The components of reactants are listed in Table-2.
TABLE-2
COMPONENTS OF REACTANTS
NO (ppm) NO2 (ppm) NH3 (ppm)
2104 234 2021
The urea solution is injected by nozzle which usually fixed in the circle center of pipeline for actual application. The high velocity exhaust results in high concentration of ammonia in the middle of reactor and less concentration of ammonia out-side the center, which will lead to low NOx reduction rate and high NH3 slip. In order to simulate this situation, the inlet of reactor is split into two pieces. The center of inlet is the entrance for ammonia, which is made up of ammonia gas and dilution air and the outside of center is the entrance for exhaust. The velocity field at reactor's entrance can be ensured uniform by adjusting the amounts of dilution air for comparing with the uniform mixing situation which has been set for benchmark case.
In order to make the species field and velocity field uniform before catalyst layers, static mixers and guide plates are usually fixed in the pipeline. Therefore, a selective catalytic reduction system with static mixers and guide plates fixed in the pipeline is simulated in this paper.
The guide plates used in simulation are shown in Fig. 2.
Fig. 2. Structure of guide plates
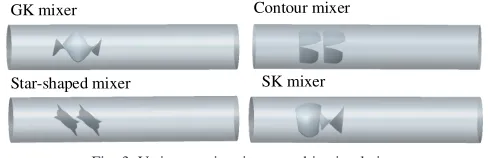
The static mixers are located 0.4 m far away from the entrance and the space for fixing mixers is 0.4 m long. The various static mixers used in simulation are shown in Fig. 3.
GK mixer Contour mixer
[image:2.595.306.550.615.694.2]Star-shaped mixer
SK mixer
Fig. 3. Various static mixers used in simulation
Simulation results
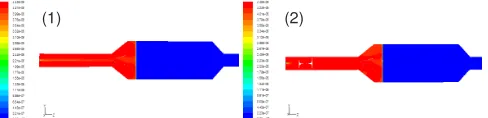
[image:2.595.43.290.623.700.2](1) (2)
Fig. 4. Contours of velocity magnitude (m/s); (1) The velocity field of selective catalytic reduction system without guide plates fixed; (2) The velocity field of selective catalytic reduction system with guide plates fixed
The velocity field is going to be uniform along with the flow direction, which can be seen from the Fig. 4. The velocity at the center of first catalyst layer is high, which leads to a mal-distributed velocity field. However, it can be improved by fixing guide plates and the velocity field at the second catalyst layer is almost uniform after fixing it. In order to compare the two different velocity fields clearly, both of the velocity fields are displayed at a range of 0-15 m/s and the area where velocity is higher than 15m/s will reveal a blank region.
[image:3.595.44.291.316.388.2](1) (2)
Fig. 5. Contours of part velocity magnitude (m/s); (1) The part velocity field of selective catalytic reduction system without guide plates fixed; (2) The part velocity field of selective catalytic reduction system with guide plates fixed
Fixing guide plates results in more uniform velocity field whose velocity within catalyst layers is about 5 m/s and not more than 9 m/s. This range of velocity is of great benefit to the reactions and corresponding to the engineering standard which limits the exhuast velocity at catalyst layers at a range of 5-8 m/s. The NOx reduction rate and NH3 slip are compared between these two selective catalytic reduction systems to investigate the influence of guide plates to the selective catalytic reduction conversion efficiency. The results are listed in Table-3.
TABLE-3
COMPARISON OF EFFICIENCY BETWEEN TWO SELECTIVE CATALYTIC REDUCTION SYSTEMS
NO out (ppm)
NO2
out (ppm)
NH3
out (ppm)
NOx reduction
rate (%) NH3
slip (%) Without guide plates 360 0 34 84.60 1.68 With guide plates 353 0 27 84.90 1.34
The coefficient of variation of exhaust velocity before catalyst layers of two selective catalytic reduction systems is listed in Table-4.
TABLE-4
COEFFICIENT OF VARIATION OF VELOCITY BEFORE CATALYST LAYERS
Coefficient of variation of velocity Without guide plates 1.0456
With guide plates 0.6696
Table-3 shows that the selective catalytic reduction effi-ciency is higher with guide plates fixed in the system because of well velocity distribution within catalyst layers. The higher velocity within catalyst layers is, the shorter residence time of reactions and the lower efficiency of selective catalytic reduction systems. This will happen in the selective catalytic reduction system without guide plates fixed. The simulation results indicate that guide plates will improve the velocity distribution within catalyst layers, which benefits the selective catalytic reduction efficiency, therefore, the selective catalytic reduction system models used in the following simulation are all fixed with guide plates.
Influence of static mixers: In order to make the uniform ammonia distribution, static mixers are fixed in the pipeline upstream reactor in simulation to investigate the effect of static mixers on selective catalytic reduction efficiency. The center of selective catalytic reduction system's entrance is set as ammonia inlet instead of the urea nozzle. The pipeline length upstream reactor is taken for 1 m and 2.2 m respectively for each selective catalytic reduction system. The selective cata-lytic reduction system with GK static mixer fixed is compared to the selective catalytic reduction system without any static mixers fixed, only the simulation results of selective catalytic reduction system with GK static mixer fixed upstream reactor are shown in the following figures for concision. Both of the pipeline upstream reactors are 2.2 m long.
Contours of velocity magnitude (m/s): The static mixers will disturb the fluid flow, but it doesn't have too much effect on catalyst layers (Fig. 6).
[image:3.595.308.551.429.503.2](1) (2)
Fig. 6. Contours of velocity magnitude (m/s); (1) The velocity field of selective catalytic reduction system without static mixers fixed; (2) The velocity field of selective catalytic reduction system with GK mixer fixed
Contours of pressure (pa): The pressure loss caused
by static mixers and bending pipe is higher than other places which can be seen from the contours of pressure. Therefore, the optimization of system can be conducted from these two aspects (Fig. 7).
[image:3.595.307.551.616.680.2](1) (2)
Fig. 7. Contours of pressure (pa); (1) The pressure field of selective catalytic reduction system without static mixers fixed; (2) The pressure field of selective catalytic reduction system with GK mixer fixed
Contours of molar concentration of NH3 (kmol/m3):
0-0.0002 kmol/m3
. The area with ammonia concentration higher than 0.0002 kmol/m3
will reveal a blank region. The ammonia mix with exhaust by diffusion after leaving the entrance, but there is not enough time for diffusion because of high exhaust velocity. Therefore, the ammonia can't fully mix with exhaust upstream the reactor, which leads to high concentration of ammonia within the center of catalyst layers and low concen-tration of ammonia within the peripheral area of catalyst layers. However, this can be improved by fixing static mixers which make the ammonia distribution uniform at catalyst layers (Fig. 8).
[image:4.595.47.290.202.264.2](1) (2)
Fig. 8. Contours of molar concentration of NH3 (kmol/m3); (1) The NH3
concentration field of selective catalytic reduction system without static mixers fixed; (2) The NH3 concentration field of selective
catalytic reduction system with GK mixer fixed
Contours of molar concentration of NO (kmol/m3
):
The ammonia concentrates at the center of catalyst layers in a non-static mixer's selective catalytic reduction system, so the reactions conduct completely at the center of catalyst layers and this is the reason why the concentration of nitrogen oxides within the center of catalyst layers is low in Fig. 9 (1). But this phenomenon is not obvious in Fig. 9 (2) because the ammonia distribute uniformly after fixing a static mixer, so the concen-tration of nitrogen oxides is almost uniform in the radial direction of reactor and decreases gradually in the axial direction with the process of reactions.
(1) (2)
Fig. 9. Contours of molar concentration of NO (kmol/m3
); (1) The NO concentration field of selective catalytic reduction system without static mixers fixed; (2) The NO concentration field of selective catalytic reduction system with GK mixer fixed
Contours of molar concentration of NO2 (kmol/m3):
The concentration of nitrogen dioxides decreases rapidly within the first catalyst layer of reactor whether fixing static mixers or not. The reason is that the concentration of nitrogen dioxides is much lower than nitrogen oxides and it participates in the selective catalytic reduction fast reaction which has much
higher reaction rate than other reactions. So the concentration of nitrogen dioxides plunges as soon as the exhaust contacts with catalyst (Fig. 10).
Contours of molar concentration of H2O (kmol/m3):
The reaction process can be reflected from the distribution of water vapour, which is one of the resultants of selective catalytic reduction reactions. The uniform distribution of water vapour indicates that the reactions conduct fully within the whole reactor. Fig. 11 shows that the reactions taking place within catalysts conduct more uniformly in the presence of static mixers.
(1) (2)
Fig. 10. Contours of molar concentration of NO2 (kmol/m3); (1) The NO2
concentration field of selective catalytic reduction system without static mixers fixed; (2) The NO2 concentration field of selective
catalytic reduction system with GK mixer fixed
[image:4.595.308.552.214.273.2](1) (2)
Fig. 11. Contours of molar concentration of H2O (kmol/m3); (1) The H2O
concentration field of selective catalytic reduction system without static mixers fixed; (2) The H2O concentration field of selective
catalytic reduction system with GK mixer fixed
[image:4.595.309.550.329.391.2]Contrast of the efficiency of selective catalytic reduction systems with different static mixers fixed in the pipeline upstream the reactor has been listed in Table-5.
Table-5 shows that the NOx reduction rate and NH3 slip can be improved by static mixers. The mixing degrees improved by various static mixers are different, which is obvious when the pipeline upstream reactor is short (length for 1 m) and the best choice for mixing is GK static mixer among these mixers. This indicates that the variety of selective catalytic reduction efficiency is caused by different mixing degrees, which also can be seen from Table-6. By comparison with the benchmark case, the selective catalytic reduction efficiency does not reach to the maximum even if the reactor fixed with static mixers, this means that the ammonia is still not completed mixed with exhaust.
[image:4.595.47.288.461.526.2]The selective catalytic reduction efficiency can be further improved by increasing the number of mixing unit or changing
TABLE-5
EFFICIENCY OF SELECTIVE CATALYTIC REDUCTION SYSTEMS WITH DIFFERENT STATIC MIXERS FIXED
1m 2.2m
Pipeline
length NO out (ppm)
NO2 out
(ppm)
NH3 out
(ppm)
NOx reduc-tion rate (%)
NH3
slip (%)
NO out (ppm)
NO2 out
(ppm)
NH3 out
(ppm)
NOx reduction rate (%)
NH3 slip
(%)
No mixer 1002 55 621 54.79 30.73 1004 25 599 55.99 29.64
GK 393 0 71 83.19 3.51 365 0 33 84.39 1.63
Contour 471 0 140 79.85 6.93 367 0 30 84.30 1.48
Xing 445 0 141 80.97 6.98 356 0 32 84.77 1.58
[image:4.595.50.549.667.773.2]the structure of static mixers. But extending the length of pipe-line upstream the reactor is one of the convenient choices with increasing less pressure loss to improve the efficiency in the condition of space permitted. The efficiency of selective cata-lytic reduction system approaches the maximum when the length of pipeline is extended to 2.2 m. It is because that the ammonia has enough residence time to mix with exhaust upstream the reactor. But the variety among the efficiency of selective catalytic reduction systems fixing with different static mixers is not obvious, due to the extended length urges further mixing which makes ammonia uniform before arriving at catalyst layers.
Table-6 lists the coefficient of variation of ammonia before catalyst layers.
TABLE-6
COEFFICIENT OF VARIATION OF AMMONIA BEFORE CATALYST LAYERS
Pipeline length 1 m 2.2 m
No mixer 1.1826 1.1836
GK 0.1784 0.0652
Contour 0.3193 0.0601
Xing 0.2862 0.0715
SK 0.2898 0.0989
The longer the pipeline upstream the reactor is, the smaller the coefficient of variation of ammonia before catalyst layers is. GK static mixer makes the coefficient of variation of ammonia before catalyst layers smallest when the pipeline is 1 m long, which means that GK static mixer is the most effec-tive mixer in this condition. The data listed in Tables 5 and 6 shows that the coefficient of variation of ammonia before catalyst layers should be less than 10 % in order to get a higher NOx reduction rate and lower NH3 slip, which agrees with the engineering experience. Take the efficiency of selective cata-lytic reduction system with SK mixer fixed in the pipeline for example, when the coefficient of variation of ammonia before catalysts drops from 28.98 to 9.89 %, the NOx reduction rate varies from 79.04 to 84.09 % and the NH3 slip varies from
8.86 to 2.03 %. The efficiency of selective catalytic reduction system is indeed improved by enhancing the coefficient of variation of ammonia.
Conclusion
The effect of ammonia distribution and velocity distri-bution within catalyst layers on selective catalytic reduction conversion efficiency has been investigated by CFD method to show the importance of fully mixing between ammonia and exhaust streams. By using static mixers fixed in the pipeline upstream converter, ammonia and exhaust streams can be mixed effectively on the limitation of mixing distance for marine selective catalytic reduction system. Different kinds of static mixers could lead to different degrees of mixing between ammonia and exhaust streams, which will affect selective catalytic reduction conversion efficiency directly. This indicates that selective catalytic reduction conversion efficiency can be used as an evaluation index for static mixers. The data of simulation results shows that the coefficient of variation of ammonia before catalyst layers should be less than 10 % in order to get a higher NOx reduction rate and lower NH3 slip, which agrees with the engineering experience. The even velocity field will benefit the selective catalytic reduction efficiency, so ensuring the velocity distribution uniform is as important as the ammonia distribution. The exhaust velocity within catalyst layers is generally limited at a range of 5-8 m/s.
ACKNOWLEDGEMENTS
This study was supported by China Postdoctoral Science Foundation (Grant No: 2011M500641).
REFERENCES
1. F. Birkhold, U. Meingast, P. Wassermann and O. Deutschmann, Appl. Catal. B, 70, 119 (2007).
2. M. Devarakonda, G. Parker, J.H. Johnson and V. Strots, Int. J. Automot. Technol., 10, 653 (2009).
3. O. Krocher, M. Devadas, M. Elsener, A. Wokaum, N. Soger, M. Pfeifer, Y. Demel and L. Mussmann, Appl. Catal. B, 66, 208 (2006). 4. M. Devadas, O. Krocher, M. Elsener, A. Wokaum, N. Soger, M. Pfeifer,