1
Beyond national economy-wide rebound effects: An
applied general equilibrium analysis incorporating
international spillover effects
PAPER PRESENTED AT THE 37
THIAEE INTERNATIONAL
CONFERENCE
(NEW YORK CITY, JUNE 2014)
Karen Turner, Heriot-Watt University (Scotland)
Simon Koesler, ZEW (Germany)
Kim Swales, University of Strathclyde (Scotland)
Corresponding author:
Karen Turner, Professor of Economics
Director of the Centre for Energy, Resource and Environmental Studies
(CERES)
School of Management and Languages
Heriot-Watt University
Edinburgh, EH14 4AS, Scotland, UK.
Tel: +44(0) 131 451 3978
2
1. Introduction
Existing research on the phenomenon of economy-wide rebound effects from increased energy efficiency have identified the importance of trade effects determining the nature and magnitude of economy-wide rebound effects in national economies where efficiency improvements have occurred (e.g. Hanley et al., 2009; Van den Bergh, 2011). However, the issue of potential spillover effects on energy demand (and supply) from energy efficiency improvements in one region/nation on others have generally been neglected (Madlener and Alcott, 2009; Sorrell, 2009;Turner, 2013; Van den Bergh, 2011). This paper considers how the concept and consideration of economy-wide or 'macro-level' rebound may be extended to consider the impacts of increased energy efficiency in one country on energy use in others. While basic theoretical contributions on the issue of ‘global rebound’ have been made (e.g. Wei, 2010) and some applied studies have been conducted (e.g. Barker et al., 2009), there exist no applied macro-level rebound studies to date that attempt to fully consider and identify the types of channels through which energy efficiency increases in one region/nation may impact energy demand and supply conditions in others. This is an important knowledge gap, particularly given the global nature of energy-related climate change and the context of supra-national policy targets such as the EU 20-20-20 framework. The potential for energy efficiency policy actions taken in one country to impact energy use (and related emissions) in others implies that target setting and implementation decisions in different member states may not be regarded as independent.
Rebound occurs when improvements in energy efficiency stimulate the direct and derived demand for energy in production and/or final consumption. It is triggered by the fact that an increase in the efficiency in the use of energy acts to reduce the implicit price of energy by increasing the effective energy services gained from each physical unit of energy used (Berkhout et al., 2000; Birol and Keppler, 2000; Brookes 1990, 2000; Greening et al., 2000; Herring, 1999; Jevons, 1865; Saunders, 1992, 2000a,b; Schipper and Grubb, 2000; Van den Bergh, 2011; see Dimitropoulos, 2007; Sorrell, 2007 and Turner, 2013 for recent reviews of the literature, with policy reviews by Maxwell et al., 2011; Ryan and Campbell, 2012). Moreover, economic impacts in general and rebound pressure in particular will spread to the wider economy through a series of price and income effects. So called ‘economy-wide rebound’ studies have generally been conducted in the context of improved efficiency in industrial energy use within individual national or regional economies, and most commonly using multi-sector computable general equilibrium, CGE, models (reviewed in Sorrell, 2007, with more recent studies including Anson and Turner, 2009; Turner and Hanley, 2011).
The aim of this paper is to add to this literature by extending the spatial focus of the economy-wide rebound effect. In Section 2 we consider the type of channels through which an efficiency improvement in
productive energy use (i.e. within industries/production sectors rather than the household final consumption sector)1 in one region/nation may spillover to impact energy demand and supply conditions in direct and indirect trade partners. We also derive the analytical specification through which economy-wide rebound may be quantified for different levels of production activity and final consumption in different spatial settings. In Section 3, we provide an overview of an international CGE framework, based on the type of specification commonly used to consider issues of pollution leakage resulting from implementation of environmental policies (e.g. Babiker, 2005; Böhringer and Löschel, 2006; Löschel and Otto, 2009; Elliot et al., 2010). In Section 4, we explain how efficiency improvements in productive energy use are simulated in this framework before presenting results of illustrative case studies for first a general energy efficiency improvement in German production (Section 5), then a shock targeted specifically in German manufacturing (Section 6), and how these shocks transmit to the wider EU and global economies. Conclusions and recommendations for future research are drawn in Section 7.
1 Lecca et al. (2014) show that the economy-wide impacts of increased efficiency in household energy use
3
2. Extending the boundaries of the economy-wide rebound effect
2.1 Potential nature of international trade spillover effects affecting rebound at a supra-national level
Individual regions and nations are linked by goods and factor markets. Consequently, the impacts of economic disturbances and policy interventions in one region/nation may spillover to affect activity in others. The focus of this paper is to consider how analyses of economy-wide rebound effects from increased efficiency in industrial energy use in a given nation may be impacted if the boundaries of ‘the economy’ are extended. We take a first step in doing so by focussing attention on potential spillover effects resulting from trade in goods and services. Three broad channels are identified:
A. General Demand Channels
When technical efficiency increases in productive energy use this equates to a positive supply-side shock in the nation where the improvement takes place. The most basic impact will be a general expansion in activity on both the production and final consumption sides of the domestic economy. Where producers and final consumers use a combination of domestic and imported goods and services, positive income and multiplier effects will stimulate both foreign and domestic production, allowing the benefits of the expansion to spread to the wider global economy. This would underlie concerns that rebound in energy use will grow as the boundaries under consideration expand.
However, the source of this expansion is reduced costs of production and therefore output prices in the domestic sector(s) where the efficiency improvement occurs, and in any downstream sectors (foreign or domestic) that (directly or indirectly) use the outputs of the targeted sector as intermediate inputs to production. Thus, the nature of the demand expansion will not simply depend on the nature of domestic and international supply chain linkages but also on changes in relative prices. Moreover, where there are any constraints in factor supply conditions in different regions, there will be opposing upward pressure on prices, which will in turn put downward pressure on economy-wide rebound. On the other hand, where factor returns increase this equates to additional income effects from increased domestic and/or foreign household consumption demands. Thus, a mix of positive and negative pressures on rebound in global energy use will come into play.
B. Competitiveness Channel
Another important channel for international spillover effects emerges from the discussion above. First, an increase in the input efficiency of a particular sector results in a comparative advantage of this sector relative to its counterparts in other regions, with the benefits spreading to other domestic sectors that use the targeted sector’s outputs as intermediate inputs. Thus, there is pressure for production, particularly in the targeted activity, to increase in the region where the productivity improvements take place. While this is part of the process that causes rebound in local energy demand, any consequent contraction in external production will reduce foreign energy demand and economy-wide rebound viewed from a multiregional perspective. Interestingly, this competitiveness channel could be argued to build on the same mechanism as that in the context of carbon leakage, where production is shifted abroad as a result of higher production costs resulting from environmental policies, but acting in the opposite direction by shifting production to the region where the policy action occurs (see Böhringer et al. 2012).
C. Energy Market Channel
Earlier work reported in Turner (2009, 2013) highlights another ‘negative rebound’ channel that will also apply in the context of international spillover effects from increased efficiency in productive energy use (but would also apply in the case of increased energy efficiency in final consumption activity – see Lecca et al., 2014). This is the impact of changing demands on energy supply sectors. Initially, any increase in energy efficiency leads to a decrease in energy demand. Three basic types of effects may result.
4
(where, for example, increased efficiency in the use of electricity generated from non-renewable sources depresses coal and gas production). However, this will not be limited to domestic energy supply in the nation where the efficiency improvement takes place. Given the high level of integration in international energy markets negative multiplier effects are likely to spillover to external energy supply chain. Whether this has the potential to decrease local or foreign rebound depends thereby crucially of the location of the main energy supply of sector and wider economy where the efficiency improvement takes place. If a large share of the affected energy use is imported, the reduction of energy demand will have a depressing effect on foreign rather than domestic rebound.
Second, the initial decrease in energy demand as efficiency improves will generate downward pressure on domestic and – if energy markets are sufficiently integrated – also external energy prices. Where energy prices are depressed, this will trigger additional energy demand and put upward pressure on rebound in the respective regions. Again, note that this mechanism is very similar to the energy market channel provoking carbon leakage in highly integrated energy markets (see Böhringer et al. 2012), though, again, the shock triggering the drop in local energy demand is different.
Third, Turner (2009) identifies another potential impact on energy supply conditions where prices and/or revenues enjoyed by energy suppliers are negatively affected by a net reduction in energy demand following from an efficiency improvement. This is that where factor returns fall, particularly returns to capital in what tend to be relatively capital-intensive production processes, this will affect the availability of capital to and the incentive to invest in energy supply capacity. If energy supply conditions tighten, and in order to restore equilibrium in capital markets, market prices for energy will have to rise, which will act to offset positive demand pressure driving rebound.
Overall, the nature and importance of impacts on energy supply, demand and rebound through these different channels in different regions will vary depending on the structure of the existing trade linkages in different energy and non-energy goods and services between regions that have and have not directly benefited from increased energy efficiency. In Section 3 we outline an international computable general equilibrium (CGE) modelling framework that is then used (Sections 4-6) to simulate a range of illustrative scenarios that allow us to consider the different channels identified above in an applied setting. First, in order to focus on the specific issue of rebound that is stimulating current academic and policy debate regarding the effectiveness of energy efficiency policies, we consider how the basic specification of economy-wide rebound should be adjusted to consider spillover effects as the boundaries of the economy are expanded from a national to a global level.
2.2 Quantifying rebound in a multi-regional setting
Here we build on the economy-wide rebound specifications derived in Lecca et al. (2014) to consider the general equilibrium rebound effects of a proportionate improvement in the efficiency with which energy is used in a single production sector. Own-sector rebound in the targeted sector i, , (incorporating general equilibrium feedback effects on sector i energy use in addition to direct and indirect rebound effects and reported in percentage terms) is measured as:
[ ̇] (1)
where ̇ is the change in energy use in sector i after all agents have adjusted their behaviour in consequence of the technical energy efficiency improvement , both given in percentage terms. To reiterate, this is not direct rebound; rather it is the change in energy use in sector i with all general equilibrium effects of the efficiency improvement taken into account.
5
[ ̇
] (2)
where is the initial (base/reference year) share of sector i energy use in total energy use in production (across all i=1,…,N sectors) in the domestic economy (which we label d below). The term ̇
can be expressed as: ̇
̇
(3)
where represents absolute change and the op subscript indicates 'other production' (i.e. not including sector i). Substituting equation (3) into equation (2) and using equation (1) gives:
[
] (4)
This shows that the total (own-country) rebound in productive energy use will be greater than the own-sector rebound if there is a net increase in aggregate energy use across all other production sectors. On the other hand, if there is a net decrease in total energy use across all other domestic production sectors, then total rebound in production will be lower than own-sector rebound.
To consider the full economy-wide rebound effect in the domestic economy, d, we must also consider the impact on energy use on the (final) consumption side of the economy, which generally equates to household energy consumption. Thus, the own-country economy-wide rebound formulation, is given as:
[ ̇
] (5)
where is the initial (base/reference year) share of sector i energy use in total energy use (in both production and consumption) in the domestic economy, d. The term ̇
can be expressed as:
̇
̇
(6)
where the c subscript indicates 'consumption' (households). Substituting equation (6) into equation (5) and using equations (1) and (4) gives:
[
] (7)
This shows that the total (own-country) economy-wide rebound in the home country, d, will be larger (smaller) than rebound in the aggregate production sector if there is a net increase (decrease) in energy use in household final consumption.
Here we are also interested in international spillover effects of the energy efficiency improvement on energy use in other countries. Therefore, we define a global rebound rebound effect, , defining the total impact on energy use in all countries resulting from increased efficiency in the use of energy in sector i within the home economy, d:
6
where is the initial (base/reference year) share of sector i (within country d) energy use in total energy use (in both production and consumption in all countries) in the global economy, g. The term ̇
can be expressed as: ̇
̇
(9)
where the og subscript indicates 'other global' (i.e. not including sector i or any other production or consumption activity in country d).
Substituting equation (9) into equation (8) and using equations (1), (4) and (7) gives:
[
] (10)
This shows that the total economy-wide global rebound will be greater than the own-country rebound if there is a net increase in external aggregate energy use following the efficiency improvement within country d. If there is a net decrease then total global rebound will be lower than own-country rebound. Note that it is possible to identify more than one region within the external global economy and break the steps in equations (8)-(10) out accordingly. We do this below in identifying the rest of the EU-27 and the rest of the world.
3. The global CGE modelling framework
To evaluate the economy-wide rebound effect and provide a first analysis of the international spillover effects that come along with an energy efficiency increase, we make use of a static, multi-region, multi-sector CGE model which has been developed along the lines of the Basic WIOD CGE (Koesler and Pothen, 2013). The model distinguishes between two groups of commodities: energy commodities Y(eg,r) and non-energy
commodities Y(neg,r). The production of these goods is characterised by production functions with constant
elasticities of substitution (CES) and constant returns to scale. Nested CES functions with three levels are employed to specify the substitution possibilities between capital K(r), labour L(r), energy inputs A(eg,r) and
non-energy intermediate inputs A(neg,r) of sectors. We apply a KLEM production structure, thus capital and labour enter the production function on the lowest level, on the second level value added is combined with energy and finally on the top level of the CES function the energy-value-added composite is combined with a non-energy material aggregate.2 An overview of the production structure is given in Figure 1. Sectoral output can be used for intermediate use and/or final consumption domestically and/or exported to other regions. Perfect competition is assumed in all markets. Interregional trade is fully flexible and need not be balanced as long as the agent’s overall budget is balanced. The choice among imports and domestically produced commodities is based on Armington’s idea of regional product differentiation (Armington, 1969), i.e. domestic and foreign commodities are distinguished by origin and are not necessarily perfect substitutes.
Each region is represented by one aggregated representative agent who embraces all households and governmental final demand in a region. The representative agent maximizes his utility by purchasing bundles of consumption goods subject to a budget constraint. The budget is determined by factor and tax income along with (intertemporal and interregional) borrowing or saving. In the initial scenarios modelled we assume that agents supply a fix amount of capital and labour. Then, to allow for a stylised analysis of factor constraints, we relax this assumption and implement a simple flexible factor supply within each region. Then labour is supplied on the basis of a simplified consumption-leisure decision where we account for an stylised unemployment rate of unemp(r)=5% which in combination with the benchmark regional labour supply L0(r) gives the maximum
amount of available labour in an economy Lmax(r)=L0(r)/(1-unemp(r)) and assume that the elasticity of
2 We are aware that this is not the only way of structuring the nested KLEM production function, and also that
7
substitution between consumption and leisure is ect(r)=2.0. Moreover, the extended model implements capital
supply functions featuring a stylised price elasticity of eks(r)=0.5. In all cases, capital and labour is mobile across
sectors within regions but not across regions. As in this paper we focus on spillovers from trade in commodities, we abstract from interregional factor mobility and investment. Consumption of representative agents C(r) is
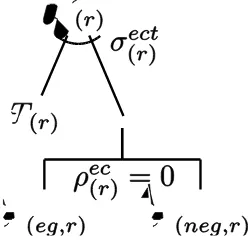
given as a Leontief composite of energy A(eg,r) and a non-energy Armington bundle A(neg,r).3 Utility U(r) is
characterised by a CES function bundling consumption and whenever applicable leisure T(r). The structure of the
[image:7.595.71.226.202.378.2]utility functions is given in Figure 2.
Figure 1: Structure of commodity production
Figure 2: Structure of utility function
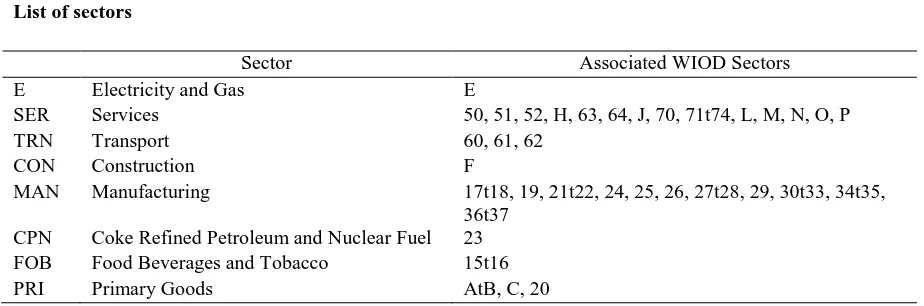
For our analysis, the model has been set to feature 28 regions (all EU27 member states, and Rest of the World (ROW)) and to include eight sectors, two of which are energy supply sectors, (Electricity and Gas (E) and Coke Refined Petroleum and Nuclear Fuel (CPN)), along with six others, (Services (SER), Transport (TRN), Construction (CON), Manufacturing (MAN), Food, Beverages and Tobacco (FOB), and Primary Goods (PRI)). However, in the interest of clarity, we aggregate the results of all EU member states apart of Germany to a new region ‘Rest of EU’ (REU) and limit ourselves to the regions GER, REU and ROW when reporting the
3 We are also aware that modelling consumption on the basis of a Leontief function is not the only possible
[image:7.595.71.195.423.545.2]8
results of the simulations. A detailed overview of the regions and sectors covered in our analysis is given the Appendix (Tables A.1 and A.2).
Regarding the basic economic structure, the model builds on data from the World Input-Output Database (WIOD) (Timmer et al., 2012; Dietzenbacher et al. 2013) and is calibrated to the year 2009.4 The required Armington elasticities are taken from GTAP7 (Badri and Walmsley, 2008; Hertel et al., 2007; Hertel et al., 2008) and are mapped to the sectors we consider prior to the implementation into the model. For substitution elasticities determining the flexibility of production with regard to inputs, we turn to estimates from Koesler and Schymura (2012).5
4. Scenario design for applied general equilibrium analysis 4.1 Simulation strategy
We follow the standard approach adopted in CGE studies of economy-wide rebound by examining the effects of a positive exogenous energy efficiency shock first in all production sectors then limit it to a single production sector.6 This involves applying a single shock in the form a step increase in energy-augmenting technological progress to one or more sectors of a case study economy within a global modelling framework, and contrasting the resulting new equilibrium to the benchmark situation (without efficiency changes). This approach thus implements a ceteris paribus analysis and allows us to attribute all changes to the efficiency shock.
The energy efficiency shock is applied to the second nest of the production function of sectors (Figure 2 above) which has the form:
( ) ( ( ) ( ( ) ) ( )
( ) ( ) ( ( ( )
( ) )) ( )
) ( )
(11)
where, η are input shares, ρ are substitution parameters and γEnergy indicates the level of energy efficiency which is normalised to be one in the benchmark.
In this paper we consider four scenarios. All involve an illustrative exogenous permanent increase in the (technical) energy efficiency of 10%.7 The first scenario is characterised by an improvement in energy efficiency at all eight German production sectors ( ( ) ) in equation (11). In this initial simulation national supplies of capital and labour are fixed to the benchmark level but mobile across sectors. Applying a general efficiency shock to the German economy has significant potential to affect trade between regions. This scenario is therefore well-suited to study the international spillover channels identified in Section 2.1. Because a flexible supply of factors can for itself affect rebound and trade impacts (see, for example, Hanley et al., 2009; Turner and Hanley, 2011), we begin by assuming fixed capital and labour supply. Then in the second simulation we examine the impact of even a partial relaxation of the factor supply constraint in two simple ways. First, we partially relax the labour supply using the simple treatment explained in Section 3, where existing households
4 The WIOD database is available at http://www.wiod.org. We use data downloaded on the 17th of April 2013. 5
Note, Koesler and Schymura (2012) do not provide substitution elasticities between capital and labour for the Electricity and Gas sector (E). We assume that this elasticity is equal to the corresponding elasticity in the manufacturing sector (0.234). They also do not provide an adequate substitution elasticity between value-added and energy for the Coke Refined Petroleum and Nuclear Fuel (CPN) sector, here we assume that this elasticity is equal to the corresponding elasticity for the chemical and chemical products sector (0.717).
6 In future work we aim to consider more sophisticated ways of simulating efficiency improvements (e.g. as
proposed by Fisher-Vanden and Ho, 2010, in modelling a link with R&D activity). Here we confine our attention to a simple exogenous step change, and compare to an unchanging baseline given by the base year dataset, in order to isolate the rebound pressures and spillover channels being studied.
7 On average the energy efficiency of the German industry has increased by about 1.6% per annum (BMWi,
9
respond to changing returns on labour by substituting between labour and leisure. Second, as also noted in Section 3, we permit excess capacity in capital supply that is released in response to increases in the return to (price of) capital. The results of these first two simulations (Scenarios 1 and 2) are discussed in Section 5.
However, in practice efficiency improvements are likely to be targeted at specific rather than all sectors. Moreover, in considering a universal efficiency improvement, important sectoral and inter-sectoral effects, such as changes in relative competitiveness, may be masked. Therefore, in the third and fourth simulations we repeat the process above with the same model assumptions as the first and second simulations (respectively) but limit the implementation of the 10% energy efficiency improvement to the German manufacturing (MAN) sector ( ( ) ). The results of the latter two simulations (Scenarios 3 and 4) are discussed in Section 6.
4.2 The case study of Germany (within the EU and global economies)
Efficiency improvements and the way they diffuse throughout the economy depend crucially on the structure of the economies and in our context in particular their trade structure is of key importance. An overview of some stylised facts about the German economy and the German manufacturing sector are given in in the Appendix (Table A.3). The respective figures relate to our aggregation scheme also illustrated in in the Appendix (Tables A.1 and A.2).
In terms of the sector-specific focus on the simulations reported in Section 6, note that, with a share of 26.73% of total production, MAN is one of Germany’s main sectors. It accounts for 28.58% of energy use in German production and 16.57% of Germany’s total energy consumption (see Table 1 below). Own-sector purchases dominate the intermediate input demand of MAN, with the second most important being SER inputs. However, all inputs may be sourced domestically or imported and non-domestic inputs in German MAN are mainly sourced from the MAN and SER sectors in REU and ROW. In terms of exports, the main customers of German MAN products are the intermediate demand agents MAN and SER in REU and ROW.
In terms of reporting the various general equilibrium rebound effects explained in Section 2.2, the energy use shares reported in Table 1 below inform the corresponding parameters in the denominator of the rebound equations in Section 2.2.
5. Impacts of a 10% increase in energy-augmenting technological progress targeted at all German production sectors (Scenarios 1 and 2)
5.1. Macro-level results (Scenario 1 - fixed regional labour and capital supply)
[image:9.595.107.513.527.632.2]In the first of our four scenarios, we study the effects of simulating a 10% energy efficiency improvement in all German sectors ( ( ) ). We begin with a situation where total labour and capital supply is assumed fixed within all regions/nations but mobile across sectors. Table 2 provides an overview of the main macro-level effects of the efficiency improvement.
Table 1
Energy shares for German rebound calculations Source: Authors’ calculations based on WIOD
(Timmer et al., 2012; Dietzenbacher et al., 2013)
German Manufacturing German Production German Economy Share of Energy Use
in German Production (α) 28.58% 100% n/a Share of Energy Use
in German Economy (β) 16.57% 57.99% 100% Share of Energy Use
in EU (ψ) 3.09% 10.81% 18.65% Share of Energy Use
10
The comprehensive efficiency improvement can be interpreted as a general productivity increase in the German economy, putting downward pressure on output prices and upward pressure on export demand. However, two factors introduc opposing pressures in this scenario. First, constrained factor supply at the national level dampens growth and, as Table 2 shows, increases the price of capital (+0.60%) and labour (+0.72%). This is sufficient to cause a net increase in price in the SER and CON sectors (which are less energy-intensive). Second, the energy efficiency improvement causes a net reduction in demand for energy, and the price of energy falls (-1.23%) along with output in the two domestic energy supply sectors (E and CPN – see Figure 3).
[image:10.595.80.446.93.292.2]As the German non-energy supply sectors generally become more competitive and expand their production (this is most limited in the case of MAN, which is not particularly energy-intensive and thus does not benefit as much in terms of reduced costs of production as efficiency improves), there is a net increase in German GDP of 0.52%. However, this is largely as a result of increased domestic demand: despite an increase in the consumer price index, the higher return on capital and labour facilitates an increase in household
Table 2
Change in key macroeconomic indicators
Scenario 1: 10% increase in energy efficiency in all German sectors fixed national labour and capital supply
Germany REU ROW GDP (Expenditure Approach) 0.5159% -0.0050% -0.0024% Exports -0.0873% -0.0168% -0.0021% Imports -0.1503% -0.0108% -0.0001% Household consumption 0.4948% 0.0005% -0.0003% CPI 0.2079% 0.0048% 0.0000% Price of capital 0.5998% -0.0069% -0.0009% Price of labour 0.7173% 0.0094% 0.0001% Price of energy (aggregate) -1.2698% -0.0082% -0.0006% Household energy use 0.4948% 0.0005% -0.0003% Industrial energy use -5.3403% -0.0600% -0.0036% Total domestic energy use -2.8892% -0.0386% -0.0028%
Figure 3: Changes in sectoral price, output and energy use in Germany (Scenario 1)
-8.00% -7.00% -6.00% -5.00% -4.00% -3.00% -2.00% -1.00% 0.00% 1.00% 2.00%
E SER TRN CON MAN CPN FOB PRI
[image:10.595.77.447.124.294.2] [image:10.595.75.431.450.662.2]11
consumption (+0.49%). While exports rise in the non-energy supply sectors, reduced export demand for the output of the German energy supply sectors causes a net reduction in German exports of -0.09% (though this is offset by a reduction in total import demand of 0.15% as German production generally becomes more competitive so that Germany’s trade surplus increases by 0.89% ). However, this reduction in export demand to the German energy supply sectors is not due to a negative competitiveness effect (the price of output falls in German E and CPN – Figure 3). Rather, this is due to contraction in the global energy supply chain resulting from reduced energy demand in all German production sectors (see discussion of REU and ROW results below). Moreover, taken with the net reduction in total energy use across all production sectors (given the general increase in productive energy efficiency), this is sufficient to elicit the first key result concerning economy-wide rebound as the borders of the economy are expanded. Table 3 shows that the proportionate rebound effect contracts as we move from German to REU to ROW using equations (8) to (10), which are calculated twice, first for REU, then for ROW (with REU treated as domestic, i.e. within the REU economy).
5.2 Energy use (Scenario 1 - fixed regional labour and capital supply)
Let us consider the impacts on energy use in more detail. Table 2 shows that the reduction in productive energy use as a direct result of increased in energy efficiency across all sectors causes a drop in the overall price of energy in Germany (this all spills over to negatively impact output prices in the REU and ROW energy supply sectors – see below). This decrease in the market price of physical energy exacerbates the (direct) positive rebound pressure (from the reduced cost of energy services extracted per physical unit on energy). At the economy-wide level, positive rebound on the production-side of the German economy is triggered by two distinct effects. First, as energy becomes cheaper, firms opt for additional energy inputs and substitute energy for relatively more expensive inputs in particular capital and labour. Second, the general expansion of production and final demand increases the demand for all types of inputs, including energy (the General Demand Channels identified in Section 2.1). However, the strength and impact of these effects varies across sectors based on production technology and the strength of the positive competitiveness effect. The most marked different is observed in the domestic energy supply sectors, E and CPN, where the negative output effect dominates. As a result, the positive rebound pressure in German productive energy use is partly offset by the reduction in energy use in the contracted energy supply sectors (the Energy Market Channel). The net impact is a reduction in total energy use in German production of -5.34%, which generates the general equilibrium ‘own-country production’ rebound effect of 46.6% in Table 3 (calculated from equation (2), where α=1 given that the efficiency improvement affects all German sectors, and our results show that element
in the decomposition
through equations (3) and (4) is negative).
However, while productive energy use falls, Table 2 shows that energy use in the German household sector increases in line with the general expansion of consumption (note that this is proportionate due to the Leontief assumption between consumption of energy and non-energy in the utility function – energy use may be expected to rise more if substitution were possible given the reduced price of energy).8 Thus, total
8 Indeed the summary results of the sensitivity analysis reported in Table A.4 show that the economy-wide
rebound effect grows at all levels as we increase substitutability from zero (in the central Leontief case) up to one (Cobb-Douglas specification). Moreover, the change in moving from the own-country production to total
Table 3
General equilibrium rebound effects
Scenario 1: 10% increase in energy efficiency in all German sectors fixed national labour and capital supply
Own-country production Rp
Own-country total Rd
Global EU Rg World Rg
12
wide general equilibrium rebound effect rises as household energy uses rises (using equations (5) to (7) where element
is positive). This increase is from 46.6% (own-country production) to 50.2% (full own-country
economy-wide rebound) in the central case reported in the second column of Table 3. This equates to a decrease in total German energy use of just -2.89%. The net impact on the aggregate price of energy in German as a result of reduced total demand is the drop of -1.27% reported above.
5.3 International spillover effects (Scenario 1 - fixed regional labour and capital supply)
The economy-wide efficiency shock also has spillover effects in REU and ROW (with results reported at aggregate level in Figures 4 and 5, but with EU members states modelled separately in generating the results). The key result in terms of the general equilibrium calculation of economy-wide rebound is the negative impact through the Energy Market Channel and has already been mentioned in the context of the impact on energy use in domestic German production. This reflects what Turner (2009) refers to as negative multiplier effects in energy supply, and which, triggered by the general increase in German productive energy efficiency, equates to an intermediate demand contraction in both domestic and external energy supply chain activity. Accordingly, Figures 4 and 5 show contractions in output and energy use (despite a small decrease in price) in the REU and ROW energy supply sectors (E and CPN). This exacerbates the negative rebound pressure accompanying the contraction in German energy supply and exports and the economy-wide rebound reported in Table 3 falls from 50.18% to 47.28% in moving from a German to a European level, and reduces further to 46.58% when taking a global perspective of the economy. However, the drop in rebound as we expand the boundaries of the economy from German to EU to world levels is also partly explained by a wider contraction in production activity in the latter two regions resulting from reduced competitiveness relative to the more efficient German sectors, with crowding out worsened by upward pressure on prices due to fixed factor supply. Thus, the Competitiveness Channel also plays an important role here.
In terms of the wider impacts in REU and ROW, Table 2 shows that there is a slight contraction in GDP in both regions, and that this is greater in REU where trade linkages with Germany are stronger. What happens at the sectoral level in REU and ROW depends on the relative importance of positive demand effects as the German economy expands (both production activity and household final consumption) and negative competitiveness effects where German prices fall. Moreover, this is set in the context of fixed labour and capital supplies within each country/region. Table 2 shows that the supply constraint causes a rise in the price of labour due to the demand effect (which is sufficient to facilitate an expansion in household consumption in REU) but the price/return on capital falls due to the negative relative competitiveness effect combined with reduced energy supply activity. While some REU and ROW sectors do receive a net boost, particularly MAN (due to the weakness of the positive competitiveness effect in the German sector, multiplier effects from the overall expansion of German production and the strength of the income effect as German household consumption rises). Overall, however, Table 2 shows that there is a net crowding out of REU and ROW GDP as a result of the general boost to German producers’ energy efficiency in the presence of the supply constraint on labour and capital. This is accompanied by a more than proportionate decrease in productive energy use in both regions due to the negative multiplier effect in the relatively energy-intensive energy supply sectors (though this effect is much more significant in REU, where energy supply linkages with Germany are stronger) are a key element underlying the contracting economy-wide rebound results in Table 3.
13
5.4 Partial relaxation of labour and capital supply constraints (Scenario 2)
In Scenario 2 the simulation above is repeated but with some stylised relaxation of factor supply constraints. While we do not model investment and migration processes as in other economy-wide rebound studies such as Hanley et al. (2009), as explained in Section 3 we do allow the total labour and capital supplies in each nation/region to adjust according to the currently prevailing capital and labour prices (i.e. assuming some excess capacity in capital and labour that may now be accessed).
[image:13.595.108.467.91.302.2]The key differences in results from making this one change are apparent in Table 4. First, there is a markedly larger increase in German GDP as a result of the general energy efficiency improvement in German production (+0.76% relative to +0.52% in Scenario 1 as reported in Table 2 above). There is also a lesser degree of crowding out of activity as reflected by GDP in REU and ROW (though the magnitudes remain small). Thus, positive pressure increases and negative pressures from increased factor supply prices decrease within the General Demand Channels. With only partial relaxation of supply constraints, Table 4 shows that the prices of labour and capital still rise in Germany (but to a lesser extent than under Scenario 1). However, in REU and
Figure 4: Changes in sectoral price, output and energy use in the rest of Europe (Scenario 1)
-0.40% -0.30% -0.20% -0.10% 0.00% 0.10%
E SER TRN CON MAN CPN FOB PRI
Price Output Energy use
Figure 5: Changes in sectoral price, output and energy use in the rest of the World (Scenario 1)
-0.05% -0.04% -0.03% -0.02% -0.01% 0.00% 0.01% 0.02%
E SER TRN CON MAN CPN FOB PRI
14
ROW there are smaller decreases in the price of capital and larger increases in the price of labour. This is due to the fact that, with a stronger German expansion, there is a greater indirect demand shock in REU and ROW, but this still takes place in the presence of some constraints on factor supply. While we do not report the equivalents of Figures 3-5 for Scenario 2 here, we can report that the pattern of sectoral level changes in prices, output and energy use are similar; however, positive competitiveness effects from falling German output prices is larger and this now leads to the net increase in German exports (+0.14%). The Competitiveness Channel still favours Germany but positive income effects mean that the demand boost to REU and ROW is reflected in an increase in total imports (+.0.08%). Thus, in contrast to Scenario 1, the (larger) boost to Germany’s trade surplus (+1.08% relative to +0.89%) reflects an expansion rather than a contraction in international trade activity.
However, while trade increases overall, the key result is still present in that production in and trade between the energy supply sectors (E and CPN) in all regions is reduced as a result of the energy efficiency improvement in German (but to a slightly lesser extent than in Scenario 1). Thus, negative pressure from the Energy Market Channel is still important, just to a lesser degree. At the sectoral level, the pattern of energy use changes are similar but, again, slightly smaller (and the increase in household energy use is larger at +0.74% relative to +0.49% in Scenario 1) so that general equilibrium rebound grows at all levels in Table 5. Moreover, the upward pressure on energy use is exacerbated by a slightly larger drop in the aggregate price of energy.
6. Impacts of a 10% increase in energy-augmenting technological progress targeted at a single German production sector, Manufacturing (Scenarios 3 and 4)
6.1. Economic impacts
[image:14.595.120.484.215.430.2]In this section we consider the impacts of a more focussed energy efficiency improvement, targeted at just one sector of the German economy, MAN. Given the more limited nature of the positive supply-side shock in the German economy, we would expect to observe a smaller expansion in GDP. Tables 6 and 7 (Scenarios 3
Table 4
Change in key macroeconomic indicators
Scenario 2: 10% increase in energy efficiency in all German sectors flexible national labour and capital supply
Germany REU ROW
GDP (Expenditure Approach) 0.7605% -0.0022% -0.0021% Exports 0.1361% -0.0145% -0.0024% Imports 0.0755% -0.0071% 0.0000% Household consumption 0.7427% 0.0046% 0.0003% CPI 0.1717% 0.0037% 0.0000% Price of capital 0.5266% -0.0007% -0.0002% Price of labour 0.6835% 0.0096% 0.0005% Price of energy (aggregate) -1.3110% -0.0064% -0.0004% Household energy use 0.7427% 0.0049% 0.0003% Industrial energy use -5.1201% -0.0574% -0.0039% Total domestic energy use -2.6574% -0.0353% -0.0028%
Table 5
General equilibrium rebound effects
Scenario 2: 10% increase in energy efficiency in all German sectors flexible national labour and capital supply
Own-country production Rp
Own-country total Rd
Global EU Rg World Rg
[image:14.595.113.483.239.424.2]15
and 4 respectively) reflect this, with a +0.13% increase in German GDP where labour and capital supplies are fixed at the national level (Table 6, Scenario 3) growing to +0.22% where a slight relaxation of constraints is possible with supply responding to changing returns (Table 7, Scenario 4).
[image:15.595.77.466.127.332.2]With any extent of supply constraint, there is upward pressure on capital and labour prices. This is shown in Tables 6 and 7 (declining but still present in the latter). This means that the competitiveness of all sectors not directly benefiting from the efficiency enhancement is likely to be negatively affected as they compete for the factors required to facilitate the expansion of the targeted sector (in the case of downstream producers this acts against the positive effects from lower priced intermediate inputs from MAN). This is apparent in Table 8, where the price of output rises in all German sectors except MAN (which itself only enjoys a small reduction in price due to the relatively low energy intensity noted in the discussion of results in Section 5). In general, this causes a reduction in output in all but the targeted MAN and the SER and CON sectors within Germany. Exports rise in MAN and CON, but the latter, along with SER, is also boosted as a result of increased intermediate demand from the targeted MAN sector. SER in particular benefits as the main intermediate supplier to MAN. However, note that the energy intensity of both SER and CON rises as they substitute in favour of energy in response to the larger rise in factor input prices. The German E and CPN sectors, which suffer as result of the contraction in energy demand in MAN activity as efficiency increases are
Table 6
Change in key macroeconomic indicators
Scenario 3: 10% increase in energy efficiency in German manufacturing fixed national labour and capital supply
Germany REU ROW
GDP (Expenditure Approach) 0.1332% -0.0006% 0.0002% Exports 0.0254% -0.0079% -0.0041% Imports 0.0322% -0.0070% -0.0047% Household consumption 0.1453% 0.0003% -0.0004% CPI 0.2309% 0.0034% 0.0000% Price of capital 0.3255% 0.0088% -0.0007% Price of labour 0.3696% 0.0077% 0.0000% Price of energy (aggregate) 0.2440% 0.0078% 0.0001% Household energy use 0.1453% 0.0004% -0.0004% Industrial energy use -1.4965% -0.0067% -0.0031% Total domestic energy use -0.8069% -0.0041% -0.0024%
Table 7
Change in key macroeconomic indicators
Scenario 4: 10% increase in energy efficiency in German manufacturing flexible national labour and capital supply
Germany REU ROW
[image:15.595.78.467.419.574.2]16
further impacted by the rise in domestic capital and labour costs. On the other hand, the smaller increase in REU and ROW factor costs, means that the REU electricity and gas (E) sector at least is able to realise a net benefit as a result of the General Demand Channels (offsetting negative effects through the Energy Market Channel).
Similarly, while the REU and ROW MAN sectors are crowded out as a result of the increased competitiveness of the German sector, other external sectors enjoy net boosts (to varying degrees) as a result of both the indirect demand shock of the boost to German activity and through substitution away from German production in favour of now relatively cheaper imports. Table 8 illustrates that there is upward pressure on REU and ROW prices due to the (smaller) increase in factor prices in these regions also, but the relative price shift favours the external regions. However, given that the German efficiency improvement is targeted in the MAN sector, the corresponding external sectors suffer in the opposite manner (and to a greater extent given the positive boost to German MAN rather than the purely supply constrained negative effect in the other German sectors).
[image:16.595.80.518.178.590.2]In terms of the balance of trade activity, under Scenario 3 (factor supply fixed at national level) total German exports receive a net boost of +0.25%, but this is entirely due to the increase in MAN and CON exports
Table 8
Changes in sectoral price, output and energy use
Scenario 3: 10% increase in energy efficiency in German manufacturing fix national labour and capital supply
Scenario 4: 10% increase in energy efficiency in German manufacturing flexible national labour and capital supply
Scenario 3 Scenario 4
Price Output Energy use Price Output Energy use
GER
E 0.2732% -0.9322% -0.9261% 0.2406% -0.8321% -0.8261% SER 0.3186% 0.0675% 0.0612% 0.2966% 0.1559% 0.1523% TRN 0.2820% -0.2761% -0.1814% 0.2675% -0.1969% -0.1036% CON 0.2368% 0.1145% 0.0690% 0.2236% 0.2042% 0.1592% MAN -0.0833% 0.4328% -4.3559% -0.0945% 0.5145% -4.2723% CPN 0.1741% -0.7427% -0.7105% 0.1616% -0.6582% -0.6266% FOB 0.2479% -0.5512% -0.5910% 0.2374% -0.4675% -0.5060% PRI 0.2628% -0.6743% -0.6907% 0.2582% -0.5965% -0.6123%
REU
E 0.0065% 0.0073% 0.0053% 0.0058% 0.0067% 0.0050% SER 0.0044% 0.0059% 0.0044% 0.0043% 0.0073% 0.0059% TRN 0.0059% 0.0292% 0.0296% 0.0057% 0.0300% 0.0310% CON 0.0026% 0.0032% 0.0018% 0.0025% 0.0050% 0.0036% MAN -0.0003% -0.0719% -0.0780% -0.0010% -0.0723% -0.0780% CPN 0.0057% -0.0172% -0.0247% 0.0054% -0.0121% -0.0185% FOB 0.0059% 0.0872% 0.0842% 0.0055% 0.0895% 0.0863% PRI 0.0062% 0.0403% 0.0395% 0.0059% 0.0462% 0.0461%
ROW
17
given the contraction in all other sectors. On the other hand, imports are driven by both income and substitution effects and rise by more (+0.32%) so that there is a net negative effect on Germany’s trade surplus.
All in all, under Scenario 4 (with some relaxation of factor supply), a similar pattern of results emerges as observed under Scenario 3. However, with a more flexible factor supply, the growth effect is stronger and for example GDP increases by 0.22% in Scenario 4, almost twice the 0.13% rise in Scenario 3. Nonetheless, the stronger overall expansion of German production means that, despite the additional factor supply, only the price of capital decreases. Labour is in Scenario 4 even scarcer than in Scenario 3, indicating that eventually capital will be the limiting factor here.
6.2. Energy use and rebound
In terms of energy use, the expected energy saving (with no rebound) will be smaller in Scenarios 3 and 4 relative to Scenarios 1 and 2 as a result of the more limited energy efficiency improvement. This is why the α parameter is introduced to the calculation of equation (2) and an additional ‘own-sector’ general equilibrium rebound effect is introduced in Table 9. Remember that this is not limited to the direct rebound effect; rather it reflects the total change in MAN energy use taking into account the full expansionary process and how this acts to further boost the sector’s activity level. This is now less energy intensive: Figure 6 shows that output rises but with a reduction in energy use that is less than half the proportionate size the 10% efficiency, reflecting the 54.4% own-sector rebound for Scenario 3, growing to 57.3% in Scenario 4 where the factor supply constraint is partially relaxed.
The changes in total energy use in each region in Tables 6 and 7 follow a similar pattern to that observed for Scenarios 1 and 2 (Tables 2 and 4), though these map to slightly larger proportionate rebound effects in Table 9. Note that this is despite increased prices in the domestic and foreign energy sectors (Table 8), which translates to an increase in the aggregate energy price in Tables 6 and 7. In Scenarios 1 and 2 the aggregate price of energy was reduced in all regions. When the efficiency improvement is limited to German MAN falling energy market prices is lost as a source of upward pressure on rebound but replaced by the greater proportionate increase in activity levels that is possible even in the presence of factor supply constraints and crowding out of German sectors where efficiency doesn’t improve.
[image:17.595.82.520.356.541.2]In terms of the qualitative pattern of increases and decreases in moving from own-country production to total rebound, and then to EU and global levels, while the results in Table 9 (Scenarios 3 and 4) follow the same pattern as what is observed in Tables 3 and 5 (Scenarios 1 and 2), the underlying composition of effects is different. First, given that the energy efficiency improvement in Scenarios 3 and 4 is not targeted at all German production sectors, a new result is introduced in the first column of Table 9. The reduction in the magnitude of the economy-wide rebound effect in moving from the own-sector (MAN) effect to own-country production results in Table 9 is explained by the reduction in activity in most other German production sectors. Part of this
Table 9
General equilibrium rebound effects
Scenario 3: 10% increase in energy efficiency in German manufacturing fix national labour and capital supply
Scenario 4: 10% increase in energy efficiency in German manufacturing flexible national labour and capital supply
Own-sector Ri Own-country
production Rp
Own-country total Rd
Global EU Rg World
Rg
Scenario 3
Rebound [%] 56.44 47.63 51.31 50.22 48.11 Change [percentage points] -8.81 3.68 -1.09 -2.11 Scenario 3
18
is due to crowding out of other non-energy supply sectors (which haven’t received the efficiency boost). However, negative multiplier effects in energy supply triggered by the reduction in MAN demand for energy as its efficiency improves make also an important contribution, just as they did in Scenarios 1 and 2 (where crowding out also occurred, but all sectors benefited from the efficiency improvement).
Second, as in Scenarios 1 and 2, rebound increases when the change (increase) in household energy use is incorporated (using equations (5)-(7)) to move to the total German (own-country) economy-wide rebound. Note that this element increases by proportionately more in Scenarios 3 and 4 relative to Scenarios 1 and 2 respectively. This is because, while the absolute magnitude of the increase in household consumption and energy use is greater in Scenarios 1 and 2, in relative terms (given the smaller shock) households receive a bigger income boost with proportionately larger increases in capital and labour returns in Scenarios 3 and 4. Finally, as we expand the geographical focus first from German to EU level, there is a smaller contraction in the size of the rebound effect relative to Scenarios 1 and 2. This is explained by the greater boost to REU production under Scenarios 3 and 4, where only the targeted German MAN benefits from positive competitiveness effects. Here the negative multiplier effects in energy supply triggered by the energy efficiency improvement are only sufficient to bring about a decrease in the REU CPN (coke, refined petroleum and nuclear fuel) sector. The sector E (electricity and gas sector), on the other hand, receives a net boost as a result of the expansion in German MAN, household and other REU activity. As we further expand the geographical focus from EU to world economy level the impact on the energy supply sectors is negligible. Given the boost to all non-MAN, non-energy supply sectors in REU and ROW, the contraction in economy-wide rebound as we expand spatial focus is almost entirely attributable to the crowding out of the external MAN sectors.
7. Conclusions and directions for future research
This paper extends the analyses of ‘economy-wide’ rebound from the national focus of previous studies and investigates whether international spillover effects from trade in goods and services have the potential to change the overall (global) rebound of local energy efficiency improvements. On that account, we propose a measure of economy-wide rebound that is appropriate for use if the boundaries of ‘the economy’ in question are expanded beyond the borders of the national economy where an efficiency improvement takes place (in one or all sectors). Whether rebound rises or falls as the boundaries are extended depends on whether there is a net increase or decrease in energy use in the area of activity being introduced. While demand-side factors may be expected to cause incremental increases in the size of the proportionate rebound measure as the boundaries are expanded (i.e. considering spatial boundaries in the same additive way as implicitly proposed in the wider literature by, for example, Sorrell, 2009), our findings concur with those of Turner (2009) and Lecca et al. (2014) in demonstrating that there are downward pressures on economy-wide rebound once price and supply considerations are introduced to the analysis. In the course of our analysis, we share Turner’s (2009) focus on increased efficiency in productive energy use through consideration of how positive and negative rebound pressures interact when international spillover effects are taken into account in considering economy-wide rebound at a supra-national level. However, Lecca et al. (2014) demonstrate that similar negative pressures impact the economy-wide response to increased efficiency in household energy use (though the nature of positive rebound pressures is somewhat different).
19
from a relative reduction in foreign competitiveness. On, the other hand, where only one German production sector (manufacturing) benefited from an efficiency improvement, both demand and competitiveness effects/channels were enjoyed by non-competing sectors in the wider EU and global economies. Nonetheless, in one of the two cases simulated here, with only the German manufacturing sector experiencing an efficiency improvement, the positive competitiveness effect in the targeted German sector was strong enough (even given its relatively low energy efficiency) to be the main determinant of the observed contraction in economy-wide rebound in moving first from German to EU-wide then the global level.
Within the third spillover channel identified, the Energy Market Channel, contractions in both domestic and external energy supply chain resulting from the initial demand reduction as efficiency improves dominate and were shown to have the strongest negating impact on rebound (at all spatial levels) the larger the efficiency improvement. That is, where the efficiency improvement is applied to all German sectors and there is the strongest initial contraction in demand. When we limit the efficiency improvement to German manufacturing, which has a relatively low energy-intensity to begin with, positive demand effects in energy supply from boosted activity in household consumption in all regions, and in REU and ROW production sectors, lessens the negating impact of the Energy Market Channel on rebound at all levels.
In terms of how the research presented here should be developed in the future, supply side issues would seem to be the main priority. First, given the importance of what is assumed about factor supply in the simulations reported here, a key area for developing this strand of research will be to introduce more sophisticated treatment of labour and capital markets. For example, permitting factor mobility between regions would permit consideration of additional potential spillover channels. Moreover, introducing treatment of dynamic adjustment of factor supply would allow us to consider the evolution of economy-wide rebound over time. Second, given the importance of energy supply responses in the results reported here, a priority must be to develop a more sophisticated treatment of energy supply. This should include (but not be limited to) consideration of issues such as just how capacity decision are made (which adds emphasis to the need for consideration of dynamic adjustment), the impact of increasing exploitation of renewable energy sources and technologies, and how energy prices are determined in local and international markets. Finally, application of the type of framework developed here (and further developed through the aforementioned future research priorities) wold be invaluable in considering the domestic and international spillover effects of domestic policies to increase efficiency in household energy use, and the implications in terms of interdependence of energy efficiency policy implementation (for example, under EU 20-20-20) in one nation on energy use in others.
References
Anson, S. and Turner K. (2009), Rebound and disinvestment effects in refined oil consumption and supply resulting from an increase in energy efficiency in the Scottish commercial transport sector, Energy Policy
37(9), 3608-3620.
Armington, P.S. (1969), A theory of demand for producers distinguished by place of production, IMF Staff Papers Volume 16, 159-178, Washington, USA.
Babiker, M.H. (2005), Climate change policy, market structure and carbon leakage, Journal of International Economics 65(2), 421-445.
Badri, N. G. and Walmsley, T. L. (2008), Global Trade, Assistance, and Production: The GTAP 7 Data Base, Technical Report, Center for Global Trade Analysis, Purdue University, West Lafayette, USA.
Barker, T., Dagoumas A. and Rubin J. (2009), The macroeconomic rebound effect and the world economy,
Energy Efficiency 2(4), 411-427.
Berkhout, P. H. G., Muskens J. C.and Velthuijsen J. W. (2000), Defining the rebound effect, Energy Policy
28(6-7), 425-432.
Birol, F. and Keppler J. H. (2000), Prices, technology development and the rebound effect, Energy Policy 28 (6-7), 457-479.
BMWi (2013), Energie in Deutschland: Trends und Hintergründe zur Energieversorgung, Technical Report, German Federal Ministry for Economics and Technology (BMWi), Berlin, Germany.
Böhringer, C. and Löschel A. (2006), Computable General Equilibrium Models for Sustainability Impact Assessment: Status Quo and Prospects, Ecological Economics 60(1), 49-64.
20
Brookes, L. (1990), The Greenhouse Effect: The fallacies in the energy efficiency solution, Energy Policy 18(2), 199-201.
Brookes, L. (2000), Energy efficiency fallacies revisited, Energy Policy 28(6-7), 355-366.
Dietzenbacher, E., Los, B., Stehrer, R., Timmer, M. and de Vries, G. (2013), The construction of world input-output tables in the WIOD project, Economic Systems Research 25(1), 71-98.
Dimitropoulos J. (2007), Energy productivity improvements and the rebound effect: An overview of the state of knowledge, Energy Policy 35(12), 6354-6363.
Elliot, J., Kortum, S., Munson, T., Pérez, F. and Weisbach, D. (2010), Trade and carbon taxes, American Economic Review: Papers and Proceedings 100(2), 465-469.
Fisher-Vanden, K. and M.S. Ho (2010), Technology, development and the environment, Journal of Environmental Economics and Management 59, 94-108.
Greening, L.A., Greene D.L. and Difiglio C. (2000), Energy efficiency and consumption - the rebound effect - a survey, Energy Policy 28(6-7), 389-401.
Hanley, N.D., McGregor P.G., Swales J.K. and Turner K. (2009), Do increases in energy efficiency improve environmental quality and sustainability? Ecological Economics 68(3), 692-709.
Herrendorf, B., Rogerson R., and Valentiny Á. (2013), Two perspectives on preferences and structural transformation, American Economic Review 103(7), 2752-2789.
Herring, H. (1999), Does energy efficiency save energy? The debate and its consequences, Applied Energy
63(3), 209-226.
Hertel, T., R. McDougall, B. Narayanan and A. Aguiar (2008), GTAP 7 Data Base Documentation - Chapter 14: Behavioral Parameters, GTAP 7 Data Base Documentation, Center for Global Trade Analysis, West Lafayette, USA.
Hertel, T.H., D. Hummels, M. Ivanic, and R. Keeney (2007), How confident can we be in CGE-based assessments of free trade agreements?, Economic Modelling 24(4), 611-635.
Jevons, W.S. (1865), The coal question: Can Britain survive?, First published in 1865, re-published 1906 by Macmillan, London, United Kingdom.
Koesler, S. and Pothen F. (2013), The Basic WIOD CGE Model: A Computable General Equilibrium Model Based on the World Input-Output Database, ZEW Documentation No. 13-04, Mannheim, Germany. Koesler, S. and Schymura M. (2012), Substitution elasticities in a CES production framework: An empirical
analysis on the basis of non-linear least squares estimations, ZEW Discussion Paper No. 12-007, Mannheim, Germany.
Lecca, P., Swales J.K. and Turner K. (2011), An investigation of issues relating to where energy should enter the production function, Economic Modelling 28(6), 2832-2841.
Lecca, P., McGregor, P.G., Swales, J.K. and Turner K. (2014), The added value from a general equilibrium analysis of increased efficiency in household energy use, forthcoming in Ecological Economics.
Löschel, A. and Otto V. M. (2009), Technological Uncertainty and Cost-Effectiveness of CO2 Emission
Reduction, Energy Economics 31(1), 4-17.
Madlener, R. and B. Alcott (2009), Energy rebound and economic growth: A review of the main issues and research needs, Energy 34(3), 370-376.
Maxwell, D., P. Owen, L. McAndrew, K. Muehmel and A. Neubauer (2011). Addressing the Rebound Effect.
Report by Global View Sustainability Services. Download at
http://ec.europa.eu/environment/eussd/pdf/rebound_effect_report.pdf
Ryan, L. and Campbell, N. (2012), Spreading the net: The multiple benefits of energy efficiency improvements, OECD/IEA International Energy Agency Insights Series 2012, Paris, France.
Saunders, H. D. (1992), The Khazzoom-Brookes postulate and neoclassical growth, The Energy Journal 13(4), 131-148.
Saunders, H. D. (2000a), A view from the macro side: Rebound, backfire and Khazzoom-Brookes, Energy Policy 28(6-7), 439-449.
Saunders, H. D. (2000b), Does predicted rebound depend upon distinguishing between energy and energy services?, Energy Policy 28(6-7), 497-500.
Schipper, L. and Grubb, M. ( 2000), On the rebound? Feedback between energy intensities and energy uses in IEA countries, Energy Policy 28(6-7), 367-388.
Sorrell, S. (2007), The Rebound Effect: An assessment of the evidence for economy-wide energy savings from improved energy efficiency, Technical Report, UK Energy Research Centre, London, United Kingdom. Sorrell, S. (2009), ‘Jevons Paradox’ revisited: The evidence for backfire from improved energy efficiency.
Energy Policy 37(4), 1456-1469.
21
Turner, K. (2013), Rebound effects from increased energy efficiency: a time to pause and reflect?, The Energy Journal 34(4), 25-42.
Turner, K. and Hanley N. (2011), Energy efficiency, rebound effects and the Environmental Kuznets Curve,
Energy Economics 33(5) 722-741.
Turner, K., (2009), Negative rebound and disinvestment effects in response to an improvement in energy efficiency in the UK economy, Energy Economics 31(5), 648-666.
Van den Bergh, J. (2011), Energy conservation more effective with rebound policy, Environmental and Resource Economics 48(1), 43-58.
Wei, T. (2010), A general equilibrium view of global rebound effects, Energy Economics 32(3), 661-672.
[image:21.595.74.425.256.687.2]APPENDICES
Table A.1 List of regions
Region Associated WIOD Regions AUT Austria AUT
BEL Belgium BEL BGR Bulgaria BGR CYP Cypress CYP CZE Czech Republic CZE DNK Denmark DNK ESP Spain ESP EST Estonia EST FIN Finland FIN FRA France FRA GBR Great Britain GBR GER Germany DEU GRC Greece GRC HUN Hungary HUN IRL Ireland IRL ITA Italia ITA LTU Lithuania LTU LUX Luxembourg LUX LVA Latvia LVA MLT Malta MLT NLD The Netherlands NLD POL Poland POL PRT Portugal PRT ROM Romania ROM SVK Slovakia SVK SVN Slovenia SVN SWE Sweden SWE