The Use of Non-intrusive User Logging to Capture Engineering Rationale, Knowledge and Intent during the Product Life Cycle
James M Ritchie1, Raymond CW Sung1, Heather Rea1, Theodore Lim1, Jonathan R Corney2, Iris Howley3 1 Scottish Manufacturing Institute, Heriot-Watt University, Edinburgh, UK
2University of Strathclyde, Glasgow, UK 3Drexel University, Philidelphia, USA
Abstract
Within the context of Life Cycle Engineering it is important that structured engineering information and knowledge are captured at all phases of the product life cycle for future reference. This is especially the case for long life cycle projects which see a large number of engineering decisions made at the early to mid-stages of a product’s life cycle that are needed to inform engineering decisions later on in the process. A key aspect of technology management will be the capturing of knowledge throughout the product life cycle. Numerous attempts have been made to apply knowledge capture techniques to formalise engineering decision rationale and processes; however, these tend to be associated with substantial overheads on the engineer and the company through cognitive process interruptions and additional costs/time. Indeed, when life cycle deadlines come closer these capturing techniques are abandoned due the need to produce a final solution. This paper describes work carried out for non-intrusively capturing and formalising product life cycle knowledge by demonstrating the automated capture of engineering processes/rationale using user logging via an immersive virtual reality system for cable harness design and assembly planning. Associated post-experimental analyses are described which demonstrate the formalisation of structured design processes and decision representations in the form of IDEF diagrams and structured engineering change information. Potential future research directions involving more thorough logging of users are also outlined.
Introduction
Virtual reality (VR) is a technology which will become cost effective in term of its application to the product life cycle over the next decade. Although the most recently researched applications have been used by large companies for visualisation or in research laboratories for technological evaluations, prices are beginning to reduce and technology platforms are being developed on cost-effective PC-based technologies. This, along with cheaper interactive devices and 3D displays will eventually lead to an adoption of these systems as a means to generating engineering information throughout the product development process.
Many applications of VR are now being used within the engineering of products using a wide range of technologies [1]. In product design, VR systems can change the way in which engineers conceptualise and embody designs while developing new product ideas [1] [2] as well as generating downstream manufacturing information [3].
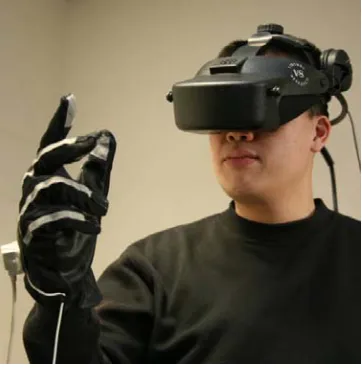
[image:1.595.208.389.532.716.2]In relation to VR, this paper focuses on the head mounted display (HMD), as shown in Fig. 1, where the user is surrounded by a virtual world generated by computer graphics; the models within this can be interacted with in real time.
This environment immerses the designer totally within the 3D interactive world whereby they can be monitored and logged to a degree not possible using flat screen, 2D computer aided design (CAD) interfaces. All of the user’s actions, movements, menu choices, product geometries, data modifications and interface device interactions can be recorded and time stamped in the form of a chronological log file; the availability of log file analysis in this way presents many opportunities for the generation of usable design and manufacturing information [4].
The potential of VR in design was demonstrated by COVIRDS (COnceptual VIRtual Design System) which showed the interactive capabilities of immersive virtual design [7]. Varga et al [8] investigated the use of hand motion as a means of creating conceptualised geometry for design purposes and suggest a novel classification scheme for categorising these motions and demonstrating a 3D digital tools interface for conceptual geometry creation. Research by Ritchie et al [9] has investigated the use of data in log files to automate the process of generating assembly plans and elicit simple knowledge. This has been carried forwards into a design domain, detailing user activities [10] [11].
However, this paper is concerned with extending previous work on generating product engineering data into the domain of capturing design and manufacturing process maps and associated knowledge/rationale. This would enable the management of such knowledge to be enhanced through reducing the cost and time overhead traditionally associated with companies requiring the acquisition of such data. As well as this, it offers the opportunity to embed this knowledge into some form of knowledge store, e.g. a product life cycle management (PLM) system or design rationale log. However, considering an engineer’s thinking in such an environment highlights the importance of cognitive issues associated creative processes such as design. Although it is generally assumed that most of the creative activity during a design process, such as those defined in Cross [5], takes place during conceptualisation and embodiment it is still the case that even at the detailed design stage there are significant creative activities carried out. At the moment, computerised tools tend to support design and manufacturing planning more effectively during this phase of the product engineering process, therefore this work is focussed on examining tools and knowledge capture during detailing. Many of the lessons learnt during such research can then be applied to similar tools developed for use upstream of this part of the product engineering process.
User logging within VR appears to provide an almost non-intrusive method of capturing a rich data source for subsequent analysis and formalisation into engineering knowledge of some sort. By minimising user interactions during the data capture activity, there is a potential to reduce the costly time overhead associated with this process. The work highlighted within this paper outlines one such approach to engineering data capture and reuse. This is central to technology management in the future since the capturing of intent will support future product modification and development, capture the experience of engineers, make it accessible and enable the management of knowledge to be carried out more effectively. This will particularly be useful to sustainable product development processes when feedback of expertise in product disposal will improve product design itself. However, before this can take place methods need to be researched which show how engineering methods and intent can be captured. This paper focuses on some techniques developed in the domain of mechanical product design but provides lessons for more generic aspects of engineering knowledge management and data capture.
Research Work Domain
Cable harness design is a classic design problem within all types of electromechanical equipment which, even with the application of extensive CAD-based packages, many companies find difficult to carry out cost effectively. Indeed, many still employ physical prototypes to check cable routes [10]. There has been considerable research in finding ways to aid or automate this process as highlighted in literature reviews in [11] and [12]. Even with the use of automated systems a survey of industrial companies showed that there was a need for human expert intervention to make fine adjustments and verify solutions [10]; therefore, integrating the human as an integral part of the system can have a marked impact on product development time. Capturing this experience and knowledge will be central to the total automation of software solutions.
In this domain, VR’s unique capability makes it a powerful tool with which to carry out detailed design and manufacturing studies and as a task cable harness design is flexible enough to allow some form of limited task variety to be built into system experiments.
Earlier work at Heriot-Watt University in the area of cable harness design compared an immersive VR design environment with a number of CAD systems showing that VR gave productivity benefits over CAD during creative cable routing design activities [2]. Follow-on work was aimed at understanding the degree to which various aspects of the immersive VR system were contributing to these benefits [10] [11].
Apparatus and Methodology
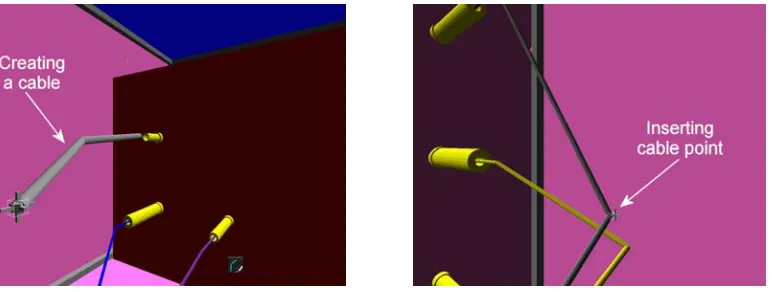
eye on a V8 stereo HMD using a Flock of Birds® magnetic tracking system and Pinch® Gloves. The system software platform was SENSE8®’s WorldToolKit® release 9. Within this an engineer can design and assembly-plan cable harnesses with all design activities being performed whilst immersed in the system. A hierarchical ring menu system (Fig x) and glove pinch gestures are supported by spatial input given by the Flock of Birds™ system. The user routes harnesses by plotting points in 3D space to produce a segmented cable paths. Subsequent cable editing is possible by selecting points and bending them around obstructions or bundling as well as having the ability to insert new points and add connectors and fasteners. Figures 2 and 3 show the system in use.
Fig 2 Hierarchical ring menu
Fig 3 Creating a cable from point to point (left) and inserting a cable point (right)
[image:3.595.108.496.348.494.2]<?xml version=1.0?> <costar_events>
<cable_drag-drop>
<select_cable>1</select_cable> <position_cable>1</position_cable> <release_cable>1</release_cable> </cable_drag-drop>
</costar_events>
<?xml version=1.0?> <costar_events>
<Create_Connector>
<select_connector_type>1</select_connector_type> <grasp_connector>1</grasp_connector>
<position_connector>1</position_connector> <release_connector>1</release_connector> </Create_Connector>
</costar_events>
Fig 4 XML Representations of “Cable Drag & Drop” and “Create Connector” Design Activities
Experimental Procedure and Analysis
Fig 5 Model on completion of the experimental tasks
Fig 6 A partially completed route
The user was presented with the product model containing a completed, fully designed harness assembly. They then had to complete some ‘engineering change requests’ requiring redesign of the harness itself, e.g. the addition of a new cable, the removal of an existing one and its associated connectors. Finally, another ‘undefined’ error was embedded within the model, a cable routed through a solid wall, which the participants had to identify and fix.
Ten male engineers completed the task, eight were 20 – 29 years of age and two 30 – 39, all with normal or corrected-to-normal vision; all were right-hand dominant. Seven of the participants estimated that they had between 10 – 100 hours of previous computer aided design (CAD) experience and three had 100–1,000 hours. Seven had no prior VR experience, two had less than 10 hours and one had 100-1,000 hours. The task was followed by a semi-structured interview during which feedback was collected.
[image:5.595.193.401.260.430.2]Fig 7 Activity category generation
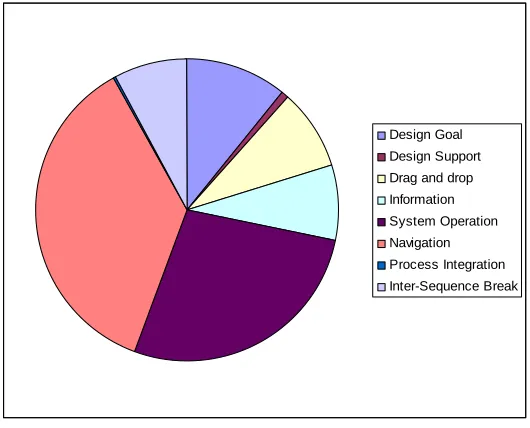
From these data the chart shown in Fig 8 was then automatically generated to give a visual representation of the design task carried out.
Design Goal Design Support Drag and drop Information System Operation Navigation Process Integration Inter-Sequence Break
Fig 8 Activity category pie chart
The activity distributions enable someone analysing the design task and the 3D interface to see how much time is spent actually designing, navigating, modifying and pausing during the whole lead time associated with the activity; more detail relating to this can be found in [2]. This means that inefficiencies in both the 3D interface and product design process can be identified; indeed, as a consequence of these results modifications were made to both the menu interaction system and navigation tools associated with the VR cable harness design system.
[image:6.595.165.430.383.597.2]approach taken in solving a design problem to anyone investigating a design method used by an engineer. Also these data can be stored within a PLM system for future reference.
However, there was a need to see if tools could be identified to recognise best practice during design processes. As a consequence of this, methods of classifying activities in more detail and identifying patterns
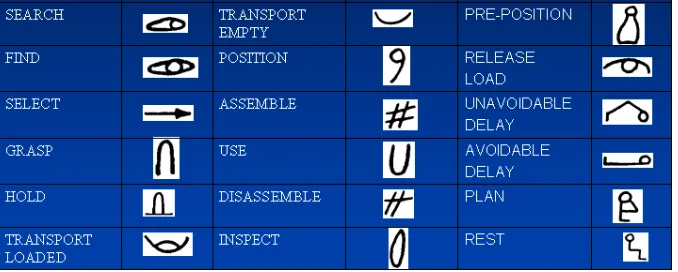
[image:7.595.131.470.240.376.2]of common behaviours within the design process were required. One clue to achieving this was identified whilst observing users using the 3D VR interface; it was recognised that many of the ergonomic hand, arm and head motions carried out using this 3D product design tool mimicked similar movements to those which people carried out when completing physical assembly tasks. Therefore, it was decided to see if there were any tools that existed for analysing assembly tasks which could be used to analyse 3D VR design interfaces. The obvious candidate for this was the well known approach used by Gilbreth for assembly motion study using therbligs (roughly Gilbreth backwards) [13] [14]. Therbligs are a library of symbols that represent all of the mental and physical processes that occur during an assembly task; these are summarised in Fig 9.
Fig 9 Gilbreth’s therblig symbols
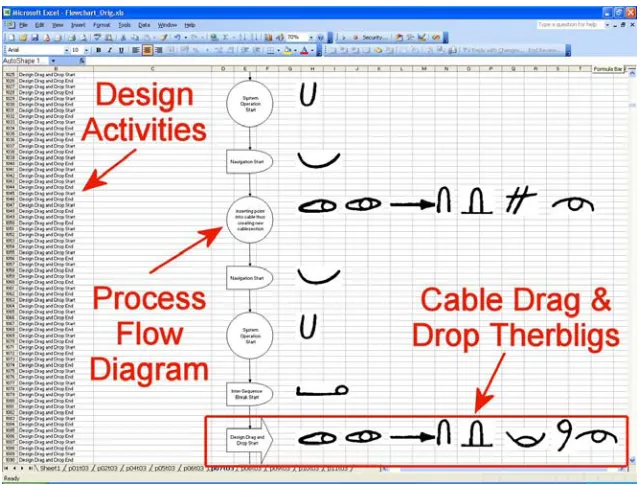
Fig 10 Process flow diagram and associated design category therblig sequences
Therefore, visualising the therblig symbols allows a quick and detailed understanding of design activities in a way simply not possible before as well as identifying potential routes for inefficiencies in the process. Even more importantly, by parsing all of the log files it was possible to identify patterns of repeated design behaviour with a view to either automating these as best practice or using these as part of a knowledge push system (see later). Similar sets of therbligs point to regular behaviours which can be embedded in ontologies, standardised methods or other means of defining processes. The biggest advantage of this approach is that it can be done automatically in real time, so that as patterns of behaviour can be identified as the user carries out a task and information push can take place.
Another Gilbreth creation developed to study assembly motions during assembly processes is the use of the
chronocyclegraph [14]. Traditionally, this involved attaching a light source, flashing at a known constant frequency, to a person’s hand while carrying out a task (Fig 11). This process is recorded over a period of time using one long-exposure photograph which showed the motion of the person’s hand during the assembly task. From the path traces of the user’s hands, called chronocyclegraphs, regions of unnecessary motion and activity, and therefore inefficiency, are highlighted and allow the optimisation of the task. 3D wire frame
Fig 11 An original Gilbreth chronocyclegraph, from [17]
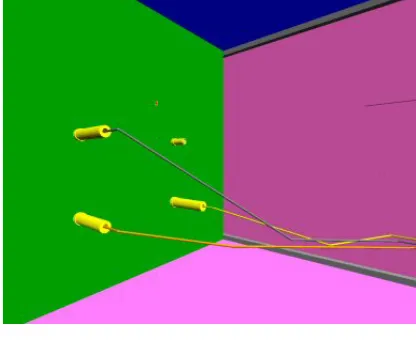
Using the HMD and hand motion tracking data recorded in the log files generated during the VR experiments a chronocyclegraph can now be automatically created as shown in Fig 12. This shows the path that the left-hand took during an individual’s design session with the colours of the path corresponding to a particular design activity category as defined earlier. Since a timestamp is attached to each user action, the velocity and acceleration of the user’s motion can be calculated, in a similar fashion to the original chronocyclegraphs. One potential use of the velocity and acceleration information would be to gauge the designer’s confidence level based on the speed of movement and level of deviation in the direction of travel; this is being investigated in further research. Furthermore, therbligs can also be mapped onto positional information linking the detailed design and user interface task analysis classification with the design categorisation. In addition, it provides an ability to “replay” a previous design activity and would also allow a design to be “rolled back” to a specific point to let the designer to work on it again. Post task analysis also becomes possible. This is the first time that Gilbreth’s methods have been combined in this way to analyse virtual tasks of any kind and, specifically, 3D user interfaces and associated product design and manufacturing planning methods. The chronocyclegraphs can also be superimposed on the actual design to allow a more detailed study of the design approach used. This has further extended the work on assembly planning using both HMD and immersive haptic highlighted in [2] and [11].
Fig 12 - Left hand motion path
Interactive Online Help
As has been mentioned previously, another key benefit of the log file analysis in this work was the potential to push information at the user as they carried out and activity within the design process. By using the therblig
[image:9.595.155.447.519.669.2]that when the user performs an identifiable part of the design activity then it recognises the pattern match, relates this to a part of a particular design task and offers or ‘pushes’ assistance to the user by displaying context-related instructions, as illustrated by the example in Fig 13.
Figure 13 Online help system
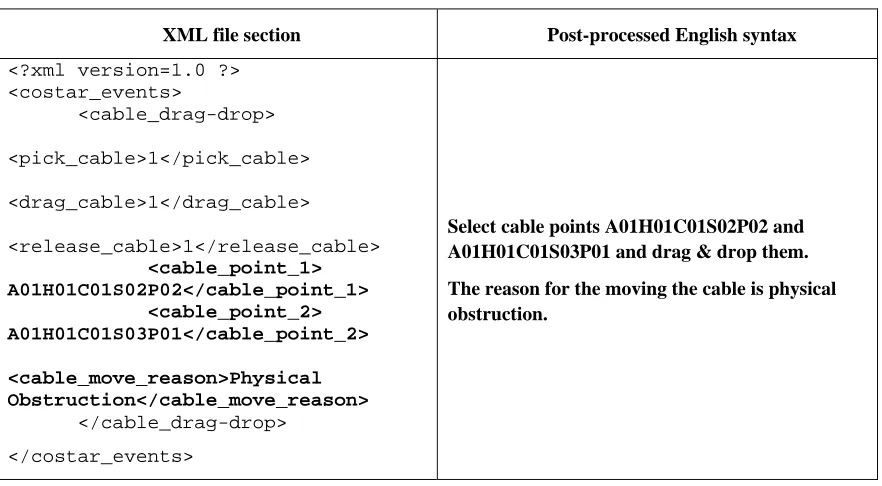
In this case the user is moving a cable for a particular design reason, e.g. avoiding a physical obstruction. On identifying in real time the task pattern associated with amending the cable, i.e. drag-and-drop, the user is prompted with a list of reasons for a possible design change. Once this is chosen then the text associated with the change embedded within the xml log file for subsequent analysis. The menu system has been design such that the interaction and associated task interruption for the user is quick and therefore does not affect the cognitive process associated with the task [15]. Another key output from this logged activity is English-syntax instructions about the design change and the reasoning behind it as shown in Table 1.
Table 1 English syntax describing design change reasoning
XML file section Post-processed English syntax
<?xml version=1.0 ?> <costar_events>
<cable_drag-drop>
<pick_cable>1</pick_cable>
<drag_cable>1</drag_cable>
<release_cable>1</release_cable> <cable_point_1>
A01H01C01S02P02</cable_point_1> <cable_point_2> A01H01C01S03P01</cable_point_2>
<cable_move_reason>Physical Obstruction</cable_move_reason>
</cable_drag-drop> </costar_events>
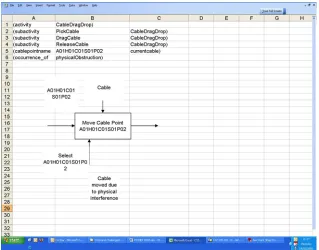
[image:10.595.79.520.403.646.2]Fig 14 Cable drag and drop IDEF0 representation
Post-task analysis also enables the xml log files to be converted into IDEF (Integrated DEFinition Methods) diagrams [16] so that an overview of the decision-making process can be viewed (Fig 14). Charts such as these can easily be placed into a PLM system along with the English syntax description of design changes for future reference; demonstrating the considerable potential for the capture of design rationale and intent using these methods.
Conclusions
A number of novel outputs from this research have demonstrated the potential for immersive VR in aiding the analysis of and supporting product engineering tasks. Although these have been applied at the embodiment and detailed design stage of the product development process it must be remembered that many of these tools will be applicable throughout product lifecycle activities. This work clearly demonstrates the considerable potential for formalising design approaches, rationale and storing it for future use. This will be particularly important for long-life projects which will require access to knowledge from decisions taken from experienced engineers long after they have moved on. These early examples also point to the potential for considerably reducing the cost overhead associated with formalising and storing these kinds of knowledge for this purpose.
With regard to cable harness design itself, it is possible to examine, categorise and measure the wide range of design activities carried out by cable harness design engineers; something which has not been done to this level in the past. Design processes can be analysed in detail through a novel categorisation scheme and motion study methods so that system and user information can be investigated with regard to process improvement. As a consequence of this, design processes can also be automatically mapped from user logged data. This categorisation scheme will be applied to CAD-related tasks in the near future so that these can be compared with VR-based CAD systems.
Therbligs have been applied to a 3D interface to enable a detailed understanding of designer interactions and process activities. These have also been combined with process maps to enable the visual analysis of design activities Chronocyclegraphs have also been produced, enabling – for the first time - a detailed study of 3D virtual interfaces as well as design processes when combined with activity categorisation information.
One area where all of these data will prove useful is that ‘thinking time’ could be extracted from the categorisation, therbligs and chronocyclegraph information, e.g. looking for pauses in activity or changes in physical behaviour, which may point to areas where the user is thinking about the design providing a possibility to imply design intent or reasoning from actions leading up to and after a decision-making event.
improvements have been implemented, the affects of these changes to the system’s usability and functionality can be measured against the benchmarks reported here by reusing the categorisation scheme.
Finally, it has been demonstrated that an interactive online help system to aid users during a design task is feasible and, although again at an early stage, the various technologies required to support this have been described and points to the potential for research into wider and more generic solutions in the mechanical engineering design domain.
Technology management, particularly in the arena of product development and manufacture, in the future will depend on the effective use of knowledge, its acquisition and effective reuse. Significant savings must be available if knowledge previously lost to the engineering process can be retained and reused effective. This relates to the whole product life cycle. Techniques and methods such as these demonstrated in this paper although explicitly relating to product design will have more generic applications in other engineering domains as interactive digital tools become prevalent elsewhere in the product life cycle.
Acknowledgements
References
1 Jayaram S.., Vance J., Gadh R., Jayaram U., Srinivasan H.; “Assessment of VR technology and its application to engineering problems,” Computing and Information Science in Engineering, vol. 1, pp. 72-83, 2001.
2 Holt P.O’B., Ritchie J.M., Day P.N., Simmons J.E.L., Robinson G., Russell G.T., Ng F.M.; “Immersive virtual reality in manufacturing: design metaphors and cognitive ergonomics.”
Computing and Information Science in Engineering, vol. 4, pp. 161-170, 2004.
3 Ritchie J.M., Sung R.C.W., Robinson G., Day P.N., Dewar R.G., Simmons J.E.L.; “Cable harness design, assembly and installation using immersive virtual reality,” Virtual Reality Journal, vol. 11, pp. 261-274, 2007.
4 Ritchie J.M., Dewar R.G., Robinson G., Simmons J.E.L., Ng F.M.; "The role of non-intrusive operator logging to support the analysis and generation of product engineering data using immersive VR." Journal of Virtual and Physical Prototyping, vol. 1, pp.117-134, 2006.
5 Cross, N.; Engineering Design Methods: strategies for product design (third edition), Chichester, Uk, John Wiley and Sons Ltd., 2000.
6 Stauffer L.A., Ullman D.G.; “Fundamental process of mechanical designers based on empirical data.” Journal of Engineering Design, vol. 2, pp. 113-125, (1991).
7 Dani T.H., Gadh R.; “Creation of concept shape design via a virtual reality Interface,” Computer-Aided Design, vol, 29, pp. 555-563, 1997.
8 Varga E., Horvath I., Rusak Z., de Smit B., Broek H.; “Survey and investigation of hand motion processing technologies for compliance with shape conceptualisation,” In Proceedings of DETC’04 ASME Design Engineering Technical Conferences and Computers and Information in Engineering Conference; ASME, DETC2004/CIE-57710, pp. 1-14, 2004.
9 Ritchie J.M., Simmons J.E.L., Dewar R.G., Carpenter I.; “A methodology for eliciting expert knowledge in virtual engineering environments” In Selected Volume on Technology and Innovation Management, , eds. D.F. Kocaoglu, T.R. Anderson, D.Z. Milosevic, K. Niwa, H. Tschirky, Portland, OR, USA, PICMET ’99, pp. 285-290, 1999.
10 Ng, F.M., Ritchie, J.M., Simmons, J.E.L., Dewar, R.G.; "Designing cable harnesses in virtual environments," Journal of Materials Processing Technology, vol. 107, pp. 37-43, 2000.
11 Ritchie J.M., Lim T., Sung R.C.W., Corney J.R., Rea H.; “Part B: The analysis of design and manufacturing tasks using haptic and immersive VR – Some case studies,” In Proceedings Advanced Summer Institute, Universtiy Transilvania Brasov, Romania, 2007.
12 Robinson G., Ritchie J.M., Day P.N., Dewar R.G.; “System design and user evaluation of CoStar: an immersive stereoscopic system for cable harness design,” Computer-Aided Design vol. 39, pp. 245-257., 2007.
13 Johnson S., Ogilvie G.; Work Analysis. The Butterworth Group, London, 1972.
14 Price B; “Frank and Lillian Gilbreth and the manufacture and marketing of motion study, 1908-1924,” Business and Economic History, Second series, vol. 18, pp. 88-89, 1989.
16 Anon; “IDEF- Integrated Definition Methods, Knowledge-based Systems Inc.”
http://www.idef.com/, viewed February 2008.
![Fig 11 An original Gilbreth chronocyclegraph, from [17]](https://thumb-us.123doks.com/thumbv2/123dok_us/1712228.124612/9.595.155.447.519.669/fig-original-gilbreth-chronocyclegraph.webp)