A METHOD FOR EVALUATING 1
THE MECHANICAL PERFORM ANCE 2
OF THIN-WALLED TITANIUM TUBES 3
4 5
P.M. MacKenzie, C.A. Walker, J. McKelvie 6
7
Department of Mechanical Engineering, 8
University of Strathc lyde, 9
Glasgow G1 1XJ, 10
Scotland, UK . 11
12 13 14 15
Tel: 0141 548 2045 17
Fax: 0141 552 5105 18
ABSTRACT 19
A method which was developed to compare the stress-strain properties of three types of 20
thin-walled, commercially pure titanium tubes is presented. The tubes were of types 21
intended for use in large heat-exchanger applications and were to be subjected to 22
significant plastic deformation during subsequent assembly processes. It had been 23
anticipated that small differences in chemical composition and tube-drawing treatment 24
would produce quite different characteristics. It is known that the properties of titanium 25
can exhibit considerable degrees of anisotropy, especially for wrought products; 26
although axial properties of the materials could be evaluated using standard test 27
equipment and procedures, a novel testing system had to be designed to allow the 28
circumferential properties to be assessed. Significant differences between tube types 29
were observed and anisotropic material behaviour was apparent. 30
31
Ke ywords:- anisotropic; commercially pure titanium; ductility; mechanical testing; 32
INTRODUCTION 34
Titanium and its alloys have desirable blends of properties such as low density, high 35
strength and high stiffness, each of which makes them attractive for many structural 36
applications. Coupled to these benefits are exceptional levels of resistance to corrosion 37
and oxidation and, compared with aluminium alloys, distinctly better creep-resistance. 38
For these reasons, the use of titanium and its alloys can be justified economically in an 39
increasing range of high-integrity areas, from aerospace to petrochemicals (and not 40
forgetting to mention the growing market in sports goods). 41
42
Approximately 25% of the market for metallic titanium is made up of the commercially 43
pure (CP) form. CP titanium is, in effect, an alloy of titanium, oxygen and traces of 44
several other elements. Although, in all of the various varieties which come under the 45
CP designation, metallic titanium makes up in excess of 99% of the content, the small 46
fractions of other elements which may be included can influence the mechanical 47
properties to a very significant degree. Most notably, small, controlled amounts of 48
oxygen are dissolved in solid solution to produce increases in strength but, ultimately, 49
with a significant reduction in ductility. CP titanium generally displays good ductility 50
and can be forged, rolled, drawn or extruded quite straightforwardly but its hexagonal 51
close packed (α−phase) structure does limit formability. In addition, the textures 52
developed in wrought products for α− titanium and its alloys can have a marked effect 53
on the mechanical properties of the finished material and distinctly anisotropic material 54
behaviour can be a common feature [1 - 6]. 55
The work presented here was focussed on evaluating mechanical properties of thin-57
walled CP titanium tubes intended for use in heat exchangers. The key justification of 58
the work was that, during the fabrication process, expansion of tubes into tube-sheets 59
produces high levels of plastic deformation of the tube material circumferentially [7,8] 60
and, to this end in particular, a novel method for assessing the response of the material 61
in the circumferential direction was required. 62
63
SPECIMEN M ATERIALS 64
Specimens of three different types of drawn tube were used in the investigation. Details 65
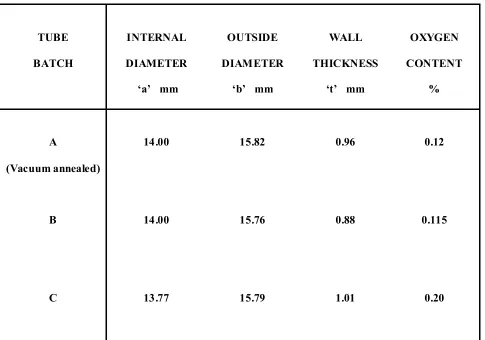
of oxygen content together with tube dimensions are summarised in Table 1. 66
67
Figure 1 contains representative micrographs of the grain structure of each of the three 68
specimen groups, designated Types ‘A’, ‘B’ and ‘C’. Type ‘A’, the only vacuum 69
annealed sample, shows very much larger grain diameter (by a factor of 4 to 5 70
approximately [9]) than do either of the other types. The three dimensional nature of the 71
texture could not be assessed by optical microscopy alone and was beyond the scope of 72
the present work. 73
74
AXIAL AND CIRCUMFERENTIAL LOADING CONFIGURATIONS 75
Axial testing of the tubes was performed in a relatively straightforward manner, as 76
prescribed in [10], the British Standard. This requires quite simply that the tube ends, 77
through which loads were to be applied, be reinforced in a prescribed manner; it also 78
discussed below). Specimen tube lengths of 400 mm satisfied the requirement of the 80
standard test. Loads were applied using an Instron 1342 servo-hydraulic test machine. 81
82
By contrast, an entirely novel setup had to be designed in order to enable 83
circumferential loading of the material, with axial stresses, up to yield point at least, 84
eliminated as far as possible; there is no published prior art with regard to this.. Whilst 85
there is a wealth of literature relating to the contiguous technology of hydroforming, for 86
example, [11 - 14], this almost invariably deals with the application of intentional 87
biaxial loading conditions. Indeed, [13] describes a method of testing tubular specimens 88
with deliberately induced biaxial loads, so as to simulate the conditions found in the 89
hydroforming process. The hydraulic test rig constructed for the present purpose is 90
shown schematically in Figure 2. It was designed to perform two main functions: to 91
ensure loading of the specimens in the desired manner, i.e., no, or minimal, axial 92
loading up to yield; and to enable controlled application of the loading or expansion, 93
this being achieved by having the Instron test machine previously mentioned adapted to 94
provide the driving force for the rig. As shown in Figure 3, the test rig was mounted 95
between the platens of the test machine, thereby enabling full feedback control of the 96
pressure applied to the specimens. 97
98
SPECIMEN SEALING ARRANGEMENTS 99
The test rig also incorporated the specimen holder consisting of a removable steel core, 100
with seals, mounted between a crosshead and the pump body. Specimens of dimensions 101
given in Figure 4 were mounted on the core, and through this, the pressurised hydraulic 102
104
Initially, it had been intended that the specimen sealing arrangement would consist of a 105
bespoke nitrile rubber bladder but this proved to be unsatisfactory. From axial test 106
results, it had appeared that pressures of approximately 100 MPa might be required in 107
order to take the tubes to failure. This system was capable of containing only 10% of the 108
target value. Bonding the seal to the central core using cyanoacrylate adhesive produced 109
a substantial improvement in performance but, at seal failure pressures of about 60 110
MPa, this still fell short of the programme requirement. 111
112
In order to minimise axial loads up to yield, it was essential that the tubes be free-113
floating, i.e., the ends could not be plugged during the tests. To this end, an alternative 114
technology to the bladder seal proved to be entirely satisfactory. This consisted of a 115
setup using conventional nitrile rubber ’O’-ring seals on a special core, in tandem with 116
spiral PTFE backing washers to prevent seal extrusion (Figure 5). Steel rings of 117
thickness 2mm and diameter 0.2mm greater than those of the specimens were used to 118
support the specimen at the point of contact with the ‘O’-rings. This setup allowed 119
pressures up to 140 MPa to be contained. 120
121
A key feature of the design is that the pressure end-loads imparted through the specimen 122
cores were supported by, on the one hand, the pump body, and on the other, by the 123
retaining cross-head mounted on reaction columns. By using two-piece cores, a 124
potential problem in the oil-way at the core to body seal was eliminated since it was 125
tending to open the seal was always more than balanced by the pressure force on the 127
core from within the specimen. 128
129
Prior to each test, the hydraulic system, including the fresh specimen, was recharged 130
with working fluid (Esso Nuto-H46) by first evacuating it to ensure no air pockets 131
remained. 132
133
TEST PROCEDURE 134
Instrumentation comprised: Instron 100kN load cell (for the axial loading 135
configuration); Shape 140 MPa pressure transmitter (for the circumferential loading 136
configuration); a purpose-built clip-gauge diametrical strain transducer, Figure 6, 137
essentially, two spring steel blades to which were attached four 6.35mm 1000Ω strain 138
gauges connected in full-bridge configuration; 6.35 mm 120Ω strain gauges for 139
attachment directly to the specimens; signal conditioning electronics; autographic 140
recording equipment. 141
142
The specimen strain gauges were used during the hydraulic tests to monitor more 143
precisely the behaviour up to yield, the diametrical transducer being intended for 144
measurement of gross strains only. The diametrical transducer was calibrated and 145
checked for linearity using precision ground cylindrical gauge bars; in practice, it was 146
found invariably to give readings within 0.5% of micrometer measurements of the 147
specimen diameters at failure. 148
In evaluating the axially loaded properties of the tubes, a conventional setup was used. 150
The loads were obtained from the test machine load cell and displacements to yield 151
whilst a 50 mm gauge-length LVDT displacement transducer provided measurements of 152
extension. Elongation at failure was measured using pre-marked scales on the 153
specimens over an initial gauge-length of 50 mm. 154
155
Strain rates for both loading configurations were set to be in the range 50 to 120 156
microstrain per second up to the 0.2% proof stress level, followed by an increase in rate 157
to give failure within one additional minute. 158
159
Figure 7 shows representative traces, taken from the circumferential loading tests, of 160
internal pressure v. diametrical strain records for each of the three sample types. 161
162
RESULTS AND DISCUSSION 163
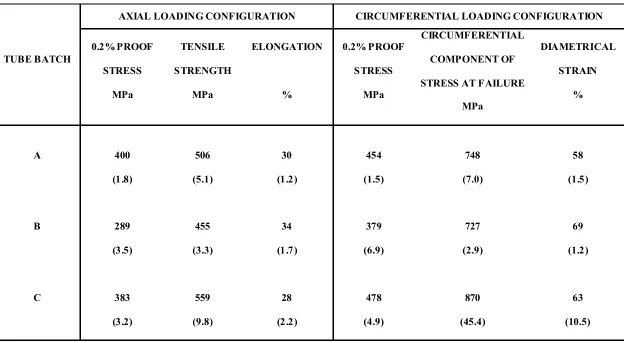
The results are summarised in Table 2, and in Figure 8. For the axial loading 164
configuration, the values given are for engineering stress-strain and similarly for the 165
circumferentially loaded case, except that here, instead of the tensile strength being 166
given, the circumferential stress component at failure has been presented; this was 167
calculated using the recorded internal pressure, Pf, and the final maximum internal
168
radius, rf, at failure, to obtain the applied circumferential stress thus:
169
t
r
P
f f h=
σ
……….. (1)170
The tensile strength for the axial case was taken, conventionally, to be the engineering 171
point for the Type ‘C’ record shown in Figure 7 was, to a varying degree, apparent for 173
all Type ‘C’ specimens tested. 174
175
There are some areas to be careful of in examining these data. First of all, whilst it is 176
reasonable to use the results for axial elongation at failure to compare the performance 177
of the different tube types, and to use, similarly, the diametrical strain results, to make 178
direct comparison between the axial and diametrical strain performance would be 179
unsound. The failure by necking in the axial-loading case produces a very different 180
plastic flow regime from that observed in the circumferentially loaded tests. 181
Furthermore, the gross changes in tube geometry observed in the circumferential 182
loading tests progressively introduced an increasingly significant axial component of 183
stress. In other words, the performance one is able to observe here is influenced by the 184
specimen geometry at high strain levels; the test should be regarded as a method for 185
assessing the material-component combination, not as a proposed standard material test 186
per se. For hydraulic loading in the setup developed here, and by measuring the change 187
in internal radius from the initial condition, r1, to any strained (bulged) condition of
188
radius, r2, one can evaluate the magnitude of the axial hydraulic force. From this, the
189
Thus, for the maximum value of diametrical strain,
ε
d, observed during hydraulic194
testing (69%), an axial component of stress equal to 32% of the applied circumferential 195
stress would be induced. On the other hand, at the typical strain values (about 0.6%) 196
measured at the Proof Stress, the axial component of stress introduced due to the 197
bulging of the tubes can be shown to amount to much less than 1% of the applied 198
circumferential stress. 199
200
We can note certain other points with a considerable degree of confidence, however. It 201
is clear that, of the three batches, Type ‘B’, with the lowest oxygen content, exhibited 202
the lowest Proof Stress, the lowest tensile strength, and the highest ductility for both 203
loading configurations. Type ‘C’, having the highest oxygen content, also showed the 204
highest values for both axial tensile strength and for failure pressure in the hydraulic 205
tests, but with by far the greatest degree of scatter of the three tube types. Figure 9 206
shows two examples of circumferentially loaded Type ‘C’ tubes post-failure; of the 207
thirteen specimens of this type, ten failed by pinhole leak and the remaining three by 208
unstable fracture. In the cases where fracture occurred, the diametrical strain at failure 209
was at the upper end of the range for this type (73 % to 77% for the three results, 210
compared to a mean of 63%). All of the Type ‘A’ and Type ‘B’ specimens failed by 211
unstable fracture. 212
213
Given the negligible change in geometry observed at the yield point, one can reasonably 214
draw comparisons between the axial and circumferential values for Proof Stress: whilst 215
direction, Type ‘A’ the large-grained vacuum annealed batch, proved to be closer to 217
isotropic in this respect showing an increase of only 14%. 218
219
In passing, it might be noted that the Hall-Petch relationship [15, 16] states that: 220
d
K
y
=
σ
+
σ
0 ……… (3)221
where the yield stress,
σ
y, can be predicted as a function of:σ
0, the “intrinsic yield” of 222the material; d, the grain diameter; and K, a material constant. In the present case, 223
although the three sets of specimens were of near identical chemical composition (and 224
within the range prescribed for “commercially pure”), a cursory inspection of the 225
micrographs in Figure 1 confirms that Type ‘B’ has the smallest grain size and yet it 226
also has the lowest measured values of
σ
y for both axial and circumferential loading227
cases. In other words, the observed results run counter to the relationship and it 228
therefore does not hold for this situation. This can be explained in that, as previously 229
stated, the mechanical properties of CP titanium are highly sensitive to very small 230
variations in chemical composition (of the scale seen here) and, furthermore, an 231
additional determining factor, the initial level of dislocation density in the materials was 232
“as manufactured”, i.e., was not deliberately controlled for investigative purposes. 233
234
In summary, the primary objective of this work was to devise a system to enable 235
objective evaluation of, and comparison between, the properties to failure for tube 236
specimens of near-identical geometry and the results obtained from the test setup which 237
was developed have demonstrated its capability of performing this task satisfactorily. 238
CONCLUSIONS 240
A system for making comparative evaluations of, separately, the axially and 241
circumferentially loaded performance of tubular specimens of CP titanium has been 242
demonstrated. This required the development of a new experimental setup for applying 243
circumferential stresses hydraulically; using this, axial loads were essentially eliminated 244
up to specimen yield. The arrangement also enabled useful comparisons to be made of 245
ductility up to failure with circumferential loading predominant. Axial load testing 246
followed the prescribed method of a standard test procedure. 247
248
Tests were performed on three candidate tube types intended for a large-scale heat 249
exchanger application. Measured mechanical properties differed significantly between 250
the three types. All three batches displayed yield behaviour which to a significant 251
degree was dependent on orientation. Differences in performance between the tube 252
types could not be attributed directly to observed differences in average grain size. The 253
tests confirmed that tube Type ‘C’, having the highest oxygen content, was, generally, 254
the strongest of the three groups over both loading regimes, but at little or no cost in 255
relation to its ductility; Type ‘C’ was, therefore, deemed most appropriate for the 256
proposed high-integrity application. 257
258
Finally, the findings confirm that, where it is a requirement that detailed quantitative 259
comparison be made between types of CP titanium tube produced by different 260
manufacturing process, or having small differences in chemical composition, it is 261
important to conduct tests on specimens of finished tubes, there being no convenient 262
REFERENCES
1) Titanium Information Group, Titanium for Marine and Offshore Applications – A Designers’ and Users’ Handbook. Kjeller, Norway: Institutt for Energiteknikk, 1999.
2) Seagle, S.R., The state of the USA titanium industry in 1995. Materials Science and Engineering 1996;A213, 1–7.
3) Yamada, M., An overview on the development of titanium alloys for non-aerospace application in Japan, Materials Science and Engineering 1996; A213, 8–15.
4) Jaffee, R.I., Promisel, NE., (eds), The Science, Technology and Application of Titanium. Oxford, UK: Pergamon Press, 1970.
5) Bache, M.R., Evans, W.J., Suddell, B., Herrouin, F.R.M., The effects of texture in titanium alloys for engineering components under fatigue, International Journal of Fatigue 2001; 23, S153 – S159.
6) Davies, R.W., Khaleel, M.A., Kinsel, W.C., Zbib, H.M. (2002) Anisotropic yield locus evolution during cold pilgering of titanium alloy tubing, Trans ASME, Journal of Engineering Materials and Technology 2002; 124, 125 – 134. 7) Goodier, J.N., Schoessow, G.J., The holding power and hydraulic tightness of
expanded tube joints: analysis of the stress and deformation, Trans ASME 1943; 65, 489-96.
8) Alexander, J.M, Ford, H., On Expanding a Hole from Zero Radius in a Thin Infinite Plate, Proceedings of the Royal Society of London. Series A, Mathematical and Physical Sciences 1954; 226, 543-561.
Institute, 2001.
11)Tirosh, J., Neuberger, A., Shirizly, A., On tube expansion by internal fluid pressure with additional compressive stress, International Journal of Mechanical Science 1996; 38, 839-851.
12)Zhang, S.H., Developments in hydroforming, Journal of Materials Processing Technology 1999;91, 236-244.
13)Sokolowski, T., Gerke, K., Ahmetoglu, M., Altan, T., Evaluation of tube formability and material characteristics: hydraulic bulge testing of tubes, Journal of Materials Processing Technology 2000; 98, 34-40.
14)Lang, L.H., Wang, Z.R., Kang, D.C., Yuan, S.J., Zhang, S.H., Danckert, J., Nielsen, K.B., Hydroforming highlights: sheet hydroforming and tube hydroforming, Journal of Materials Processing Technology 2004; 151, 165-177
15)Polmear, I.J. (1989) Light Alloys. London, UK: Edward Arnold, 1989.
16)Kao, Y.L., Tu, G.C., Huang, C.A., Liu, T.T., A study on the hardness variation of
FIGURES AND CAPTIONS
FIGURE 1: Micrographs of Type ‘A’, ‘B’ and ‘C’ commercially pure titanium tube specimens.
FIGURE 2: Schematic of self-contained high-pressure pump and specimen holder. FIGURE 3: Pump and specimen holder mounted in jaws of servo-hydraulic test
machine.
FIGURE 4: Specimen dimensions.
FIGURE 5: Test-rig core and specimen sealing arrangement incorporating nitrile ‘O’-rings and PTFE spiral backing washers to prevent seal extrusion.
FIGURE 6: Clip gauge diametrical strain transducer (dimensions in mm). 1000Ω strain gauges were positioned at ‘SG’. The tube diameters were measure between the 38 mm radius arcs of a pair of jaws attached to the blade ends.
FIGURE 7: Sample records of applied internal pressure v. diametrical strain from circumferential loading tests.
FIGURE 7: Summary of results of tests to failure
FIGURE 8: Examples of post-failure Type ‘C’ specimens – unstable fracture and “pinhole” failure.
Figure1
Figure2
Figure3
Figure4
Figure5
Figure6
Figure7
Figure8
Figure9
TABLE 1
Desc ription of spec imen tube types.
TUBE
BATCH
INTERNAL
DIAMETER
‘a’ mm
OUTSIDE
DIAMETER
‘b’ mm
WALL
THICKNESS
‘t’ mm
OXYGEN
CONTENT
%
A
(Vacuum annealed)
14.00 15.82 0.96 0.12
B 14.00 15.76 0.88 0.115
C 13.77 15.79 1.01 0.20
TABLE 2
Summary of results for te nsile and c ircumfere ntial loading tests (standard deviation in bracke ts).
AXIAL LOADING CONFIGURATION CIRCUMFERENTIAL LOADING CONFIGURATION
TUBE BATCH 0.2% PROOF STRESS MPa TENSILE STRENGTH MPa ELONGATION % 0.2% PROOF STRESS MPa CIRCUMFERENTIAL COMPONENT OF
STRESS AT FAILURE
MPa
DIAMETRICAL
STRAIN
%
A 400
(1.8) 506 (5.1) 30 (1.2) 454 (1.5) 748 (7.0) 58 (1.5)
B 289
(3.5) 455 (3.3) 34 (1.7) 379 (6.9) 727 (2.9) 69 (1.2)
C 383