Eddy current testing of AGR fuel cladding
Maxim Morozov and S Gareth Pierce University of Strathclyde
Technology & Innovation Centre, 99 George Street Glasgow, Scotland, G1 1RD, UK
+44 (0)141 444 7406 maxim.morozov@strath.ac.uk
Gary T Bolton
National Nuclear Laboratory, UK
Abstract
The scope of the presented study was to investigate feasibility of Eddy Current Testing (ECT) for detection in storage of inter-granular attack (IGA) cracking and general clad thinning of irradiated fuel cladding from Advanced Gas-cooled Reactors (AGR). The impact of the storage environment, particularly the effect of immersion in water compared to measurements in air, has also been investigated. A miniature EC probe was developed to induce eddy currents in a pin and to read out EC response. The transducer was robotically moved along the AGR pin and multi-frequency EC responses were acquired using a spectrum analyser. Main results of the experimental investigation are the following: even very small artificial defects such as short EDM notches of depth of 100μm produce distinguishable EC response; localised clad thinning of depth of 100μm and above produces considerable EC response levels; effect of water environment on the EC response is negligible; effect of anti-stacking grooves on the EC response is considerable.
1. Introduction
Figure 1a&b shows a photograph and a CAD model of an AGR fuel cladding (pin), respectively. Material of AGR fuel cladding is austenitic stainless steel (SS) of the following chemical composition: 20Cr-25Ni-Nb (1). Its electrical conductivity σ is reported to be 0.993 MS/m (1, 2). Magnetic properties of the material are not known. Normally, austenitic SS is non-ferromagnetic, that is its relative magnetic permeability (μr) is very close to 1. It has been reported that similar AGR fuel pins were slightly
magnetic (1). On the other hand, it has also been reported that AGR fuel cladding material only becomes magnetic after thermal treatment at 900°C for 48 hours (3). These electromagnetic properties make AGR fuel cladding suitable for inspection by means of electromagnetic NDT methods such as ECT.
IGA is a form of corrosion where the boundaries of crystallites of the material are more susceptible to corrosion than their insides (4). This can happen in otherwise corrosion-resistant alloys, when the grain boundaries are depleted, known as grain boundary depletion, of the corrosion-inhibiting elements such as chromium (4). In austenitic stainless steels, where chromium is added for corrosion resistance, the mechanism involved is precipitation of chromium carbide at the grain boundaries, resulting in the formation of chromium-depleted zones adjacent to the grain boundaries, this process being called sensitization (4) and can be induced by exposure to radiation. IGA induced by environmental stresses is called stress corrosion cracking (SCC). Figure 2 shows a metallographic cross section perpendicular to a stress corrosion crack. It can be observed that SCC cracking represents a volumetric defect which has width of order of magnitude of several millimetres, thus it will disturb eddy currents flowing across as well as along the crack (5). Limited literature is available regarding ECT of IGA and quantification of sensitization in austenitic stainless steel (6, 7). Little sensitivity of EC response to the sensitization level as precursor of IGA has been observed, however it has been concluded that ECT could be used to detect and quantify IGA (8). Successful application of ECT for detection and quantification of stress corrosion cracking in stainless steels has been reported in (9-14).
(a) (b)
[image:2.595.147.449.495.742.2]Figure 2. Metallographic cross section perpendicular to a stress corrosion crack
A nonlinear ultrasonic technique has been developed to evaluate sensitization in Type 304 stainless steel (15). A good correlation was reported between the degree of sensitization measured by the electrochemical potentio-kinetic reactivation test and the ultrasonic nonlinearity parameter. This study is claimed to have demonstrated that nonlinear ultrasonic technique can be used as a potential technique for non-destructive characterization of sensitization in austenitic stainless steel. Assessment of intergranular corrosion attack in austenitic stainless steel using ultrasonic measurements has also been reported in (16).
2. Experimental setup, results and discussion
2.1 Samples
AGR fuel pins are stainless steel cylindrical ribbed pipes of 1000mm length, inner diameter of the rod is circa 14.6 mm, external diameter of the rod without ribbing is circa 15.4mm and external diameter of the rod with ribbing is circa 16.2mm (a rib height is circa 400μm), wall thickness of circa 0.4mm.
The following artificial defects were produced in the cladding:
1) Helical EDM notches parallel to the ribbing as shown in Figure 3a. The notches had lengths of 2.5mm, 5mm and 10mm and depths of 25%, 50%, 75% and 100% of the cladding wall thickness located on the outer diameter of the fuel pin and thus denoted as OD25%, OD50%, OD75% and Through.
2) Circumferential EDM notches (shown in Figure 3b) of depth of 50% of the total wall thickness and lengths of 4mm, 9mm and 12mm.
(a) (b) (c)
Figure 3. AGR fuel pins used in the ECT study: (a) pin with a helical EDM notch parallel to the ribbing; (b) pin with a circumferential EDM notch; (c) localised clad
wall thinning
2.2 Experimental setup
ECT is an electromagnetic non-contact method of Non-Destructive Testing based on induction of alternating electric currents in conducting test pieces. Defects disrupting the flow of eddy currents cause change of the magnetic flux coupled with the inductor (typically a coil) which can be detected either as change of the coil’s impedance or as a local magnetic field variation.
Due to the skin effect, density of eddy currents induced by an external alternating magnetic field in an electrical conductor exponentially decreases with increasing depths under the surface of the conductor. In order to produce sizable EC response, the standard depth of penetration should not exceed the thickness of the tested object (17). Since the electrical conductivity of the AGR fuel pin steel is very low (below 1MS/m) and the wall thickness is small (circa 400μm), the excitation frequency should be in the range between several hundreds of kHz and few MHz.
A miniature probe coil with mean diameter of few mm was designed and manufactured for inspection of the AGR fuel cladding. The probe coil was oriented along the radial direction of the pin, perpendicular to the pin surface. The probe coil induces local eddy currents over a small area and offers a better spatial resolution. The EC scanning was performed using KUKA robotic arm KR5 arc HW along helical paths with the point probe fitting between the ribs. The helical path offers the following advantages compared to an axial scan along a straight line:
1) Lift-off due to ribs, which would be inevitable in the case of an axial scan along a straight line, can be reduced to minimum because the probe is between ribs. 2) Periodical EC background noise due ribs is avoided (even though this noise can
An impedance analyser Agilent 4395A was used to measure impedance variation (the real part of impedance – serial resistance Rs, and the imaginary part divided by
frequency - serial inductance Ls) of the coils in the range of swept excitation frequencies
from 100 kHz up to the respective resonance frequency. The entire inspection process was fully automated; measurement of signals from the EC transducers was synchronised with the robot movement in order to enable acquisition of accurate positional data.
EC response is obtained in form of coil impedance Z = Rs + jωLs, where Rs is the series
resistance (real part), ω=2πf, f being the excitation frequency, Ls is the series
inductance. Digital band-pass filtering was applied to the scanned EC responses. Absolute difference impedance
ΔZ = Zdefect – Zunperturbed...(1)
and relative impedance sensitivity to the defects
ΔZ = (Zdefect – Zunperturbed)/Zunperturbed...(2)
and
log10(ΔZ)...(3)
are used to represent the EC response.
The EC results are presented as spectrograms (2D representation of the spectrum of frequencies in the EC response as they vary with the axial scan distance along the pin) of the real and imaginary parts of the impedance, linear scans at selected frequencies and in complex impedance plane (Lissajous curve) which are traditionally used in ECT.
2.3 Scan results
Due to limitation of the number of pages of the manuscript, only selected ECT results are presented.
2.3.1 Helical EDM notches
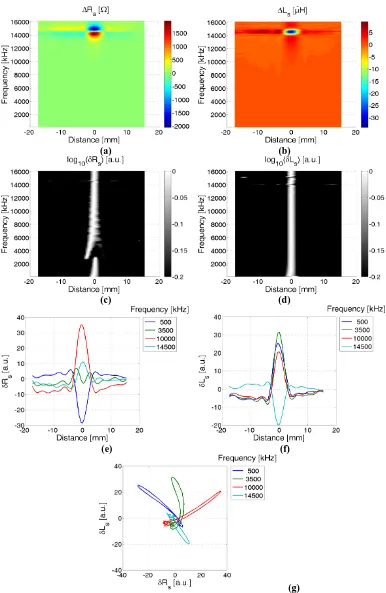
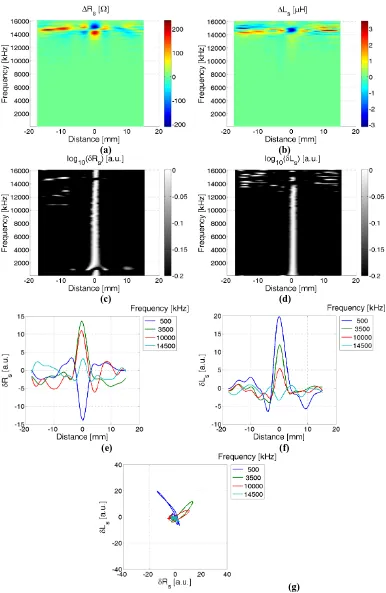
Figures 4 to 6 represent EC responses of the probe coil to the tested helical EDM notches. Defects as shallow as OD50% and as short as 2.5mm were unambiguously detected. EC responses to OD25% were distinguished, however they had low SNRs.
2.3.2 Circumferential EDM notches
Figure 7 represents EC response of the probe coil to a circumferential EDM OD50% notch. Even though these defects represent very small disturbance for eddy currents, they produce characteristic EC signatures in the respective spectrograms.
2.3.3 Wall Thinning due to general corrosion
(a) (b)
(c) (d)
(e) (f)
[image:6.595.102.488.79.672.2](g)
Figure 4. EC response of a probe coil to a helical EDM notch of 5mm length through the entire fuel cladding wall thickness: (a) absolute difference response spectrogram of Rs, (b) absolute difference
response spectrogram of Ls, (c) relative difference response spectrogram of Rs, (d) relative difference response spectrogram of Ls, (e) line scan of relative difference response of Rs at selected
(a) (b)
(c) (d)
(e) (f)
[image:7.595.102.489.80.673.2](g)
Figure 5. EC response of a probe coil to a helical EDM OD75% notch of 5mm length: (a) absolute difference response spectrogram of Rs, (b) absolute difference response spectrogram of Ls, (c) relative difference response spectrogram of Rs, (d) relative difference response spectrogram of Ls,
(e) line scan of relative difference response of Rs at selected frequencies, (f) line scan of relative difference response of Ls at selected frequencies, (g) complex impedance plane representation of
(a) (b)
(c) (d)
(e) (f)
[image:8.595.102.488.80.673.2](g)
Figure 6. EC response of a probe coil to a helical EDM OD50% notch of 5mm length: (a) absolute difference response spectrogram of Rs, (b) absolute difference response spectrogram of Ls, (c) relative difference response spectrogram of Rs, (d) relative difference response spectrogram of Ls,
(e) line scan of relative difference response of Rs at selected frequencies, (f) line scan of relative difference response of Ls at selected frequencies, (g) complex impedance plane representation of
(a) (b)
(c) (d)
(e) (f)
[image:9.595.103.489.80.672.2](g)
Figure 7. EC response of a probe coil to a circumferential EDM OD50% notch of 12mm length: (a) absolute difference response spectrogram of Rs, (b) absolute difference response spectrogram of Ls, (c) relative difference response spectrogram of Rs, (d) relative difference response spectrogram of Ls, (e) line scan of relative difference response of Rs at selected frequencies, (f) line scan of relative difference response of Ls at selected frequencies, (g) complex impedance plane representation of
(a) (b)
(c) (d)
(e) (f)
[image:10.595.102.487.79.668.2](g)
Figure 8. EC response of a probe coil to a localised wall thinning by 200μm: (a) absolute difference response spectrogram of Rs, (b) absolute difference response spectrogram of Ls, (c) relative difference response spectrogram of Rs, (d) relative difference response spectrogram of Ls, (e) line scan of relative difference response of Rs at selected frequencies, (f) line scan of relative difference
3. Conclusions
This paper presented results of experimental feasibility study of Eddy Current (EC) testing of fuel pins of Advanced Gas-cooled Reactor (AGR) for various typologies of defects. Main results are the following:
• A fully automated experimental rig for robotic scanning of the AGR fuel pins using eddy currents method has been developed.
• Even very small artificial defects such as short EDM notches of depth of 100μm produce distinguishable EC response.
• Localised clad thinning of depth of 100μm and above produces considerable EC response levels.
Acknowledgements
This work was funded by Sellafield Ltd.
References
1. Nagy, P.B., Corrosion Sensing for Advanced Gas-cooled Reactor Fuel Cladding. Phase 1: Modelling Proof of Concept, 2012.
2. Nagy, P.B., Corrosion Sensing for Advanced Gas-cooled Reactor Fuel Cladding. Phase 2a: Experimental Proof of Concept on Artificial Defects, 2014.
3. Phuah, S., Corrosion of spent advanced gas reactor (agr) fuel cladding in trace aqueous electrolyte environments.
4. Intergranular corrosion. Available from:
http://en.wikipedia.org/wiki/Intergranular_corrosion.
5. Chen, Z., et al., A nondestructive strategy for the distinction of natural fatigue and stress corrosion cracks based on signals from eddy current testing. Journal of Pressure Vessel Technology, Transactions of the ASME, 2007. 129(4): p. 719-728.
6. Shaikh, H., et al., Use of eddy current testing method in detection and evaluation of sensitisation and intergranular corrosion in austenitic stainless steels. Corrosion Science, 2006. 48(6): p. 1462-1482.
7. Shaikh, H., et al., Effect of carbon content on eddy current response to sensitization and intergranular corrosion in simulated heat-affected zone of austenitic stainless steel. Welding in the World, 2012. 56(5-6): p. 44-53.
8. Shaikh, H., et al., Assessment of intergranular corrosion in AISI type 316L stainless steel weldments. British Corrosion Journal, 2002. 37(2): p. 129-140. 9. Chen, Z., N. Yusa, and K. Miya, Sizing of volumetric stress corrosion crack from
eddy current testing signals with consideration of crack width, in Studies in Applied Electromagnetics and Mechanics2007. p. 259-266.
10. Chen, Z., N. Yusa, and K. Miya, Enhancements of eddy current testing techniques for quantitative nondestructive testing of key structural components of nuclear power plants. Nuclear Engineering and Design, 2008. 238(7): p. 1651-1656. 11. Wang, J., et al. Discussion on distributed conductivity for modeling stress
12. Wang, J., et al., Inspection and modeling of stress corrosion crack by eddy current testing. Huadong Ligong Daxue Xuebao/Journal of East China University of Science and Technology, 2013. 39(5): p. 625-628.
13. Wang, L., et al., Sizing of long stress corrosion crack from 2D ECT signals by using a multisegment inverse analysis strategy. International Journal of Applied Electromagnetics and Mechanics, 2008. 28(1-2): p. 155-161.
14. Morozov, M., et al., Toward the reconstruction of stress corrosion cracks using benchmark eddy currents signals, in Studies in Applied Electromagnetics and Mechanics2008. p. 179-186.
15. Abraham, S.T., et al., Assessment of sensitization in aisi 304 stainless steel by nonlinear ultrasonic method. Acta Metallurgica Sinica (English Letters), 2013. 26(5): p. 545-552.
16. Jothilakshmi, N., P.P. Nanekar, and V. Kain, Assessment of intergranular corrosion attack in austenitic stainless steel using ultrasonic measurements. Corrosion, 2013. 69(4): p. 388-395.