Mapping the role of Cr content in dry sliding of steels: comparison between maps for material and counterface
G. Rasool and M.M. Stack
Department of Mechanical and Aerospace Engineering
University of Strathclyde, James Weir Building, 75 Montrose St.,
Glasgow, G1 1XJ
Abstract
In this work, a study of the wear transition regimes was carried out for a pin-on-disk sliding couple, involving two steels of different hardness and Cr contents. Dry sliding wear behaviour of the more highly alloyed stainless steel was dominated by adhesive wear and tribo-oxidation at relatively low sliding speeds and by mixed and adhesive wear at high speeds and loads. In contrast, oxidative wear was more predominant for the lower alloyed steel. The individual wear maps generated for the individual components i.e. material and counterface are discussed in the context of the wear mechanisms observed in the tribological contact.
Keywords: Wear maps, Cr containing steels, Oxidative wear, sliding speed, normal load
1. Introduction
As observed by several authors [1], during sliding wear, the variation of friction and wear rate depend on interfacial conditions such as normal load, geometry, relative surface motion, sliding speed, surface roughness of the rubbing surfaces, type of material, system rigidity, temperature, stick slip, relative humidity, lubrication and vibration. Among these considerations, sliding speed and normal load are the two major factors that play a significant role in the variation of friction and wear rate.
from the rubbing surface, causing wear. However, in a real tribo-system, the debris can be trapped in the wear tracks and become involved in the sliding processes, significantly affecting the total wear loss [4-6].
Transitions in wear rates from initial severe wear to a mild wear has been widely found for sliding wear of metals [7]. Such a transition is caused by different parameters, such as reductions in sliding speed [8], and load [9], and high rates of oxidation [10-11]. For many metals and alloys, a transition temperature is observed [11-14]; above this temperature, the wear rate in mild wear area decreases rapidly with the increase of temperature and smooth oxide layer „glaze‟ is formed on the wear tracks [15]. These oxide layers also act as a solid lubricant and prevents metal-metal contact of the mating sliding surfaces. This tribo-oxidation process reduce the coefficient of friction and wear rate of the metals as compared to that of the same pair in vacuum (inert) environments [3-5 & 16].
Early considerations revolved around the notion of plasticity (hardness) at contact zones and it was realized for metals that large plastic strains have to be incurred at the contact before a particle can be fractured from the bulk. For adhesive and abrasive wear processes, it was shown that the material removed in both events is directly proportional to the sliding distance and the normal load and is inversely proportional to the hardness [17]. However, extensive experimental work, for a variety of metals [18-20] demonstrated that the wear rates, when measured over a wide range of normal loads and sliding speeds, show sharp transitions and non-linear trend with respect to the changes in load and speed. The inverse linear relationship with respect to hardness was also found to break down at low loads and high speeds [21], as well as when the metals were alloyed and heat treated [22]. In the literature, not surprisingly given the above observations, although many mathematical models of sliding have been proposed, there is little agreement on the development of a universal wear equation which would be widely applicable [23-27].
The development of wear maps is a useful way to study and predict the wear behaviour of one material sliding against another at different sliding speeds and normal loads. Wear mechanism maps proposed by Lim and Ashby [33-34], delineate clear boundaries for wear regimes based on sliding speed and normal load. Extensive experimental data on sliding wear of steel was assembled by Lim and Ashby [33-34], in order to generate such diagrams. On such maps, the evidence for frictional heating which leads to oxidation was presented, and thus the scenario where oxide scales, several microns thick on metallic surfaces, form in the sliding contact was presented and clarified. Such oxide films can also act as solid lubricant, as discussed above, and prevent further metal-metal contact and this was confirmed by the low contours of wear rate on such maps in this regime. Quinn [35-37] introduced the oxidative wear model based on the flash temperature concept. According to his model, mild-oxidative wear occurs as long as an oxide film can protect the contacting surfaces and severe-oxidative wear persists only if the rate of oxide removal exceeds the rate of their formation. This analysis was further developed by Jiang, Stack and Stott, [4], who developed a model for oxidative – wear transitions based on communition of oxide particles formed in the tribological contact.
Despite such studies above, there have been few investigations carried out of the wear mechanism map for both components of the tribological contact, i.e. the pin and disk. This work addresses this issue, by investigating the sliding wear mechanisms of both pin and disc of steels of different hardness and oxidation resistance. The differences in the maps are discussed with reference to the change in oxidative wear mechanisms for both pin and disc material.
2. Experimental details
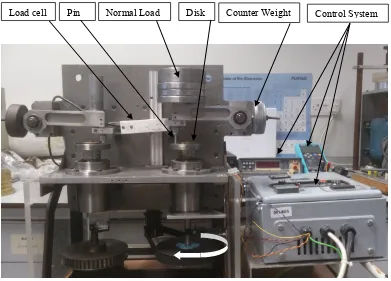
Fig.1 Pin-On-Disk Tribometer (sliding wear testing rig)
2.1. Materials
2.1.1. Chemical composition of 303 stainless steel disk and 8620 low alloy steel pin materials Table 1 shows the chemical compositions of the 303stainless steel 8620 low alloy steel. The chemical compositions of these materials were identified using Fluorescence Spectrometer (XRF).
Table 1
The chemical composition of the 303 stainless steel disk and 8620 low alloy steel pin materials
Element wt. % 303 stainless steel disk 8620 low alloy steel
Ti 0.2 %
V 0.21 %
Cr 18.7 %
Mn 1.44 % 0.5 %
Fe 71.1 % 97.9 %
Co 0.25 %
Ni 7.76 % 0.52 %
Cu 0.19 % 0.13 %
Ag 0.1 % 0.11 %
Control System Counter Weight
Normal Load
[image:4.595.70.532.593.758.2]Mo 0.06 % 0.01 %
Al 0.77 %
2.2 Hardness
The hardness values of the materials were as follows.
For 303stainless steel and for 8620 low alloy steel, the HV values were 167HV10 and 207HV10 respectively.
3. Experimental results
[image:5.595.69.548.418.553.2]3.1 Dry sliding wear tests results of 303SS disks against 8620 low alloy steel
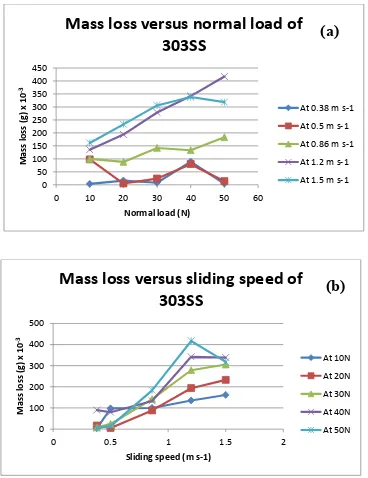
Table 2 and Fig. 2 shows the mass loss of 303SS disks against 8620 low alloy steel pins and data plots of the graphs of mass loss of 303SS disks against 8620 low alloy steel pin following dry sliding. Here Fig. 2(a) indicates the results at different constant sliding speeds and variable normal loads and Fig. 2(b) the results at different constant normal loads and variable sliding speeds.
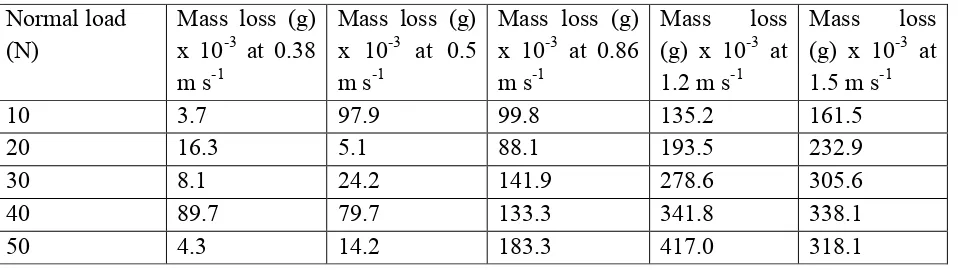
Table 2: Mass loss of 303 stainless steel disks against 8620 low alloy steel pins
Normal load (N)
Mass loss (g) x 10-3 at 0.38 m s-1
Mass loss (g) x 10-3 at 0.5 m s-1
Mass loss (g) x 10-3 at 0.86 m s-1
Mass loss (g) x 10-3 at 1.2 m s-1
Mass loss (g) x 10-3 at 1.5 m s-1
10 3.7 97.9 99.8 135.2 161.5
20 16.3 5.1 88.1 193.5 232.9
30 8.1 24.2 141.9 278.6 305.6
40 89.7 79.7 133.3 341.8 338.1
Fig.2. a) Mass loss vs normal load of 303 stainless steel disk against 8620 low alloy steel pin and b) mass loss
vs sliding speed of 303 stainless steel disk against 8620 low alloy steel pin
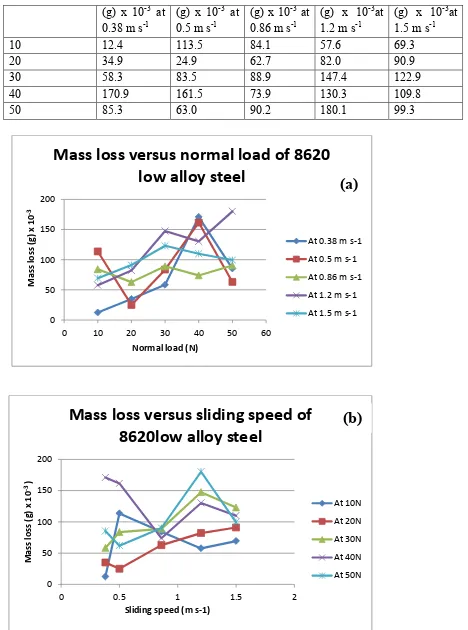
Table 3 and Fig. 3 show the mass loss of 8620 low alloy steel pins against 303SS disks and the data plots on the graphs of mass loss of 8620 low alloy steel pins against 303SS disks following dry sliding wear, Fig. 3(a) at different constant sliding speeds and variable normal loads and Fig. 2(b) at different constant normal loads and variable sliding speeds.
Table 3: Mass loss of 8620 low alloy steel pins against 303 stainless steel disks
Normal load (N) Mass loss Mass loss Mass loss Mass loss Mass loss 0
50 100 150 200 250 300 350 400 450
0 10 20 30 40 50 60
M
ass l
o
ss
(g) x
10
-3
Normal load (N)
Mass loss versus normal load of
303SS
At 0.38 m s-1
At 0.5 m s-1
At 0.86 m s-1
At 1.2 m s-1
At 1.5 m s-1
0 100 200 300 400 500
0 0.5 1 1.5 2
M
ass l
o
ss
(g) x
10
-3
Sliding speed (m s-1)
Mass loss versus sliding speed of
303SS
At 10N
At 20N
At 30N
At 40N
At 50N
(a)
[image:6.595.71.439.68.546.2](g) x 10-3 at 0.38 m s-1
(g) x 10-3 at 0.5 m s-1
(g) x 10-3 at 0.86 m s-1
(g) x 10-3at 1.2 m s-1
(g) x 10-3at 1.5 m s-1
10 12.4 113.5 84.1 57.6 69.3
20 34.9 24.9 62.7 82.0 90.9
30 58.3 83.5 88.9 147.4 122.9
40 170.9 161.5 73.9 130.3 109.8
50 85.3 63.0 90.2 180.1 99.3
Fig. 3. a) Mass loss vs. normal load 8620 low alloy steel against 303 stainless steel pin, b) mass loss vs normal
load of 8620low alloy steel against 303 stainless steel
0 50 100 150 200
0 10 20 30 40 50 60
M ass l o ss (g) x 10 -3
Normal load (N)
Mass loss versus normal load of 8620
low alloy steel
At 0.38 m s-1
At 0.5 m s-1
At 0.86 m s-1
At 1.2 m s-1
At 1.5 m s-1
0 50 100 150 200
0 0.5 1 1.5 2
M ass l o ss (g ) x 10
-3 )
Sliding speed (m s-1)
Mass loss versus sliding speed of
8620low alloy steel
[image:7.595.63.531.67.697.2]3.2. Total mass loss comparison
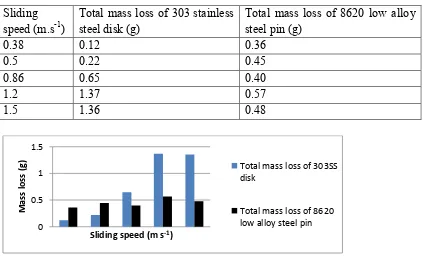
[image:8.595.69.492.220.480.2]Table 4 shows the total mass loss (on the average bases for the repeated tests) of the 303 stainless steel disk and 8620 low alloy steel pin at each constant sliding speed for the range of normal loads i.e. at variable loads from 10 to 50 N, and increasing in 10 N increments for the total sliding distance 28700m.
Table 4: The Total mass loss of 303 stainless steel disk (g) and 8620 low alloy steel pin (g) for the 28700m total
sliding distance
Sliding
speed (m.s-1)
Total mass loss of 303 stainless steel disk (g)
Total mass loss of 8620 low alloy steel pin (g)
0.38 0.12 0.36
0.5 0.22 0.45
0.86 0.65 0.40
1.2 1.37 0.57
1.5 1.36 0.48
[image:8.595.327.560.633.803.2]
Fig. 4. The total mass loss comparison of 303 stainless steel disk and 8620 low alloy steel pin
3.3. SEM micrographs and EDAX results
Fig. 5 shows the SEM micrographs of the wear tracks on the 303SS disks against 8620 low alloy steel pins at 0.38 and 0.5 m s-1 sliding speeds and 50N normal load. EDX analysis, Fig. 6, shows the wear tracks on the 303SS disks against 8620 low alloy steel pins at 0.38 and 0.5 m s-1 sliding speeds and 50N normal load.
0 0.5 1 1.5
M
ass l
o
ss
(g)
Sliding speed (m s-1)
Total mass loss of 303SS disk
Total mass loss of 8620 low alloy steel pin
[image:8.595.58.296.633.801.2]Fig. 5. SEM micrographsof the wear track a) at 0.38 m s-1 sliding speed and 50N normal load and b) at 0.5 m s-1
[image:9.595.60.550.109.272.2]sliding speed and 50N normal load
Fig. 6. EDX analysisthe wear track a) at 0.38 m s-1 sliding speed and 50N normal load and b) at 0.5 m s-1 sliding
[image:9.595.41.554.337.795.2]speed and 50N normal load
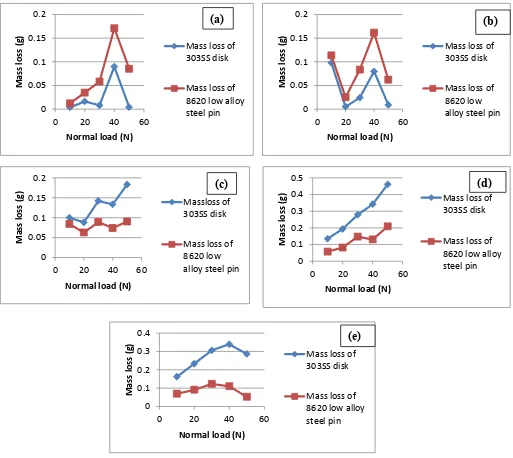
Fig. 7 shows the wear behaviour of 303SS disks and 8620 low alloy steel pins for the range of sliding speeds and normal loads
(b) (a) 0 0.05 0.1 0.15 0.2
0 20 40 60
M as s l oss (g )
Normal load (N)
Mass loss of 303SS disk
Mass loss of 8620 low alloy steel pin (a) 0 0.05 0.1 0.15 0.2
0 20 40 60
M
ass l
o
ss
(g)
Normal load (N)
Mass loss of 303SS disk
Mass loss of 8620 low alloy steel pin
(b) 0 0.05 0.1 0.15 0.2
0 20 40 60
M
ass l
o
ss
(g)
Normal load (N)
Massloss of 303SS disk
Mass loss of 8620 low alloy steel pin
(c) 0 0.1 0.2 0.3 0.4 0.5
0 20 40 60
M
ass l
o
ss
(g)
Normal load (N)
Mass loss of 303SS disk
Mass loss of 8620 low alloy steel pin (d) 0 0.1 0.2 0.3 0.4
0 20 40 60
M
ass l
o
ss
(g)
Normal load (N)
Mass loss of 303SS disk
Mass loss of 8620 low alloy steel pin
Fig. 7 wear trends of 303SS disks and 8620 low alloy steel pins against each other a) at 0.38 m.s-1 for the range
of normal loads, b) at 0.5 m.s-1 for the range of normal loads, c) at 0.86 m.s-1 for the range of normal loads, d) at
1.2 m.s-1 for the range of normal loads, and e) at 1.5 m.s-1 for the range of normal loads
3.4. Wear behaviour of 303SS disks against 8620 low alloy steel pins
The dry sliding wear tests were successfully carried out on pin-on-disk tribometer at different combinations of sliding speeds and normal loads. The effects of change in wear behaviour of 303SS and 8620 low alloy steel were observed with respect sliding speed and normal loads. At the end of each sliding tests worn surfaces of the disk and pin were checked carefully to decide the wear mode regimes. The mild wear results in dark and smooth worn surfaces, lower mass loss and dark powdery wear debris at the end of test due to oxidation during sliding of mating surfaces. That was confirmed by SEM micrographs and EDX analysis of the worn surfaces. On the other hand bright, rougher worn surfaces and larger metallic wear debris at the end of sliding tests and high mass losses results in medium wear and severe wear. The mass loss of 8620 low alloy steel was greater than 303SS at 0.38 & 0.5 m.s-1 sliding speeds Fig. 7(a & b) whereas it changed to lower than 303SS at 0.86 to 1.5 m.s-1 sliding speeds Fig. 7(c to e), indicating a change in regime with increasing speed. The fluctuation in mass loss of the tribo couple possibly occurred due strain hardening or thermal softening and oxidation of the mating surfaces during dry sliding against each other.
For the 303 stainless steel disk, at a sliding speed of 0.38 m.s-1, for normal loads from 10 to 30 and 50N, mild wear was observed while at 40N medium (mixed) wear was found i.e. transitions of wear regime occurred at 40N and 50N normal load, Table-2 & Fig. 2(a). For the 8620 low alloy steel pin, the wear mode transitions shifted to lower velocities, with mild wear observed at 10 and 20N, medium (mixed) wear at 30 and 50N and severe wear at 40N normal load, table-3 & Fig. 3(a). From the SEM micrographs and EDAX analysis, Fig.5-6, it was observed that a protective oxide layer formed on wear track, resulting in mild wear predominating for the disk material at 10 to 30 and 50N normal loads. At the end of the tests, for these conditions, a dark and smooth wear track surface was observed, indicative of a mild wear regime.
At 0.86m.s-1 sliding speed, a change in wear trend occurred for both the 303 stainless steel disk and 8620 low alloy steel pin:
1- For the 303 stainless steel disk, medium wear was observed from 10 to 40N normal loads whereas severe wear was found at 50N normal load.
2- For the 8620 low alloy steel pin, medium wear was found at all normal loads.
3- At 0.38 & 0.5ms-1 sliding speed, the wear of 8620 low alloy steel pin was higher than the 303 stainless steel disk whereas this reversed at 0.86 ms-1, & Fig. 3(b).
At 1.2m.s-1 sliding speed, there was increased wear for all normal loads i.e. severe wear except 10N normal loads for the 303 stainless steel disk while the wear of 8620 low alloy steel pin was mainly in the medium mode at 10 to 40N loads, with severe wear observed at 50 N normal load, Table -2 & 3 and Fig. 2(a) & 3(a). At 50N normal load, the 8620 low alloy steel pin exhibited severe wear.
At 1.5m.s-1 sliding speed, severe wear was found for the 303 stainless steel disk and medium wear for the 8620 low alloy steel pin for the range of normal loads. At 50N normal load, the steel pin exhibited severe wear. Though the 8620 low alloy steel is harder than 303stainless steel, it was observed that at sliding speeds of 0.38 and 0.5m.s-1, higher wear rates of the steel pin were observed. However, by contrast, from 0.86 to 1.5m.s-1 sliding speed, the wear rate of 303 stainless steel disk was greater than the 8620 low alloy steel pin. Hence, the relative wear rates of both steel pin and disk depended on the normal load and sliding velocities. This is discussed further below.
4. Discussion
4.1. Wear Mechanisms
It is clear from the results above, Table 2 & Fig. 2, and from Table 3 & Fig.3, that the wear of both materials varies with increases in normal load and sliding speed. Moreover it is also observed that the wear rates for the range of sliding speed and normal load show sharp transitions and a non-linear trend with respect to the changes in load and speed. The inverse linear relationship with respect to hardness was also found to break down at low loads and high speeds [21]. This behaviour is also noted by Hirst and Lancaster for brass [42], and for steel i.e. Saka et al. [43], Welsh [49], and is attributed to a competition between strain hardening and thermal softening that may occur simultaneously at the surface of the material as sliding speed increases [41]. Similarly, it can be postulated that in the case of the 303 stainless steel and 8620 low alloy steel, strain hardening effects may result in a reduction in wear, and softening of surface layers as a result of frictional heating also interacts with such mechanisms.
effect of mechanical mixing. During continued sliding, the initial transferred fragments are deformed, fractured and blended, leading to formation of mechanically mixed material on the sliding surfaces. Typical sliding wear debris particles come from this modified material [51]. The transferred layer became oxidized due to frictional heating and wear process consisted of three stages: transfer of metal, oxidation of transferred layer, and the subsequent removal of the oxide to form a loose wear-product [52]. The hardness of the mechanically mixed material (MML) can be greater or less than that of the underlying substrate, and this directly determines whether it forms a compressed layer or remains as patches or plateaus on the surface. The mechanically mixed material can have a wide range of hardness values, depending on the volume fraction of component phases and on the grain size. The material can also be heterogeneous, especially early in the mixing process, so its hardness can vary locally, [23]. It was also found by M. Kerridge that the hardness of the annealed steel pin rubbing against a hardened steel ring was considerably harder than the original pin material and this may be due to the intense, localized, thermal effects which, as is well known, accompany rubbing under unlubricated conditions [52]. In earlier studies by Welsh [49], similar shifts in transitions to the above were observed, but this time also, with steel carbon content which affected the relative hardness values.
For sliding wear, some analogies may be made between the effects of increasing applied load and sliding velocity on the material surface. Increases in either parameter increase the level of frictional heating on the surface; in such cases, if the material undergoing sliding is metallic in nature, e.g. steel, then the oxidation rate on the surface will increase. As a result, the wear increases initially with increasing velocity or applied load through an oxidation-wear process, at higher velocities or loads, when frictional heating results in higher flash contact temperatures [46]. At the end of the tests, for these conditions, a dark and smooth wear track surface is observed, indicative of a mild wear regime, and the bright and rougher wear track surface demonstrating severe wear is consistent with earlier studies and consistent with reports from other work [28-29, 39 and 40].
In the sliding pair above, the 303 stainless steel is significantly more oxidation resistant due to the high Cr content, with Cr additions essentially lowering the oxidation rate due to the fact that the parabolic growth rate of Cr based oxides is significantly lower than that for Fe based oxides and this is reflected in different transitions as has been found for alloys of varying Cr content in erosion-oxidation [47]. This means that there will be less oxide scale likely to form at the contact and less available film and thickness to provide a solid lubricant or an oxide “glaze”, observed in other work [4], to protect the surface from further wear, in the more highly alloyed material, the 303 stainless steel.
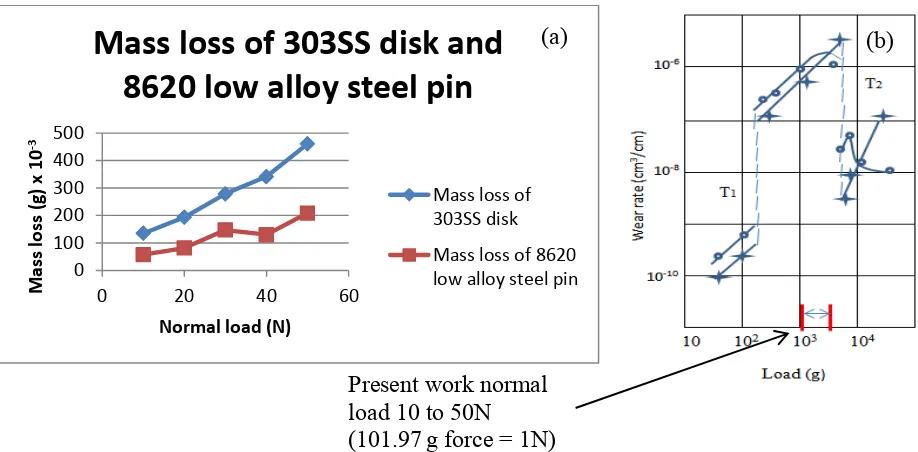
rate with load for the 0.52 % C steel, sliding at a speed of 100cm.s-1, [19]. To correlate the present work with that of Welsh work [19&49], Fig. 8(a), a plot of the 303 stainless steel disk sliding against 8620 low alloy steel pin at 1.2m.s-1 sliding speed and 10 to 50N normal load is taken from Fig. 7 i.e. Fig. 7(d) from the present work is selected for comparison. The range of normal load of the present work covers the highlighted portion on X-axis of the data plot [19], Fig. 8(b). The trend of wear observed in the present work is thus seems to be in agreement with the earlier work [19&49] for the range of sliding speed and normal load of the present work.
Fig. 8. a) Mass loss of 303SS disk and 8620 low alloy steel pin against each other at 1.2m.s-1 sliding speed and
10 to 50N normal load, from the present work, and b) wear rate plotted against load for the 0.52 % C steel at sliding speed 100cm s-1 (1m s-1) and 50g to 25Kg (0.5N to 250N) load, x, for pin.; o, for ring, from [19].
The transition loads vary widely with the sliding speed, composition and hardness of the steel; if these factors are selected arbitrarily one or more transitions may not appear within the range of load investigated and this is also observed in the later erosion-oxidation research [4]. An increase of sliding speed lowers all the transition loads and, for a fixed load, there must be critical values of speed at which equivalent changes in the wear rate occur [19]. Fig. 9(b) shows the wear rates of 0.52% C steel at 1 & 5Kg loads plotted as function of speed taken from the earlier Welsh work [19]. Fig. 10 shows the variation of wear rate with sliding speed of brass sliding against steel at 20oC in air taken from Lancaster [50]. It is clear from the Fig. 9(b) and Fig. 10 that wear rate is increasing with sliding speed and there is sudden transition in wear mode i.e. from severe wear to mild wear, for a metal pair in sliding contact, at higher speeds.
It should be noted that in the present work, the ranges of sliding speed and normal load are very narrow compared to those for the Welsh [19 & 49] and Lancaster [50] work, but nevertheless, the present studies can be correlated with their work for these ranges. A further
0 100 200 300 400 500
0 20 40 60
M
ass l
o
ss
(g) x
10
-3
Normal load (N)
Mass loss of 303SS disk and
8620 low alloy steel pin
Mass loss of 303SS disk
Mass loss of 8620 low alloy steel pin (a)
Present work normal load 10 to 50N (101.97g force = 1N)
[image:13.595.82.541.228.454.2]comparison between the present study and that of Welsh [19 & 49] can be made, with the range of the sliding speed of the present work. Fig. 9(a) indicates a plot of mass loss of 303SS against 8620 low alloy steel at 10 and 50 N normal loads as a function of sliding speed taken from Fig. 2(b), with the range of conditions of the present work highlighted on the X-axis of Welsh data plot Fig. 9(b). The wear trends are similar i.e. wear is increasing with the increase in sliding speed. The transition in wear mode of the 303 stainless steel disk against 8620 low alloy steel pin i.e. from severe wear toward mild wear at 50N normal load with increase in sliding speed is in agreement with the Welsh work [19 & 49]. Similarly the present work can be correlated with the Lancaster work [50] for the range of sliding speed Fig. 9(a) and Fig. 10, albeit that the 303 stainless steel has a higher Cr content than for the Welsh studies [49].
Fig. 9 a) The comparison of change of wear trend of 303 stainless steel disk against 8620 low alloy steel pin at
[image:14.595.79.555.260.470.2]constant normal load 10 and 50N in the range of sliding speed i.e. 0.38 to 1.5m.s-1 taken from Fig. 2(b) above, and b) the trend of change of wear rate with sliding speed for the 0.52 % C steel. Loads: x, 1Kg (10N equivalent) and ●, 5Kg (50N equivalent), from [19]
Fig. 10 Variation in wear rate of brass with increase in sliding speeds against steel at 20oC in air [50].
0 200 400 600
0 0.5 1 1.5 2
M
ass l
o
ss
(g) x
10
-3
Sliding speed (m.s-1)
Mass loss of 303SS at constant
normal load
Mass loss at 10N
Mass loss at 50N (a)
Sliding speed range of present work
Sliding speed range of the present work
[image:14.595.144.535.546.701.2]It should be noted that for the two materials, the role of oxidation in modifying the wear rate will be significant. As discussed above, the high Cr content of the 303 stainless steel means that the instantaneous oxidation rate, at the contact, will be significantly lower than for the low alloy steel [4]. This means that there is less possibility of establishing a wear resistant oxide layer for the higher alloyed material and may be the reason why higher wear rates are observed for the Cr content material at higher speeds.
4.2. Wear regimes and wear maps
The development of wear maps is a useful way to study and predict the wear behaviour of one material sliding against each other at different sliding speeds and normal loads. The generalized classification of mass loss into three distinct regimes, mild, medium and severe wear are found in literature [28-29, 39 & 40]. In the present work the wear mode regimes, namely (a) mild wear (b) medium wear and (c) severe wear were defined consistent with previous research work found in literature [32, 41], tests results, mass loss data, physical observations of the worn surfaces, SEM and EDX of the worn surfaces and wear debris at the end of the test.
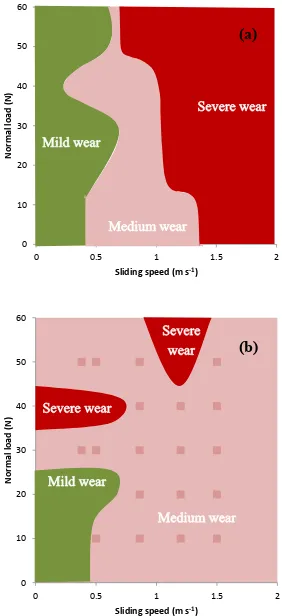
The various wear mode regimes were identified for the 303 stainless steel disk and 8620 low alloy steel pin, as a function of sliding speed and normal load, showing distinctive differences in the wear mode regimes transitions, as addressed above Fig. 2 & 3. Furthermore, if such regimes are presented in a wear mode map, Fig. 11, it can be clearly seen that severe wear is more prevalent in the relatively high load and speed regimes, for the more highly alloyed material, 303 stainless steel, whereas for the 8620 low alloy steel, medium wear is more dominant than mild wear at low speeds and high loads. More over in Fig. 11(a-b) the mild wear regions can be regarded as the safe operation regime for these materials for practical applications. The boundary line of this regime represents the upper limit of the service life of 303 stainless steel against 8620 low alloy steel and vice versa [41]. The boundaries of the wear mode regimes:
a) Mild wear ≤ 0.05g
Fig. 11. Wear mode map a) 303stainless steel disk against 8620 low alloy steel pin and b) 8620 low alloy steel pin against 303stainless steel
0 10 20 30 40 50 60
0 0.5 1 1.5 2
N
o
rm
al
lo
ad
(
N
)
Sliding speed (m s-1)
0 10 20 30 40 50 60
0 0.5 1 1.5 2
N
o
rm
al
lo
ad
(
N
)
Sliding speed (m s-1)
(a)
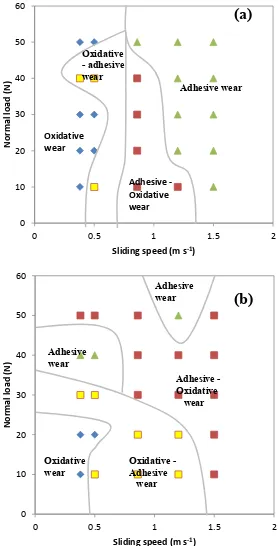
Fig. 12 shows the wear mechanism map for 303SS and 8620 low alloy steel. The wear mechanism regimes suggested are as follows, are based on the experimental results and observations above. For both tribological components of the couple, it is clear that oxidative wear is more prevalent for the low alloy steel at high loads and low sliding speeds and adhesive wear is more predominant for the high Cr containing steel, in the same load regime.
0 10 20 30 40 50 60
0 0.5 1 1.5 2
N o rm al lo ad ( N )
Sliding speed (m s-1)
0 10 20 30 40 50 60
0 0.5 1 1.5 2
N o rm al lo ad ( N )
Sliding speed (m s-1)
[image:17.595.84.362.183.729.2]Fig. 12. Wear mechanism map a) 303 stainless steel disk against 8620 low alloy steel pin „normal load vs sliding speed‟and b) 8620 low alloy steel pin against 303303 stainless steel disk „normal load vs sliding speed‟
Oxidative wear
Oxidative – adhesive
Adhesive – oxidative
Adhesive wear
4.3 Links between Lim and Ashby [33] wear diagram and present work
[image:18.595.21.464.439.725.2]The Lim and Ashby approach, Fig. 13, is based on a wide data base, of published wear rates, and providing a mathematical basis for charting the transition between regimes. This wear map assigned different regimes where wear occurred through different mechanisms [33]. The primary data is derived from dry sliding wear, pin-on-disk experiments, from the literature and plotted on a diagram. These data are plotted based on dimensionless parameters i.e. normalised wear rate on axes of normalized sliding velocity and normal force. The results suggest that data from various sources, using specimens of differing shapes and sizes, can best be correlated by using a normalised wear rate, force and sliding velocity [33].
Fig. 13 shows the redrawn Lim and Ashby wear-mechanism map. To correlate present work with the Lim and Ashby wear-mechanism map, wear rate, normal load and sliding speed of the present work were converted to normalised value.
SLIDING VELOCITY (m s
-1)
10-2 1 10+2 10+6
Seizure Steel wear mechanism map pin-on-disk configuration
Melt wear
Severe oxidational wear Mild
oxidation wear
Delamination wear
Mild to severe wear transition
Ultra mild wear
10-4 10-2 1 10+2
10-5 10-3 10-1
NORMALISED PRESSURE P*
Fig. 13 Wear-mechanism map for a steel sliding pair using the pin-on-disk configuration [33].
By normalising normal loads and sliding speeds as per [33], the normalising ranges of the present work as below:
Sliding speed 0.38 – 1.5m.s-1 converted to 1.25 x 10² – 4.95 x 10²
Normal load (force) 10 – 50N converted to 5.80 x 10⁻⁴ – 2.9 x 10⁻³
Note: For these conversions, the diameter of the pin = 6mm, Hardness 190HV (average hardness of the 303 stainless steel disk and 8620 low alloy steel pin), Thermal diffusivity = 9.1 x 10⁻⁶ m2.s-1 has been used.
The highlighted area of the Fig. 13 shows the boundaries of the field studied by the present work. The window of conditions in the present work represents mild-oxidative wear i.e. oxidation-affected wear. Hence, the work above focuses on the various transitions over a small window of the wear map above, where oxidation interacts with wear and thus the findings of the present work can be compared to those of Lim and Ashby wear maps for steels [33, 44 and 45]. (This confirms that the wear maps for more highly alloyed materials such as stainless steel, as examined in the present study, involves a larger adhesive wear portion of the map, Fig. 12(a), compared to the original maps for low alloy steel [33] and this is consistent with improved oxidation resistance due to the increased levels of Cr in the higher alloyed steel.
Hence, the results from the current study indicate by mapping the transitions of both pin and disk, an important overview can be generated of mechanistic changes on both the pin and disk in the tribological contact. This provides further insights into wear mechanism changes as a function of increases of alloying additions. Further work will be to investigate how lubrication and coated materials can shift these tribo-oxidation transitions further on such diagrams.
5. Conclusions
• Dry sliding tests have been conducted for two steels, with differing oxidation resistance i.e. Cr content and hardness levels.
• Wear maps have been constructed based on tests of effects of sliding speed and load and significant differences were observed for maps generated for the pin and disk materials.
• The differences of the tribo-oxidation area of the map for the stainless steel compared with the low alloy steel are attributed to the role of Cr in reducing the oxidative wear process for the latter material.
References:
[1] M. A. Chowdhury , M. K. Khalil, D. M. Nuruzzaman, M. L. Rahaman, The effect of sliding speed and normal load on friction and wear property of aluminium, International Journal of Mechanical Mechatronics Engineering IJMME-IJENS Vol. 11 No: 01, Pages 53-57.
[2] H. A. Abdel- Aal, On the interdependence between kinetics of friction-released thermal energy and transition in wear mechanisms during sliding of metallic pairs, Wear 254 (2003), Pages 884-900.
[3] N. Chelliah, S. V. Kailas, Synergy between tribo-oxidation and strain rate response on governing the dry sliding wear behaviour of titanium, Wear 266 (2009), Pages 704-712.
[4] M. M. Stack, J. Jiang, F.H. Stott, A generic model for dry sliding wear of metals at elevated temperatures, Wear, Vol. 256, Issues 9-10, May 2004, Pages 973-985.
[5] M. M. Stack, J. Jiang, F.H. Stott, Some frictional features associated with sliding wear of the nickle-base alloy N80A at temperature to 250 oC, Wear 176 (1994), Pages 185-194.
[6] J. Jiang, F. H. Stott and M. M. Stack, The role of triboparticulates in dry sliding wear, Tribology International 31, (1998), Pages 245-256.
[7] J. F. Archard and W. Hirst, The wear of metals under unlubricated conditions, Proc. R. Soc., Lond. A, 236 (1956), Pages 397-410.
[8] J. K. Lancaster, The formation of surface films at the transition between mild and severe metallic wear, Proc. R. Soc., Lond. A, 273 (1963), Pages 466-483.
[9] N. C. Welsh, The dry wear of steels II. Interpretation and special features, Phil. Trans. R. Soc., Lond. A, 257 (1965), Pages 51-70.
[10] T.S. Eyre, D. Maynard, Surface aspects of unlubricated metal-metal wear, Wear, 18 (1971), Pages 301-310.
[11] F. H. Stott, J. Glascott and G. C. Wood, The sliding wear of commercial Fe-12SgoCr alloys at high temperature, Wear, 101 (1985), Pages 311-324.
atmosphere – the effect of adding low concentrations of O2, Wear, 112 (1986), Pages 291-325.
[13] F. H. Stott, D. S. Lin, G. C. Wood, G. W. Stevenson, The tribological behaviour of nickel and nickel-chromium alloys at temperatures from 20o to 800oC, Wear, 36 (1976), Pages 147-174.
[14] A.F. Smith, The unlubricated reciprocating sliding wear of 316 stainless steel in CO2 at 20-600 , Tribology International, 19 (1986), Pages 65-71.
[15] F. H. Stott, J. Glascott and G. C. Wood, Model for the generation of oxides during sliding wear, Proc. R. Soc., Lond. A, 402 (1985), Pages 167-186.
[16] Y. Tsuyu, Microstructure of wear, friction and solid lubrication, Tech. rep. of Mech. Eng. Lab., Japan, vol.3, no. 81, 1975.
[17] Biswas, S. K., and Kailas, S. V., “Strain Rate Response and Wear of Metals,” Tribol. Int. 30 (1997), Pages 369–375.
[18] W. Hirst and J. K. Lancaster J. Appl. Phys. 1956, 27, 1057.
[19] N. C. Welsh, The dry wear of steels, Trans. Roy. Soc. London. 1965, Vol. 257.A. 1077.
[20] A. Somi Reddy, B.N. PramilaBai., K.S.S. Murty and S.K. Biswas, Wear and seizure of binary alloys, Wear, 1994, 171, Pages 115-127.
[21] J K Lancaster, Material-specific wear mechanisms: relevance to wear modelling, Wear, 141, Issue 1, December 1990, Pages 159-183.
[22] M. M. Kruschchov, proc. Conf. on Lubrication and Wear, Inst. of Mech. Eng., London, 1957. Page 655.
[23] D. A. Rigney, Comments on the sliding wear of metals, Tribology International, 30 (1997), Pages 361-367.
[24] M. M. Khruschev, Cited in Kragelskii I.V. Friction and wear, transl. by L. Ronson and J. K Lancaster, Butterworths, London, 1965.
[25] J. F. Archard, Contact and rubbing of flat surfaces, J. Appl. Phys. 1953, 24, Pages 981-988.
[26] D. A. Rigney, The roles of hardness in the sliding behaviour of materials, Wear, 175 (1994), Pages 63-69.
[27] D. A. Rigney, Some thoughts on sliding wear, Wear 1992, 152, Pages 187-192.
[28] J.F. Archard, W. Hirst, The wear of metals under unlubricated conditions, Proc. Roy. Soc. London. A 236 (1956), Pages 397-410.
(1957),Pages 515-528.
[30] C.C. Viafara, A. Sinatora, Influence of hardness of the harder body on wear regime transition in a sliding Pair of steels, Wear 267 (2009), Pages 425-432.
[31] T.S. Eyre, D. Maynard, Surface aspects of unlubricated metal-metal wear, Wear, 18 (1971), Pages 301-310.
[32] . . Smith, The sliding wear of 316 stainless steel in air in the temperature range 20-500 ,Tribology International, 18 (1985), Pages 35-43.
[33] S. C. Lim, M.F. Ashby, Overview no. 55 wear-mechanism maps, ActaMetallurgica, 35(1987), Pages 1-24.
[34] M. M. Stack , Mapping tribo-corrosion processes in dry and in aqueous conditions: some new directions for the new millennium, Tribology International, Vol. 35 (2002), Pages 681-689.
[35] T.F.J. Quinn, Oxidational wear, Wear, 18 (1971), Pages 413-419.
[36] T.F.J. Quinn, D.M. Rowson, J.L. Sullivan, Application of the oxidational theory of mild wear to The sliding wear of low alloy steel Wear, 1980, 65, Pages. 1-20.
[37] T.F.J. Quinn, Review of oxidational wear – Part 1. The origins of oxidational wear, Tribology International, 1983, 16, Pages 257-271.
[38] S. Bahadur, Chien – Nan Yang, Friction and wear behavior of tungsten and titanium carbide coatings, Wear, 196 (1996), Pages 156-163.
[39] J.T. Burwell, C.D. Strang, on the empirical law of adhesive wear, J. Appl. Phys., 23 (1952) Pages18-28.
[40] C.C. Viafara, M.I. Castro, J.M. Velez, A. Toro, Unlubricated sliding wear of pearlitic and bainitic steels Wear, 259 (2005), Pages 405-411.
[41] J. Zhang and A. T. Alpas, Transition between mild and severe wear in aluminium alloys, Acta Mater, 45 (1997), Pages 513-528.
[42] W. Hirst and J. K. Lancaster, Proc. R. Soc. Lond. A 6 December 1960 vol. 259 no. 1297, Pages 228-241.
[43] N. Saka, A.M. Eleiche and N. P. Suh, Wear 44, 109 (1977).
[44] S. C. Lim, M. F. Ashby and J. H. Brunton, Wear-rate transitions and their relation to wear mechanism, Acta metal. Vol. 35, No. 6, Pages 1343-1348, 1987.
[46] M. M. Stack, Bridging the gap between tribology and corrosion: from wear maps to Pourbaix diagrams, International Materials Reviews 2005 Vol. 50 No. 1, Pages 1-17.
[47] M. M. Stack, F H Stott and G C Wood, The effect of pre-oxidation of chromia and alumina forming alloys on erosion in laboratory simulated fluidized-bed conditions , Corrosion Science 1992, 33, Vol. 6. Pages 965-983.
[48] K. H. Zum Gahr, Sliding wear of ceramic- ceramic, ceramic-steel and steel-steel pairs in lubricated and unlubricated contact, Wear, 133 (1989), Pages 1-22.
[49] N. C. Welsh: Philos. Trans. R. Soc. Lond., 1965, 257A, Pages 51-70.
[50] J. K. Lancaster: Proc. R. Soc. Lond. 1963, 273A, Pages 466-483.
[51] L. H. Chen, D.A. Rigney, Adhesion theories of transfer and wear during sliding of metals, Wear, 136 (190), Pages 223-235.
[52] M. Kerridge, Metal transfer and the wear process, Proc. R. Soc. London, Sect.
B(2nd edn.), Pages 400-407.
List of tables:
Table 1. Chemical composition of the 303 stainless steel disk and 8620 low alloy steel pin materials
Table 2. Mass loss of 303 stainless steel disk at different constant sliding speed and various normal
loads against 8620 low alloy steel
Table 3. Mass loss of 8620 low alloy steel pin at constant sliding speed and various normal loads against 303SS disk
List of figures
Fig. 1. Pin-on-Disk tribometer (sliding wear test rig)
Fig.2. a) Mass loss vs normal load of 303 stainless steel disk against 8620 low alloy steel pin and b) mass loss vs sliding speed of 303 stainless steel disk against 8620 low alloy steel pin
Fig. 3. a) Mass loss vs. normal load 8620 low alloy steel against 303 stainless steel pin, b) mass loss vs normal load of 8620low alloy steel against 303 stainless steel
Fig. 4. The total mass loss comparison of 303 stainless steel disk and 8620 low alloy steel pin
Fig. 5. SEM micrograph of 303SS disk a) at 0.38m/s sliding speed and 50N normal load and b) at
0.5m/s sliding speed and 50N normal load
Fig. 6. EDX analysis of 303SS disk a) at 0.38m/s sliding speed and 50N normal load and b) at 0.5m/s sliding speed and 50N normal load
Fig. 7 wear trends of 303SS disks and 8620 low alloy steel pins against each other a) at 0.38 m.s-1 for
the range of normal loads, b) ) at 0.5 m.s-1 for the range of normal loads, c) ) at 0.86 m.s-1 for the
range of normal loads, d) at 1.2 m.s-1 for the range of normal loads, and e) ) at 1.5 m.s-1 for the range
of normal loads
Fig. 8. a) Mass loss of 303SS disk and 8620 low alloy steel pin against each other at 1.2m.s-1 sliding
speed and 10 to 50N normal load, from the present work, and b) wear rate plotted against load for the 0.52 % C steel at sliding speed 100cm.s-1 (1m. s-1) and 50g to 25Kg (0.5N to 250N) load, x, for pin.;
o, for ring, from [19].
Fig. 9. a)The comparison of change of wear trend of 303 stainless steel disk against 8620 low alloy steel pin at constant normal load 10 and 50N in the range of sliding speed i.e. 0.38 to 1.5m.s-1 taken
Fig. 10. Variation of wear rate with sliding speed of brass sliding against steel at 20oC in
air [50].
Fig. 11. Wear mode map a) 303 stainless steel disk against 8620 low alloy steel pin and b) 8620 low alloy steel pin against 303 stainless steel
Fig. 12. Wear mechanism map a) 303 stainless steel disk against 8620 low alloy steel pin „normal load vs sliding speed‟and b) 8620 low alloy steel pin against 303303 stainless steel disk „normal load vs sliding speed‟
![Fig. 10 Variation in wear rate of brass with increase in sliding speeds against steel at 20oC in air [50]](https://thumb-us.123doks.com/thumbv2/123dok_us/1647517.118271/14.595.79.555.260.470/fig-variation-wear-brass-increase-sliding-speeds-steel.webp)