City, University of London Institutional Repository
Citation
:
Banal-Estanol, A., Jofre-Bonet, M. and Meissner, C. (2008). The Impact of Industry Collaboration on Academic Research Output: A Dynamic Panel Data Analysis (08/14). London, UK: Department of Economics, City University London.This is the unspecified version of the paper.
This version of the publication may differ from the final published
version.
Permanent repository link:
http://openaccess.city.ac.uk/1588/Link to published version
:
08/14Copyright and reuse:
City Research Online aims to make research
outputs of City, University of London available to a wider audience.
Copyright and Moral Rights remain with the author(s) and/or copyright
holders. URLs from City Research Online may be freely distributed and
linked to.
City Research Online: http://openaccess.city.ac.uk/ [email protected]
Department of Economics
School of Social Sciences
The Impact of Industry Collaboration on Academic
Research Output: A Dynamic Panel Data Analysis
Albert Banal-Estañol
1City University
Mireia Jofre-Bonet
2City University
Cornelia Meissner
3City University
Department of Economics
Discussion Paper Series
No. 08/14
1Department of Economics, City University, Northampton Square, London, EC1V 0HB, UK. [email protected]
2 Department of Economics, City University, Northampton Square, London, EC1V 0HB, UK. [email protected]
The Impact of Industry Collaboration on Academic
Research Output: A Dynamic Panel Data Analysis
∗
Albert Banal-Estanol
Mireia Jofre-Bonet
Cornelia Meissner
†September 2008
Abstract
The aim of this paper is to analyse the impact of university knowledge and
technology transfer activities on academic research output. Specifically, we study
whether researchers with collaborative links with the private sector publish less
than their peers without such links, once controlling for other sources of
hetero-geneity. We report findings from a longitudinal dataset on researchers from two
engineering departments in the UK between 1985 until 2006. Our results indicate
that researchers with industrial links publish significantly more than their peers.
Academic productivity, though, is higher for low levels of industry involvement as
compared to high levels.
∗The authors express their gratitude to Dolores Añón Higón, Michael Ben-Gad, Ines Macho-Stadler,
Alistair McGuire, Gabriel Montes-Rojas, Markis Perkmann, Dan Peled and Jo Seldeslachts for helpful
comments and criticisms and the Engineering and Physical Sciences Research Council (EPSRC), the
National Science Foundation (NSF) and the European Patent Office (EPO) for providing the data. We
have also benefited from comments of seminar participants at City University, the University of Sheffield
and the XXIII Jornadas de Economia Industrial. Financial support from the Pump priming fund at City
University and ESRC research grant RES-000-22-2806 is gratefully acknowledged.
†All three authors are at the Department of Economics at the City University London. Address:
10 Northampton Square, London EC1V 0HB, UK. Tel. +44 (0) 20 7040 4576. E-mails:
1
Introduction
Universities and other public research institutions have witnessed in the last two decades
a push for greater industrial involvement and relevance in research (Tapper, 2007; Elton
1986). In the UK for instance, several policies in the 1990s directly aimed to favour
research relevant to “Technological Foresight” (DES, 1991; Tapper 2007). Universities
have also increasingly been encouraged to manage intellectual property (IP) to better
exploit their research (HM Treasury and DTI, 1998; Lambert, 2003; Lockett and Wright,
2005). Since then university patents together with license agreements and revenues have
increased dramatically.1
Many people have hailed the surge in university-industry collaboration and the
in-creased number of patents and licenses as a great bene…t to society (see e.g. UK National
Audit O¢ ce, 2002). Industry collaboration facilitates the transfer of basic knowledge and
accelerates the exploitation of new inventions. The …nancial bene…ts from contract
re-search, patents (through licenses and royalties) and spin-o¤ companies provide additional
sources of funding, which can be, for example, allocated to new research areas.
Other sources from inside universities as well as from the government, however, have
expressed concerns about the possible consequences of an increased emphasis on knowledge
and technology transfer (see Geuna and Nesta, 2007, for a review). Florida and Cohen
(1999) argue that industry collaboration and commercialisation might come at the expense
of research, or at least of basic research. Growing ties with the industry might be a¤ecting
the choice of research projects, “skewing” academic research from a basic towards an
applied approach. Nelkin (1984), among others, also alerts that the pressure for transfer
technology and knowledge might endanger the “intellectual commons” and the practices
of open science. Commercial development might delay or suppress scienti…c publication
1The Annual Survey on University Technology Transfer Activities, for example, revealed that the top
125 institutions in the US and Canada disclosed 2,238 new inventions and issued 347 new patents in
2002-03, representing an increase of 19 and 59 percent respectively on the previous year. The total licensing
income increased from £ 31.3m in 2003 to over £ 40m in 2004, with the number of licence agreements more
and dissemination of preliminary results.2
The …rst objective of this study is to analyse the impact of university-industry
collab-oration on research output in terms of productivity, quality and direction of research. We
exploit a longitudinal database containing individual demographic characteristics,
publi-cations, research funds and patents for all the researchers employed in the last 20 years in
the engineering departments of Imperial College London and City University of London.
Speci…cally, we study whether researchers with links with the industry, via coauthorships
or funding partnerships, publish more and more basic papers and in better journals than
their peers without such links. Our longitudinal sample also allows us to control for
observable and unobservable characteristics such as academic rank and cognitive ability
and obtain unbiased and consistent estimators of the impact of industry collaboration on
research output, taking into account potential reverse causality problems. With respect
to the direction of research, we estimate whether industrial collaboration has any impact
on the likelihood of publishing applied research.
Our second objective is to analyse further the relationship between patenting and
publication of research results. Speci…cally, we analyse whether patenting hinders or
delays publication of research outputs. Recent studies suggest instead that patenting has
a positive e¤ect on publication rates (Azoulay et al. 2008, Fabrizio and Di Minin, 2008).
This can be attributed to the fact that the same research stream may lead to publications
and yield patents or to the fact that the experience of patenting, licensing, and working
with the licensee to transfer technology may also prompt additional research questions.
Our dataset, which has information on industry collaboration and patents, should enable
us to separate the potential complementarities between patenting and publishing from
the e¤ects of collaborating with the industry.
The limited existing evidence that attempt to uncover the relationship between
in-dustry collaboration and academic output o¤ers mixed results. Goldfarb (2008) tracks a
2This debate has now reached society at large. Many public channels, including the BBC (through
the BBC Radio 4 programme ‘In Business’, October 13th 2005), The Guardian (August 5th, 2005 and
January 27th, 2007), The Observer (April 4th, 2004) and Nature (2007), have recently addressed the
sample of 221 American university researchers funded by the NASA in 1981. Based on a
follow-up of those in 1988, he concludes that researchers funded by the NASA experienced
a reduction in academic output. Other survey studies, though, show that more industry
links are associated with higher productivity. Gulbrandsen and Smeby (2002), for
exam-ple, show that professors with industrial funding in Norway report more publications than
their colleagues. Blumenthal et al. (1986), while con…rming the positive implications of
industry collaborations …rst, also points out that high levels of involvement can be
as-sociated with far lower levels of productivity. Larsen (2006), using data from a sample
of the Technical University of Denmark and Manjarrés et al. (2007), analysing research
activity at the University of Valencia, …nd a curvilinear, concave relationship between
collaboration with industry and quantity of articles published.
Several survey studies seem to suggest that growing ties with the industry might be
“skewing” academics research by inducing more ‘applied research’papers as opposed to
‘basic research’ones. Blumenthal et al. (1986) report that academics whose research is
supported by industry are four times more likely to report that their choice of research
topics has been a¤ected by their commercial potential. In Gulbrandsen and Smeby (2002),
researchers with funding from industry claim to perform signi…cantly less basic research
than researchers with no external funds or other types of external funds. On the other
hand, Thursby et al. (2005) and Banal-Estanol and Macho-Stadler (2007) have argued
that basic research might instead be reinforced by technology transfer objectives.
Ex-isting empirical evidence seems to indicate that the much-feared switch from basic to
applied research might indeed not be occurring. Using academic sta¤ data from six major
universities, Thursby and Thursby (2007) …nd no systematic change in the proportion of
publications in basic versus applied journals between 1983 and 1999. This corroborates
the results by Hicks and Hamilton (1999), which indicated that the percentage of basic
research that was performed at American universities remained unchanged between 1981
and 1995.
Despite the extensive interest in industry collaboration, most of the claims in either
longitudinal datasets. Most studies concentrate on small samples, making it di¢ cult to
infer the direction of causality between industry collaboration and research output, to
control for unobservable characteristics such as cognitive ability and to draw comparisons
across universities. Often, they also rely on questionnaire data or internal university
information and therefore face problems in response rate and data reliability. This is
especially the case for the UK where studies can be found only at an institutional level
(e.g. Geuna, 1997) or are limited to questionnaire surveys with limited statistical evidence
(e.g. Martinelli et al., 2007). As Geuna and Nesta (2006) claim, “there is an urgent need
for more reliable and more useful data (on a time series basis) to be collected, not only
on intellectual property activity but also on the inputs and outputs of the other activities
carried out by researchers and research organisations.”
Our results indicate that researchers with collaborative links with the private
sec-tor publish more than their peers without such links. Researchers who obtained only
non-industrial funding or only coauthored papers with academic coauthors are likely to
publish signi…cantly less than their peers with a small fraction of industry collaboration.
As the fraction of industrial collaboration increases, though, the number of publications
decreases. High levels of industry collaboration end up being more negative in terms of
research output than no collaboration at all. We also show that our results are robust if
one takes into account the number of coauthors to avoid double counting of publications.
Finally, we also show that the pattern is similar if one takes into account the impact of the
journal in which the publications appear. Again, researchers that have highest predicted
quality-weighted number of publications are those that have had a positive but minimal
contact with the industry. With respect to the direction of their research, we …nd again a
puzzling result: Both no collaboration with the industry or not having received any
EP-SRC grant in the past decrease the likelihood of publishing applied research papers but
at the same time, those that publish more applied papers are those who have a minimal
fraction of their funding with industrial partners.
Our sample enables us to draw comparisons between di¤erent types of institutions
di¤erent pro…le. Whereas the former is one of the top ranked institutions in the UK
and in the world in terms of research and technology transfer, the latter is a relatively
small and new university. Despite these di¤erences, the results for the two institutions
are qualitatively the same.
In this paper we concentrate on the e¤ects of collaborations between universities and
private organisations, which is a particular form of knowledge and technology transfer.
More progress has been made on the analysis of the impact of patenting, another form of
technology transfer3. Agrawal and Henderson (2002) found that patenting did not a¤ect
publishing rates of 236 scientists in two MIT departments in a 15-year panel. Fabrizio and
DiMinin (2005) identi…ed a statistically positive e¤ect of researchers’patent stocks on the
publication counts in a sample of 166 academic patenters as compared to a matched set of
non-patenting scientists. Stephan et al. (2007) also found that patenting and publishing
relate positively. Azoulay et al. (2008) found that both the ‡ow and the stock of scientists’
patents are positively related to subsequent publication rates without comprising the
quality of the published research. Studies by Ranga et al. (2003) and van Looy et al.
(2006), which are based on data from the Katholik Universiteit van Leuven (KUL) in
Belgium, did not …nd evidence for the skewing problem either, whereas Larsen (2006)
reports that researchers with intermediate amounts of industry collaboration produce the
most basic research.
Our paper suggests that the previous results are not only due to the fact that
com-mercialisation activities provides involvement and feedback from the private sector. After
controlling for the degree of industry collaboration and instrumenting for patents, we no
longer …nd that patenting leads to an increase in the number of publications.
The paper is organized as follows: section 2 describes our empirical model and data;
section 3 describes the results; and …nally section 4 discusses and concludes.
3See Baldini et al. (2008) for a recent review of the literature on the concerns stemming from university
patenting and licensing activities. Geuna and Nesta (2006) surveys the e¤ects of patenting activities in
2
Empirical strategy
We exploit information from two universities based in London, UK, with a very di¤erent
pro…le: Imperial College London, one of the top ranked institutions in the UK and in the
world, and City University, a relatively small and a relatively new university that received
the Royal Charter in 1966. The former was one of the co-founders of the University of
London whereas City University formed out of a vocational school. Imperial College is
known for being research oriented. It has one of the largest research incomes and it
is one of the most technology transfer active universities in the UK. Imperial College’s
Technology Transfer Company was founded in 1986 and registered more than a 100 patents
in 2007 alone. City University on the other hand has not been as focused on research and
patenting and therefore also has a much shorter history of industry sponsored research.
2.1
Data
We have created a longitudinal dataset containing demographic characteristics,
publica-tions, research funds and patents for all the researchers employed in the Departments of
Civil Engineering, Mechanical and Aeronautical Engineering and Electrical Engineering
of City University of London and Imperial College London from 1985 until 2006.4 We
concentrate on the engineering sector, as it has traditionally been associated with applied
research and industry collaboration and it contributes substantially to industrial R&D
(Cohen et al. 2002). Additionally, industry collaboration of academics in engineering
departments is better recorded than in other disciplines.
(1) Demographics. Research productivity might be linked to the researchers’personal
attributes such as gender, education and academic rank. Of this, academic rank is the
only time-variant and relevant variable for our analysis. We therefore integrate
informa-tion on the evoluinforma-tion of the researchers’academic status from lecturer to senior lecturer,
reader and professor into our analysis. This information was taken from the universities’
4For Imperial College we collected data from only 3 of their 6 engineering departments to better match
prospectuses and calendars, which are available at the British Library.5
(2) Publications. We collected information on all articles that were published by the
aforementioned researchers while they were employed at the two institutions, and are
indexed in the ISI Science Citation Index. The entrees include address data that allowed
us to identify coauthors and hence we can evaluate whether they can be considered as
research output with public coauthors only or also with industrial coauthors.
(3) Research Funds. We collected information on the funding that these researchers
obtained from the Engineering and Physical Sciences Research Council (EPSRC), the
main UK government agency for funding research in engineering and the physical
scien-cies. We computed the total monetary value of the research grants awarded to each sta¤
member in our sample while they were employed at the two institutions.6 Each award
holds information on the research partners which will enable us to distinguish between
funds with at least one industrial partner from those without any.
(4) Patents. We further collected patents that identify the aforementioned researchers
as inventors and have been …led while they were employed at the two institutions from
the European Patent O¢ ce database. We thereby did not only consider patents …led by
the universities themselves but also those assigned to third parties. The …ling date was
chosen as it represents the closest date to invention.7
Research productivity. First, we use two variables as proxies for research output
5Information about academic employment is given by academic year. However, subsequent information
on publications and research income was collected by calendar year. Therefore employment periods
were transferred into calendar years which added half a year to the start and end of each researcher’s
employment.
6The information available dates back to 1985. This is one of the reasons for the starting year of our
sample. Also, from 1985 onwards, the Higher Education Funding Council for England (previously called
University Grants Committee) decided to be selective in its research funding to universities. They were
then induced to also seek for alternative sources of income.
7As in previous studies (see e.g. Fabrizio and Di Minin (2008), data construction requires a manual
search in the inventor database to identify the entries that were truly the same inventor and exclude
others with similar or identical names. This was done comparing address, assignee and technolgoy class
in a given year: 1. the number of publications for which the researcher is an author,
regardless of the number of coauthors; and, 2. the “coauthor-weighted” sum of
publi-cations for which the researcher is an author, with the weights being the inverse of the
number of coauthors. The second measure is also widely used because it avoids double
counting of publications (see e.g. Hanish et al., 1998). Besides those two proxies, we use
the “impact-factor-weighted”sum of publications in a given year, with the weights being
the impact attributed to the journal in which the publication appears. This proxy allows
us to adjust research productivity by its relative quality.8 We use the ISI Impact Factor
2005, a noisy but widely accepted measure of importance attribution based on the number
of citations the journals receive. Since we concentrate on only one area of research, the
impact factor can be considered as fairly reliable (Narin and Hamilton 1996).
Direction of research. As an indicator of the direction of research we use widely used Patent board-NSF classi…cation 2005, developed by Narin et al. (1976) and updated
by Kimberley Hamilton for the National Science Foundation (NSF). Based on
cross-citations matrices between journals, it characterises the general research orientation of
journals, distinguishing between (1) applied technology, (2) engineering and technological
science, (3) applied and targeted basic research, and (4) basic scienti…c research. We
then aggregate the ranks into applied and basic research publications. In accordance with
Breschi et al. (2008) we classify types 1 and 2 as applied and types 3 and 4 as basic
publications.
University-industry collaboration. We de…ne two di¤erent proxies for university-industry collaboration: the fraction of EPSRC funds with at least one industrial project
partner and the fraction of academic publications with at least one coauthor from the
industry. Both measures are complementary as not all industry collaboration results
in co-publications (Katz and Martin, 1997). Since the ‘accumulated’collaboration may
capture better the true pro…le of the academic in terms of her collaboration with the
8As an alternative measure, one could have used the number of citations of the article. This measure,
however, is a¤ected by the number of years since publication since, of course, citations accumulate over
time. One would need to carefully normalise the time e¤ects or consider a speci…c time-window and drop
industry, we use stock speci…cations of these two measures. We also take a one-year lag
as the e¤ect of industry collaboration is not contemporaneous. Additionally, we allow for
a di¤erential e¤ect for those researchers with no industry collaboration at a given time by
introducing two time-variant dummy variables that take value one if the researcher does
not have any EPSRC funding with an industrial partner and if she does not have any
coauthor with an industrial a¢ liation, respectively. Finally, we also introduce two further
time-variant dummy variables that take value one if the researcher has not received any
funding and if the researcher has not published any paper, respectively.
Patents and academic rank. To measure the impact of academic patenting on the
timing of the release of publications, we de…ne three variables which count at time t the
number of patents …led during (1) the previous year t 1, (2) the same year t, and (3)
the following yeart+ 1. We also include dummy variables for each of the academic ranks.
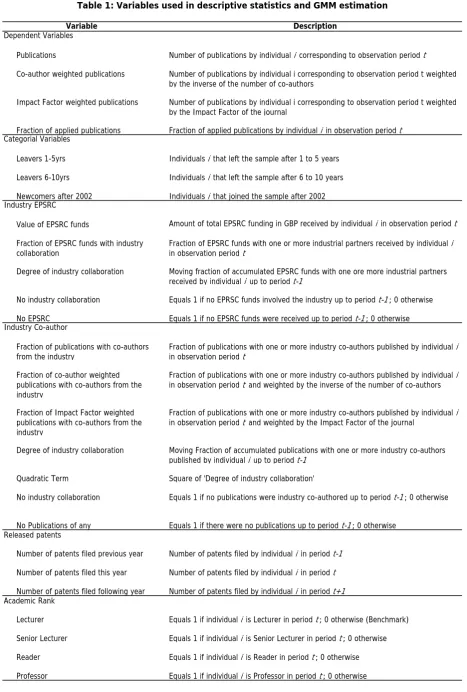
A formal de…nition of all the variables can be found in Table 1 and in the section below,
we provide some summary statistics of the variables we use in our empirical analysis.
2.2
Descriptive statistics of the data
Table 2 presents descriptive statistics of our data set, with Figures 1 to 4 presenting
graphically some of this information. Figure 1 shows that the total number of publications
is higher for Imperial than for City partly because City University only has 97 sta¤ member
observations as opposed to 279 for Imperial. However, the average number of publications
per sta¤ member is also lower at City for most years, as shown in Figure 2. The average
number of publications is steadily increasing at Imperial and it is much more volatile at
City, probably because it is a smaller university and it is more a¤ected by sta¤ turnover.
Table 2 shows that the average number of publications per member of sta¤ per year
is signi…cantly higher at Imperial College (1.64) than at City University (1.15). However,
if one takes into account the number of coauthors, the di¤erence is reduced to a
non-signi…cant amount. Researchers at Imperial tend to publish with more coauthors. If
one adjusts the number of publications by their quality (measured through the impact
quality-adjusted average of 1.25 while City University’s average is 0.98. According to
our de…nitions of basic and applied publications, the percentage of applied is practically
the same for both universities, with 79% of the total. The high percentage of applied
publications is given the applied character of engineering science itself. The average
EPSRC funding for Imperial College is about …ve times higher than that of City University
(£ 77,230 as opposed to £ 16,526). Overall, these results re‡ect the important di¤erences
between the two universities, especially in the absolute numbers of these variables.
Our measures of university-industry collaboration, however, are not that di¤erent
between the two universities. Figure 3 does not show a clear pattern as to which university
has a higher percentage of publications with industry co-authors. Again Imperial seems to
follow a more stable trajectory than City. Table 2 shows that on average the percentage
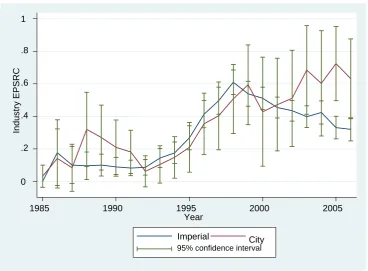
is slightly higher for Imperial (11%) than for City (8%). The ratio of EPSRC with
industry partners over all EPSRC is almost the same for both Universities and equal to
about a third. Figure 4 shows that this relationship has not always been the same: City
University’s percentage of Industrial EPSRC is higher than that of Imperial College before
1992 and ever since 2002. Imperial’s percentage of industrial EPSRC raised up until 1998
and has declined over the past 10 years.
The average number of patents di¤ers signi…cantly between the two institutions: 0.05
for Imperial College and 0.03 for City University. These values are nevertheless very small
for both institutions (the maximum number of patents per member of sta¤ in a year is 4
for Imperial and 2 for City).
2.3
Empirical Model
We base our empirical speci…cation on the implicit assumption that the utility of a
re-searcher in a given year depends on the quantity and the quality of her publications, the
amount of research grants, the number of patents, and her income. Given her time
con-straints, the researcher chooses how much time to devote to basic and applied research,
to grant applications, to teaching and to performing other administrative tasks; and to
According to the reduced form of this model, research output should depend not only
on time-invariant socio-demographic characteristics, but also on time-dependant variables
including the academic’s degree of collaboration with industry partners and other control
variables re‡ecting changes in her status (academic rank, etc.). Accordingly, we formulate
reduced form equations for the di¤erent measures of research output as:
yit= yi;t 1+x0it +zi0 +"it where "it= i+vit
andyitis the research outcome measure of academiciin yeart;yi;t 1 the research outcome
measure lagged one period;xita vector of time variant explanatory variables including the
stock measure of industry collaboration, measures of patent ‡ow and academic rank; zi
contains time-invariant observed individual speci…c variables such as gender, education,
department, and university. As usual, "it is the error term containing two terms: the
academic i …xed e¤ect i and a disturbance term vit:We assume that the idiosyncratic
disturbances i are uncorrelated across individuals.
In order to control for the potentially di¤erent e¤ect of industry collaboration on
academic outcomes for those academics that leave our sample early, either between the
1st and 5th year or between the 6th to 10th year after their arrival, as well as for those
academics that join the sample after 2002, we create indicator variables for those three
groups. We will interact these dummy variables with the degree of industry collaboration
to control for the attrition bias.
Thus, we are faced with the estimation of a dynamic model - current realizations
of the dependent variable are in‡uenced by past ones. Moreover, some regressors may
be endogeneous -.i.e., some of the time variant and invariant explanatory variables are
most likely correlated with the perturbation term "it:As an example, being a professor
or getting many industrial funds are most likely correlated with having a high cognitive
ability, which is an unobserved factor captured in the …xed e¤ect term i. The existence
of a …xed e¤ect term in the disturbance poses additional challenges to the econometrician:
even if thevit are uncorrelated over time, there exists serial autocorrelation of the "it.
To ensure consistency and to solve the …xed e¤ects induced autocorrelation of our
Blundell and Bond 1998). In brief, this estimator treats the model as a system of
equa-tions – one for each time period – where the predetermined and endogenous variables
in …rst di¤erences are instrumented with suitable lagged variables. A problem with the
original Arellano-Bond estimator is that lagged levels are often poor instruments for …rst
di¤erences. Arellano and Bover (1995) described how one could add an equation in levels
to be estimated with the equation in …rst di¤erences and thereby improve the performance
of the estimator, increase e¢ ciency and reduce …nite sample bias. To further improve the
e¢ ciency of our estimates, we use the two-step GMM based on taking deeper lags of the
dependent variable as additional instruments, as described in Roodman (2006). We treat
the lagged number of publications, the number of patens, and the stock variables for the
degree of industry collaboration as endogenous and the academic rank and year dummies
as exogenous. To instrument we use all variables, the exogeneous and the lagged
endo-geneous ones. The inclusion of lags results in a large number of instruments. This may
lead the system-GMM estimator to use too many moment conditions with respect to the
number of available observations, and hence to over-…tting. Thus, we had to reduce the
number of lags used to keep the number of instruments below the number of academics
(i.e., the number of ‘groups’ we have). As a robustness check, we include estimations
treating only the clearly endogenous lagged variables as instruments and all other
vari-ables as exogenous. Complementarily, we also report the results of a simple GLS with
…xed e¤ects.
Lastly, to study the impact of collaborating with the industry on the probability of
the academic re-directing her/his research towards applied papers, we estimate a reduced
form where the proability of producing applied research papers depends on observable
characteristics, industry collaboration, and individual dummies, controlling by the year
of publication.
2.4
Empirical results and discussion
In this section, we …rst present the estimates of the GLS with …xed e¤ects and the
productivity in terms of quantity and quality of research output. Later on this section,
we describe our …ndings with regards to the e¤ect that patents have on the timing of
release of the publications. Then, we comment on the estimates of the Probit model
with individual …xed e¤ects for the impact of industry collaboration on the probability of
producing applied research papers. Finally, we discuss the e¤ect that academic seniority
has on research output by referring to both, the GMM and the Probit estimates.
Our main empirical results are reported in Tables 3 and 4. These tables report the
estimates of six di¤erent model speci…cations. First, in column 1, the results of
estimat-ing a Fixed E¤ects GLS speci…cation. Second, in column 2, the estimates of a GLS with
Fixed E¤ects speci…cation that includes the lagged dependent variable term as a regressor.
Third, in column 3, the results corresponding to the estimation of a GMM model where
the only endogenous variable we consider is the lagged dependent variable (number of
publications). Fourth, results in column 4 correspond to the estimation of a GMM model
where patents are also treated as endogenous. The …fth speci…cation estimates displayed
in column 5 considers lagged number of publications and industry collaboration as
endo-geneous. Finally, in column 6 we display the results of the sixth and last speci…cation in
which all three potentially endogenous variables as endogeneous, i.e. lagged number of
instruments, patents, and industry collaboration.
For all GMM speci…cations, we report the Arellano-Bond tests and the Sargan/Hansen
tests at the bottom of Tables 3, 4 and 5. The Arellano-Bond tests do not reject the null
that there is absence of second (or higher) order correlation of the disturbance terms of
our speci…cations, required for consistency of our estimates. The Sargan/Hansen tests are
also insigni…cant suggesting that the models do not su¤er from over-identi…cation.
For simplicity, most of the discussion of the results in terms of the impact of industry
collaboration on research output will focus on the estimates of the sixth speci…cation in
Tables 3 and 4. We believe that this is the better speci…cation in terms of unbiasedness
and consistency of the coe¢ cients. The other speci…cations are included as robustness
checks.
industry collaboration, measured by the lagged accumulated fraction of EPSRC funding
with the industry and Table 4 reports the lagged accumulated fraction of industry
co-authored papers . The estimate for the constant term can be considered as our “baseline”
or benchmark prediction for a researcher with a minimal but positive degree of industry
collaboration. The last column in Table 3, for instance, shows that a researcher who
has a marginal fraction of her overall previous EPSRC funding with industrial partners
is predicted to publish 2.934 articles per year. Two and a half publications (-2.491)
are subtracted if she had no past EPSRC funding. Thus, an academic who has not
obtained any kind of EPSRC funding up to the previous year publishes signi…cantly less.
More surprisingly, researchers who obtained only non-industrial funding in the past are
also likely to publish signi…cantly less than their peers with a small fraction of funding
with industrial partners. Those with only non-industrial past funding have one and a
half publication (-1.527) subtracted from the benchmark. As the fraction of industrial
collaboration increases though the number of publications decreases, at an average rate
of -3.035. In an extreme case where all the previous EPSRC funding included industrial
partners (so that the variable industry collaboration equals 1), the number of publications
is predicted to fall below zero (2.934-3.035=-0.101).9 10
The other speci…cations presented in Table 3 show similar results, however, as
dis-played in column 4 where we consider industry collaboration as an exogenous variable
but past publications and number of patents as endogenous, the number of predicted
publications for the extreme case of Degree of Industry Collaboration equaling one would
be close to one (1.649-0.697-0.802). This result is similar to the number of publications
9This predicted value turns negative due to the relatively low number of observations with a high
degree of industry collaboration. The estimate should therefore be taken with caution.
10As an exercise, we calculate the ‘steady state’ level of publications for any given level of industry
collaboration.We do that for the benchmark case of a Lecturer. Taking the estimates in column 5 of Table
3, the steady state number of publications would be equal to[ 2:934 (1 0:273)
3:035
(1 0:273) Degree of industry collaboration], or [4:035 4:17 Degree of industry collaboration]. Thus, again in the long run, the
maximum number of publications would be achieved at a minimal level of industry collaboration. But,
as for the short run estimate, having no external funding would be ‘bad’too in terms of publications as
predicted if the academic had had EPSRC funding without industrial involvement, but
higher than if she had had no previous EPSRC funding at all.
Note that the GMM estimates of the impact of industry collaboration on publications
is much more negative in the …nal speci…cations (last two columns of Table 3) than
otherwise. Our interpretation of this is that it corroborates the endogeneity of industry
collaboration.11 The GMM estimates in column 3, correct for the endogeneity of the lagged
dependent variable, but not that of industry collaboration. So, if industry collaboration
and past publications are positively correlated through an unobservable time variant factor
a¤ecting both of them positively - say accumulated ‘expertise’- then, the estimate of the
impact of the industry collaboration will be biased upwards re‡ecting the positive e¤ect
of that omitted time variant factor on current publications. Once the endogeneity of
industry collaboration is accounted for (in the estimates showed in last two columns),
its e¤ect becomes necessarily more negative. This ‘negativization’e¤ect can be observed
for both the continuous variable ‘Degree of industry collaboration’, and the indicator
variables ‘No EPSRC’and ‘No industry collaboration’as they become also more negative
when their endogeneity is controlled for.
As explained before, to control for the attrition bias in our sample, we interact the
degree of industry collaboration with a dummy for those academics who left their
insti-tution within the …rst …ve years of joining and also with a dummy for those who left it
between 6 and 10 years after they joined. Given that our sample ends in 2006, we also
interact it with a dummy for those academics who enter our sample after 2002. As we
can see from the signi…cance levels of the estimates, the results for the leavers and the
newcomers are not signi…cantly di¤erent from those for the benchmark academics present
through all the sample.
The results in Table 4 indicate that our results are robust to the alternative de…nition
of industrial collaboration based on the fraction of co-authored publications with the
industry. Looking again at the …rst row of the last column of this table, we see that the
11Given that, as expected, past publications signi…cantly explain current publications, the …rst two
baseline annual number of publications according to this model is 2.199; not having had
any previous publication has also a very negative e¤ect on that publications’benchmark
(-1.804); and, not having had any publication co-authored with an industrial partner
before also subtracts a fair amount of publications (-1.355). Further, the number of annual
publications increases signi…cantly for low levels of industrial involvement as compared
to none at all: it declines at a rate of -2.705 with the fraction of industrial coauthored
papers. For all four GMM models, we get negative predicted numbers of publications
for higher levels of industry collaboration. This is partly due to the low number of
observations for such higher levels but also because of the interdependence between the
lagged dependent variable and the industry coauthor measures. However, our estimates
indicate that researchers that publish a small fraction of their articles with industrial
coauthors publish more than their counterparts with a larger fraction and more than
those without any industrial coauthors at all.12
In Table 5 we report several alternative speci…cations to check the robustness of our
model. To simplify, we only use the fraction of past accumulated EPSRC with industrial
partners as a measure of industry collaboration and omit the results with the
indus-try coauthor measure. The GMM models’ results in columns 1 to 5 instrument for all
potentially endogenous variables and hence they compare to column 6 in Tables 3 and 4.
Results of the model in column 1 include interaction terms for City University to allow
results to vary by university. Imperial College’s estimates are re‡ected in the main e¤ects’
coe¢ cient and those of City University in the interaction terms. The impact of industrial
collaboration on publications is qualitatively the same in the two institutions. However,
having no previous funding at all has a signi…cantly more negative coe¢ cient for those at
City than for those at Imperial. Having had no previous industrial involvement also has a
worse e¤ect on publications for those at City than those of Imperial, but the di¤erence is
not signi…cant. The marginal e¤ect of industry collaboration on research productivity is
12Nevertheless, since the sample average of industry collaboration is about 0.31 when measured through
the lagged accumulated fraction of industrial EPSRC funds and just 0.08 when measured using
publica-tions with industrial co-authors, we are aware that implicapublica-tions at the extremes should be interpreted
more positive for City but again not signi…cant. The number of instruments in this model
outnumbers the number of groups and might therefore su¤er from over-…tting. However,
it was not possible to reduce the number of instruments further. Summarising, despite
their di¤erent characteristics the overall pattern of the impact of industry collaboration
is similar at both institutions.
In column 2 of Table 5 we report the estimates of a model that uses a stock of industry
collaboration lagged three periods as opposed to one. As reported, that reduced the
coe¢ cient for lagged number of publications (from 0.332 to 0.239), but leaves the degree
collaboration impact quite unchanged (-2.312 instead of -2.334). Also column 3, which
reports our model when excluding all those members of sta¤ with little research activity
(those who publish less than 3 papers throughout their career), …nds similar results. Here,
the number of publications does not turn to a negative value for industrial collaboration
equal to one. Again, for this model, the number of instruments is rather large as compared
to the numbers of researchers and results might su¤er an over-…t.
Table 5 further checks whether our results are robust to changes in the measure of
‘academic output’. In the forth column we use the ‘inverse of the number of
coauthors-weighted’number of publications as the dependent variable of the model to avoid double
counting of publications. In the …fth column we use theimpact-factor-weighted number of
publications to capture the quality of the publications. As can be seen in column 4, impact
of industry collaboration on the coauthor weighted publications is similar to the results
reported in column 6 of Table 3. The default number of weighted publications is 1.150,
not having had yet any previous industry collaboration makes the expected weighted
number of publications drop by a signi…cant -0.523. Not having had any EPSRC has
an even more negative e¤ect on the baseline number of weighted publications (-0.866).
Weighted publications then decline at a rate of -1.182 with lagged accumulated fraction of
industry collaboration. The e¤ects are again qualitatively similar to those of the original
speci…cation.
Column 5 of Table 5 shows the impact of industry collaboration on the ‘impact
publications is 5.442 per year, not having had industry collaboration and not having had
any EPSRC have very negative e¤ects on this number (-3.802 and -4.973, respectively).
The quality adjusted number of publications declines then at a rate of -5.488 with
in-creasing intensity of collaboration with the industry. Again, those researchers that have
the highest predicted quality weighted number of publications are those that have had
previous funding with a minimal part linked to industrial partners. However the lagged
number of publications does not have a signi…cant in‡uence on the current year’s number
of publications.
In sum, results in Tables 3 and 4 and columns 1 to 5 in Table 5 suggest that not having
any industrial contact has a very negative impact on academic output. But, at the same
time, academic output is higher for low degrees of industry involvement as compared to
high levels of industrial collaboration. All tables show that the results do not di¤er much
between the di¤erent speci…cations of our GMM model and neither do they di¤er when
using di¤erent speci…cations of our measures of research output or industry collaboration.
Skewing e¤ect. Column 6 of Table 5 presents the estimates of the impact of industry collaboration on the probability of an applied publications using a Probit model with
individual dummies to control for …xed individual e¤ects. To estimate this model, we only
consider observations for which we have information on the publication type in terms of
appliedness/basicness. Focussing on the marginal e¤ects, we …nd a signi…cant negative
relationship between the likelihood of publishing an applied paper and having no EPSRC
funding and no prior industry collaboration (–0.164 or16.3% and -7.4% lower probability).
This shows that having had no previous funding or only public funding can be associated
with a higher probability of producing basic research. However, the impact of the degree of
industry collaboration on the probability of applied publications is negative by decreasing
it by up to a 30%. This result suggests that low levels of industry involvement can be
associated with higher applied research but that high levels of collaboration increase the
likelihood of producing basic publications. This result might be biased due to the selection
bias created by having to drop those publications for which we have no information and
need to be taken with caution. Additionally, the patent variables’coe¢ cient show that
having …led a patent the previous year increases the probability of producing applied
publications. Thus, this suggests that …ling patents may indeed be costly in terms of
future basic research.
Secrecy e¤ect. Table 3, 4 and 5 also include patent variables which help to analyse the impact of patenting on the number of publications. We hypothesized that patenting
might delay publications as only unpublished information can be patented. Therefore
we expect that the number of publications is below average the years contemporaneous
and previous to the year of producing a patent because publications might be held back.
Consistently, we expect the number of publications to be above average the year after …ling
a patent. The results for the …xed e¤ects model as well as the GMM estimates indicate
indeed that having …led patents in the previous year has an overall positive e¤ect on the
number of publications. This might indicate that publications are delayed until the patent
is …led and then published subsequently. The estimates however are only signi…cant if we
consider patents exogenous variables and do not instrument them. Thus, it seems that
the signi…cance of patents is merely picking up the signi…cance of some unobserved other
individual characteristic that in‡uences patents and publications.
Results of the …xed e¤ects regressions additionally indicate that in the year before
…ling a patent researchers publish less than in a usual year. This again could indicate
that publications are held back until the application has been …led. Regardless, neither of
these estimates do stand up to scrutiny in our main model in column 6. Column 1 of Table
5 again shows that the e¤ect of patenting are very di¤erent for the two universities. The
results seem to be driven by City University researchers who publish signi…cantly more
the year after they …led a patent, while patenting has no e¤ect on publications numbers
at Imperial College whatsoever. The di¤erence to City University sta¤ can be explained
by the low number of patent observations for City University. We therefore conclude that
it is di¢ cult to draw conclusions regarding the secrecy hypotheses, and if anything we
Demographic variables Both institutions show that the number of publications, whether we adjust by the number of coauthors or by the quality of the journal, or not,
increases with seniority. Professors publish more than readers, which in turn publish more
than senior lecturers and lecturers. However, the di¤erence between lecturers and senior
lecturers is only signi…cant in the …xed e¤ects model but not for any of the research output
measures in the GMM regressions. Also Applied-ness cannot be associated with seniority
but seems una¤ected by a researchers rank.
3
Concluding Remarks
Our main results for this panel indicate that researchers bene…t from collaborating with
the industry. Researchers with no industrial involvement are likely to be those with
the least research outcome in both universities. Nevertheless, high levels of industrial
involvement a¤ect negatively research productivity in terms of number of publications - be
this number measured crudely or be it weighted by the inverse of the number of co-authors
or the impact factor of the publishing journal. Our results also indicate that correcting for
the reverse causality of industry collaboration and research output is crucial when trying
to estimate the true impact the former on the latter. Since both number of papers and
industry collaboration are positively a¤ected by unobserved factors such as intelligence
and/or ability, the impact of excessive diversion from academic activity through industrial
collaboration can be seriously underestimated when not using an adequate estimation
method.
In terms of policy prescription, our …ndings suggest that encouraging universities
to collaborate moderately with the industry - e.g., through Transfer of Technology and
Knowledge programs - is a bene…cial policy not only per se but also for academic
produc-tivity. But, doing so without at the same time providing incentives to publish academic
research papers may have a perverse e¤ect and harm the quantity and quality of academic
research output. Finally, discouraging high levels of industry collaboration may also be
Our conclusions have to be taken with caution. First of all, our sample although
larger than any used so far, may still be small. Second, further research is warranted on
how to accurately measure research output and the degree of external funding, including
industry collaboration. Although this is a limitation, results obtained using all research
funding information for City University are qualitative similar to those using only EPSRC
funding.
References
[1] Aghion, P., M. Dewatripont, and J. Stein, 2005, “Academia, the Private Sector, and
the Process of Innovation”, NBER working paper no11542.
[2] Agrawal, A. and R. Henderson, 2002, “Putting Patents in Context: Exploring
Knowl-edge Transfer from MIT”, Management Science 48, 44-60.
[3] Arellano, M. and S. Bond. 1991, “Some Tests of Speci…cation for Panel Data: Monte
Carlo Evidence and an Application to Employment Equations”, Review of Economic
Studies 58, 277-297.
[4] Arellano, M. and O. Bover. 1995, “Another Look at the Instrumental-Variable
Esti-mation of Error-Component Models”, Journal of Econometrics 68, 29-52.
[5] Azoulay, P„ W. Ding and T. Stuart, 2006, “The Impact of Academic Patenting on
the Rate, Quality, and Direction of (Public) Research Output”, Journal of Industrial
Economics, forthcoming.
[6] Banal-Estañol, A., and I. Macho-Stadler, 2007, “Commercial Incentives in
Acad-emia”, working paper City university.
[7] Blumenthal, D., M. Gluck, K.S. Louis, M.A. Stoto, and D. Wise, 1986,
“University-industry Research Relationships in Biotechnology: Implications for the University”,
[8] Blundell, R. and S. Bond. 1998, “Initial conditions and moment restrictions in
dy-namic panel data models”, Journal of Econometrics 87, 11-143.
[9] Breschi, S., F. Lissoni and F. Montobbio, 2008, “University patenting and scienti…c
productivity. A quantitative study of Italian academic inventors”, European
Man-agement Review 5, 91-110.
[10] Calderini, M., C. Franzoni, and A. Vezzulli, 2007, “If star scientists do not patent:
an event history analysis of scienti…c eminence and the decision to patent in the
academic world”, Research Policy 36, 303-319.
[11] Cohen, W.M., R.R. Nelson and J.P. Walsh, 2002, “Links and Impacts: The In‡uence
of Public Research on Industrial R&D”, Management Science 48, 1-23.
[12] Crespi, G.A., A. Geuna and L. Nesta, 2006, “Labour Mobility of Academic
Inven-tors: Career Decision and Knowledge Transfer”, Working paper European University
Institute.
[13] DES, 1991, “Higher Education. A New Framework”, Stationery O¢ ce, London.
[14] Elton, L., 1986, “Research and Teaching: Symbiosis or Con‡ict”, Higher Education
15, 299-304.
[15] Fabrizio, K. and A. DiMinin, 2008, “Commercializing the Laboratory: Faculty
Patenting and the Open Science Environment”, Research Policy 37, 914-931.
[16] Florida, R. and W.M. Cohen, 1999, “Engine or Infrastructure? The University Role
in Economic Development” In: Branscomb, L.M., Kodama, F., Florida, R. (Eds.),
Industrializing Knowledge: University— Industry Linkages in Japan and the United
States. MIT Press, London, 589— 610.
[17] Geuna, A., 1997, “Allocation of funds and Research Output: The Case of UK
[18] Geuna, A., 2001, “The Changing Rationale for European University Research
Fund-ing: Are There Negative Unintended Consequences?”Journal of Economic Issues 35,
607-632.
[19] Geuna, A. and L. Nesta, 2006, “University Patenting and its E¤ect on Academic
Research: The Emerging European Evidence”, Research Policy 35, 790-807.
[20] Godin, B., 1996, “Research and the practice of publication in industries”, Research
Policy 25, 587-606.
[21] Goldfarb, B., 2008, “The e¤ect of government contracting on academic research:
Does the source of funding a¤ect scienti…c output?”, Research Policy 37, 41-58.
[22] Gulbrandsen, M. and J.C. Smeby, 2005, “Industry Funding and University Professors’
Research Performance”, Research Policy 34, 932-950.
[23] Hanish C., J.J. Horan, B. Keen, and C. Ginger, 1998, “A Note on the Empirical
Futility of Labor-Intensive Scoring Permutations for Assessing Scholarly
Productiv-ity: Implications for Research, Promotion/Tenure, and Mentoring”, Education Policy
Analysis Archives 6 (15), 32-44.
[24] Heller, M.A. and Eisenberg, R. S., 1998, “Can Patents Deter Innovation?”, The
Anticommons in Biomedical Research Science, 280, 5364, 698-701.
[25] Henderson, R., A. Ja¤e and M. Trajtenberg, 1998, “Universities as a Source of
Com-mercial Technology: A Detailed Analysis of University Patenting, 1965-1988”,
Re-view of Economics and Statistics 80, 119-127.
[26] Hicks, D., and K. Hamilton, 1999, “Does University-Industry Collaboration
Ad-versely A¤ect University Research?”, Issues in Science and Technology, 74-75.
[27] HM Treasury and DTI, 1998, “Innovating for the future: investing in R&D”,
[28] Katz,J.S., and B.R. Martin, 1997, “What is research collaboration?”, Research Policy
26(1), 1-18.
[29] Lambert, 2003, “Lambert Review of Business-University Collaboration”, Stationery
O¢ ce, London.
[30] Larsen, M.T., 2006, “Does industrial relevance in public science come at the expense
of basic research? Exploring tradeo¤s in academic research: Exploring tradeo¤s in
university research.” SPRU Conference proceedings.
[31] Lockett, A. and M. Wright, 2005, “Resources, capabilities, risk capital and the
cre-ation of university spin-out companies”, Research Policy 34 (2005), 1043–1057.
[32] Nature, 2003, “Research funding: the problem with priorities”. Nature 10, pp. 639
[33] Martinelli A., M. Meyer, and N. von Tunzelmann, 2007, “Becoming an
entrepre-neurial university? A case study of knowledge exchange relationships and faculty
attitudes in a medium-sized, research-oriented university”, The Journal of
Technol-ogy Transfer, forthcoming.
[34] Mowery, D., R. Nelson, B. Sampat, and A. Ziedonis, 2001, “The Growth of Patenting
and Licensing by U.S. Universities: An Assessment of the E¤ects of the Bayh-Dole
Act of 1980”, Research Policy 30, 99-119.
[35] Mowery, D., B. Sampat, and A. Ziedonis, 2002, “Learning to Patent? Institutional
Experience and the Quality of University Patents”, Management Science 48, 73-89.
[36] Mowery, D. C. and A. Ziedonis, 2002, “Academic Patent Quality and Quantity Before
and After the Bayh-Dole Act in the United States”, Research Policy 31, 399-418.
[37] Narin, F., G. Pinski, H. Gee, 1976, “Structure of the Biomedical Literature,”Journal
of the American Society for Information Science, 25-45.
[38] Narin, F. and K.S. Hamilton, 1996, “Bibliometric performance measures”,
[39] Nelkin, D., 1984, Science as intellectual property: Who controls research?, American
Association for the Advancement of Science, MacMillan, New York.
[40] OECD, 2002, “Draft …nal report on the strategic use of intellectual property by
pub-lic research organisations in OECD countries”, DSTI/STP (2002) 42/REV1, Paris:
OECD.
[41] Ranga, L. M., K. Debackere, and N. von Tunzelmann, 2003, “Entrepreneurial
uni-versities and the dynamics of academic knowledge production: A case study of basic
vs. applied research in Belgium”, Scientometrics, 58(2), 265–279.
[42] Roodman, D., 2006, “How to Do xtabond2: An Introduction to "Di¤erence" and
"System" GMM in Stata”, Working Paper 103. Center for Global Development,
Washington.
[43] Stephan, P., S. Gurmu, A.J. Sumell and G. Black, (2007) “Who’s Patenting in the
University?”, Economics of Innovation and New Technology 61, 71-99.
[44] Tapper, T., 2007, “The Governance of British Higher Education: The Struggle for
Policy Control”. Springer Netherlands.
[45] Thursby, J. and M. Thursby, 2002, “Who is Selling the Ivory Tower: the Sources of
Growth in University Licensing”, Management Science 48, 90-104.
[46] Thursby, J.G. and M.C. Thursby, 2007, “Patterns of Research and Licensing Activity
of Science and Engineering Faculty”, in Ehrenberg, R. and P. Stephan, eds., Science
and the University, Madison: University of Wisconsin Press, forthcoming.
[47] Thursby, M.C., J.G. Thursby, and S. Mukherjee, 2005, “Are there Real E¤ects of
Licensing on Academic Research? A Life Cycle View”, NBER working paper 11497.
[48] UK National O¢ ce Audit Report, 2002, “Delivering the Commercialisation of Public
[49] van Looy B, Debackere K, Callaert J, 2006, “Publication and Patent Behaviour of
academic researchers: con‡icting, reinforcing or merely co-existing”, Research Policy
Figure 1: Total Number of Publications
Figure 2: Average Number of Publications (per staff) 0
100 200 300 400
Publ
icatio
n
1985 1990 1995 2000 2005
Year
Imperial City
0 1 2 3 4
PublNo
1985 1990 1995 2000 2005
Year
Imperial City
[image:30.595.136.461.347.606.2]Figure 3: Average % of EPSRC with Industry (per staff)
Figure 4: Average % of industry co-authored publications 0
.2 .4 .6 .8 1
Industry EPSR
C
1985 1990 1995 2000 2005
Year
Imperial City
95% confidence interval
0 .2 .4 .6
Industry Publ
ic
ation
1985 1990 1995 2000 2005
Year
Imperial City
Variable Description
Dependent Variables
Publications Number of publications by individual i corresponding to observation period t
Co-author weighted publications Number of publications by individual i corresponding to observation period t weighted by the inverse of the number of co-authors
Impact Factor weighted publications Number of publications by individual i corresponding to observation period t weighted by the Impact Factor of the journal
Fraction of applied publications Fraction of applied publications by individual i in observation period t Categorial Variables
Leavers 1-5yrs Individuals ithat left the sample after 1 to 5 years
Leavers 6-10yrs Individuals ithat left the sample after 6 to 10 years
Newcomers after 2002 Individuals ithat joined the sample after 2002 Industry EPSRC
Value of EPSRC funds Amount of total EPSRC funding in GBP received by individual i in observation period t
Fraction of EPSRC funds with industry
collaboration Fraction of EPSRC funds with one or more industrial partners received by individual i in observation period t
Degree of industry collaboration Moving fraction of accumulated EPSRC funds with one ore more industrial partners received by individual i up to period t-1
No industry collaboration Equals 1 if no EPRSC funds involved the industry up to period t-1; 0 otherwise
No EPSRC Equals 1 if no EPSRC funds were received up to period t-1; 0 otherwise Industry Co-author
Fraction of publications with co-authors
from the industry Fraction of publications with one or more industry co-authors published by individual i in observation period t
Fraction of co-author weighted publications with co-authors from the industry
Fraction of publications with one or more industry co-authors published by individual i in observation period t and weighted by the inverse of the number of co-authors
Fraction of Impact Factor weighted publications with co-authors from the industry
Fraction of publications with one or more industry co-authors published by individual i in observation period t and weighted by the Impact Factor of the journal
Degree of industry collaboration Moving Fraction of accumulated publications with one or more industry co-authors published by individual i up to period t-1
Quadratic Term Square of 'Degree of industry collaboration'
No industry collaboration Equals 1 if no publications were industry co-authored up to period t-1; 0 otherwise
No Publications of any Equals 1 if there were no publications up to period t-1; 0 otherwise Released patents
Number of patents filed previous year Number of patents filed by individual iin period t-1
Number of patents filed this year Number of patents filed by individual iin period t
Number of patents filed following year Number of patents filed by individual iin period t+1 Academic Rank
Lecturer Equals 1 if individual i is Lecturer in period t; 0 otherwise (Benchmark)
Senior Lecturer Equals 1 if individual i is Senior Lecturer in period t; 0 otherwise
Reader Equals 1 if individual i is Reader in period t; 0 otherwise
[image:32.595.52.520.78.771.2]Professor Equals 1 if individual i is Professor in period t; 0 otherwise
Comparison Variable Mean Std.Dev. Min Max Mean Std.Dev. Min Max Mean Diff. (Imperial - City) Number of publications 1.15 2.8 0 34 1.64 2.21 0 16 0.497 (0.083)***
Number of co-author weighted
publications 0.65 1.27 0 12.5 0.7 0.95 0 7 0.048 (0.037)
Number of Impact Factor weighted
publications 1.209 3.835 0 45.954 1.892 4.245 0 62.606 0.682 (0.146)***
Value of EPSRC funds (in £1000) 16.32 33.02 0 271.45 77.23 149.1 0 2138.22 60.703 (45.59)***
Fraction of applied publications 79.3% 34.3% 0.0% 100.0% 79.4% 35.2% 0.0% 100.0% 0.001 (0.020)
Fraction of publications with
coauthors from the industry 8.2% 24.2% 0.0% 100.0% 11.6% 25.4% 0.0% 100.0% 0.028 (0.013)**
Fraction of EPSRC funds with industry
collaboration 31.5% 43.1% 0.0% 100.0% 33.8% 38.6% 0.0% 100.0% 0.023 (0.022)
Number of patents filed this year 0.03 0.18 0 2 0.05 0.27 0 4 0.024 (0.008)***
The total number of observations for City University is 1088 (97 academics); for Imperial College it is 3097 (279 academics). Standard errors in parentheses; * significant at 10%; ** significant at 5%; *** significant at 1%
Inactive Staff -or those having no publications and no EPSRC funds- are excluded
[image:33.595.133.746.90.293.2]City University Imperial College
GLS with Fixed Effects GLS with Fixed Effects GMM (Instrumenting for Publications) GMM (Instrumenting for Publications and Patents) GMM (Instrumenting for Publications and Industry Collaboration) GMM (Instrumenting for Publications, Patents and Industry Collab)
Constant 1.758 1.477 1.649 1.582 2.939 2.934
(0.243)*** (0.240)*** (0.255)*** (0.280)*** (0.624)*** (0.607)***
Publications (t-1) 0.197 0.232 0.234 0.274 0.273
(0.018)*** (0.069)*** (0.069)*** (0.074)*** (0.079)***
Industry collaboration
No EPSRC -0.924 -0.758 -1.296 -1.178 -2.519 -2.491
(0.191)*** (0.188)*** (0.250)*** (0.252)*** (0.692)*** (0.675)***
No industry collaboration -0.639 -0.516 -0.697 -0.706 -1.593 -1.527
(0.149)*** (0.147)*** (0.215)*** (0.212)*** (0.491)*** (0.446)***
Degree of industry collaboration -0.840 -0.704 -0.802 -0.718 -3.062 -3.035
(0.257)*** (0.252)*** (0.334)** (0.346)** (0.921)*** (0.945)***
Interaction for Leavers 1-5yrs 0.697 0.694 0.168 0.092 2.017 -0.505
(1.472) (1.444) (0.410) (0.375) (5.019) (5.822)
Interaction for Leavers 6-10yrs 0.550 0.467 -0.295 -0.404 2.326 2.072
(0.662) (0.649) (1.000) (0.481) (1.869) (1.819)
Interaction for Newcomers 2002 -0.304 -0.575 dropped dropped dropped dropped
(1.697) (1.666)
Released patents
Number of patents filed previous year 0.082 0.117 0.345 0.060 0.404 0.091
(0.131) (0.128) (0.154)** (0.184) (0.158)** (0.180)
[image:34.595.70.768.52.543.2]Number of patents filed this year -0.220 -0.156 0.197 -0.309 0.276 -0.210
(0.132)* (0.130) (0.141) (0.169)* (0.162)* (0.225)
Number of patents filed following year -0.286 -0.311 -0.043 0.252 -0.068 0.063
(0.133)** (0.131)** (0.161) (0.631) (0.183) (0.616)
Academic Rank
Senior Lecturer 0.598 0.458 0.100 0.089 -0.047 -0.024
(0.120)*** (0.118)*** (0.094) (0.098) (0.129) (0.126)
Reader 1.240 0.949 0.687 0.582 0.463 0.470
(0.147)*** (0.147)*** (0.153)*** (0.174)*** (0.170)*** (0.174)***
Professor 1.907 1.470 0.872 0.819 0.523 0.593
(0.192)*** (0.193)*** (0.184)*** (0.234)*** (0.212)** (0.221)***
Observations 3442 3442 3091 3091 3091 3091
Number of ID 348 348 325 325 325 325
Number of Instruments 220 133 256 305
AR1 test z (p-value) -5.09 (0.0000) -5.00 (0.0000) -5.05 (0.0000) -5.01 (0.0000)
AR2 test z (p-value) 0.87 (0.3850) 0.85 (0.3976) 0.99 (0.3242) 0.95 (0.3427)
Sargan test p-value 0.3923 0.1960 0.3396 0.7747
R-squared (within) 0.07 0.10
R-squared (between) 0.11 0.35
Standard errors are in parentheses. * significant at 10%; ** significant at 5%; *** significant at 1%