City, University of London Institutional Repository
Citation
:
Tzavaras, A. (2009). Intelligent Decision Support Systems in Ventilation Management. (Unpublished Doctoral thesis, City University London)This is the accepted version of the paper.
This version of the publication may differ from the final published
version.
Permanent repository link: http://openaccess.city.ac.uk/id/eprint/12084/
Link to published version
:
Copyright and reuse:
City Research Online aims to make research
outputs of City, University of London available to a wider audience.
Copyright and Moral Rights remain with the author(s) and/or copyright
holders. URLs from City Research Online may be freely distributed and
linked to.
Intelligent Decision Support Systems in
Ventilation Management
Aris Tzavaras
Supervised by Dr P.R. Weller
Submitted for the PhD degree
Centre for Health Informatics, City University, London
Table of Contents
LIST OF TABLES ... 5
ACKNOWLEDGEMENTS ... 10
DECLARATION ... 11
ABSTRACT ... 12
ABBREVIATIONS ... 13
1. INTRODUCTION ... 16
1.1AIMS AND OBJECTIVES ... 16
1.2METHODOLOGY ... 17
1.3REMAINDER OF THESIS... 19
1.4CONTRIBUTION... 20
2. BACKGROUND... 22
2.1MECHANICAL VENTILATORY SUPPORT ... 22
2.2VENTILATION MANAGEMENT ... 27
2.2.1 Decision Making - Ventilation Strategies – Protocols ... 28
2.3AN OVERVIEW OF COMMON LUNG PATHOLOGIES (ALI-ARDS&COPD) ... 31
2.4OVERVIEW &NECESSITY OF DECISION SUPPORT SYSTEMS (DSS) FOR MECHANICAL VENTILATION ... 32
2.5CLINICAL DECISION SUPPORT SYSTEMS (CDSSS) ... 37
3. REVIEW ... 41
3.1RELATED WORK ON MODELLING RESPIRATION PHYSIOLOGY & MECHANICAL VENTILATION CONTROL. ... 41
3.1.1 Mathematical Models of the Respiratory System and Classical Controllers. ... 41
3.1.2 Expert Systems for Ventilation Management. ... 47
3.1.3 Hybrid Models for Ventilation Management. ... 52
3.1.4 Fuzzy Systems for Ventilation Management. ... 55
3.1.5 Hybrid Approaches in other Medical Fields. ... 58
3.1.6 From theory to ICU clinical practice ... 62
4. METHODOLOGY ... 64
4.1METHODOLOGY STRATEGY ... 64
4.2METHODOLOGY OVERVIEW ... 66
4.2.1 Identification of key variables to the problem ... 66
4.2.2 Data collection ... 66
4.2.3 Database development ... 67
4.2.4 Data Analysis ... 67
4.2.5 Evaluation of data analysis ... 68
4.2.6 EVOFINE Toolbox development ... 68
4.2.7 FUN Toolbox development ... 69
4.2.8 Toolbox evaluation ... 69
4.2.9 Evaluation of systems architecture ... 69
4.2.10 Mechanical ventilation advisory models ... 70
4.2.11 Models’ evaluation ... 70
4.3RESEARCH ETHICS ... 71
5. QUESTIONNAIRE DEVELOPMENT & EVALUATION ... 72
5.1QUESTIONNAIRE ... 72
5.1.1 Development ... 72
5.1.2 Coding ... 74
5.2QUESTIONNAIRE RESULTS ... 75
5.3PATIENT DATA ... 85
5.4.1 Evaluation of Correlation Results ... 93
5.5MODELS’BASIC ARCHITECTURE ... 96
6. EVALUATION OF MODELS PERFORMANCE ON PATIENTS’ DATABASE ... 98
6.1OVERVIEW ... 98
6.2MODELS ARCHITECTURE ... 99
6.3TRAINING PROCESS ... 109
6.3.1 Evolution of FRBS, for modelling the Ventilation Management Process. ... 109
6.3.2 Training Process of the FUN ANN ... 111
6.3.3Training Process of the ANN ... 112
6.3.4Training Process of the ANFIS ... 116
6.4DISCUSSION ON FINAL ARCHITECTURES ... 120
6.4.1 Presentation of Resulted Architectures for FiO2 model for the COPD category. ... 120
6.4.2 Discussion on EVOFINE and ANFIS resulted Architectures ... 137
6.5MODELS PERFORMANCE ... 144
6.6INTELLIGENT MODELS ADVICE AGAINST CLINICIAN RECOMMENDATIONS ... 149
6.7PATIENT SCENARIOS ... 162
6.8MODELS’ SUGGESTIONS AND PEERS’ DISAGREEMENT ... 166
7. DISCUSSION... 180
7.1DISCUSSION KEY SUBJECTS ... 180
7.1.1 Discussion on methodology for limiting input variables ... 180
7.1.2 Artificial Intelligent Methods for model development ... 182
7.2MODELS’PERFORMANCE ... 186
7.2.1 EVOFINE models’ performance ... 186
7.2.2 FUN models’ performance ... 190
7.2.3 ANN models’ performance... 192
7.2.4 ANFIS models’ performance... 195
7.3METHODS COMPARISON ... 197
7.4COMPARISON TO OTHER AUTHORS ... 204
8. CONCLUSIONS ... 207
8.1EVALUATION FINDINGS ... 207
8.2FUTURE WORK ... 208
8.3CONTRIBUTION OF RESEARCH ... 210
8.4FINAL CONCLUSIONS... 211
CHAPTERS’ REFERENCE LIST ... 213
APPENDIX I: VENTILATION MONITORED VARIABLES AND CLINICAL TARGETS ... 219
I.1BLOOD GASES AND PH ... 219
I.2LUNG MECHANICS AND WORK OF BREATHING ... 223
I.3VOLUME,PRESSURE,FLOW AND RESPIRATION RATE. ... 227
I.4CARDIOVASCULARVARIABLES... 231
APPENDIX II: CUSTOM TOOLBOXES ... 233
II.1EVOFINE&FUNMATLAB TOOLBOXES ... 233
II.2FUZZY SYSTEM AND GENETIC ALGORITHM ... 233
II.2.1 Fuzzy Sets and Rules Coding. ... 236
II.2.2 Variable Mutation Rates... 239
II.2.3 Evolution algorithm. ... 240
II.2.4 Evolution and Computation resources ... 242
II.3NEURAL NETWORK DRIVEN FUZZY REASONING SYSTEM ... 245
II.3.1 FUN toolbox ... 246
APPENDIX III: EVALUATION - COMPARISON OF EVOFINE, FUN, ANN AND ANFIS. ... 251
III.2FUN EVALUATION ... 268
III.3ANNEVALUATION ... 280
III.4ANFISEVALUATION ... 287
III.5BENCHMARKING AGAINST OTHER AUTHORS AND COMPARISON OF DIFFERENT APPLIED METHODS ... 291
III.5.1 Discussion on methods efficiency... 292
APPENDIX IV: ARTIFICIAL INTELLIGENCE METHODS ... 296
IV.1FUZZY RULE BASED SYSTEMS (FRBSS) ... 296
IV.1.1 Fuzzy Logic Applications in Medicine ... 302
IV.2GENETIC ALGORITHMS (GAS) ... 304
IV.2.1 GAs Medical Applications ... 305
IV.3GENETIC -FUZZY SYSTEMS (GFS) ... 306
IV.3.1 Tuning the membership functions ... 308
IV.3.2 Tuning the scaling functions ... 309
IV.3.3 Tuning – optimizing the RB ... 309
IV.3.4 Genetic Learning of the FRBS ... 310
IV.4SYNERGISM OF FUZZY AND NEURAL METHODS. ... 313
IV.4.1 Neural Networks ... 313
IV.4.2 Synergism of Neural Nets and Fuzzy Systems... 314
APPENDIX V: TABLE OF PUBLISHED RESEARCH WORK ON VENTILATION MANAGEMENT ... 321
APPENDIX VI: QUESTIONNAIRE ... 325
APPENDIX VII: COLLECTED DATA RANGE ... 332
List of Tables
Chapter 2:Table 2.1: IDSS main categories (Taken from Tehrani F.T, Roum J.H, 2008) ... 35
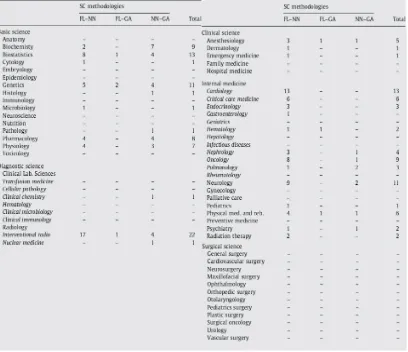
Table 2.2: Applications of Soft Computing in medicine (taken from Yardimci A, 2009) ... 40
Table 2.3: SC in medical disciplines (taken from Yardimci A, 2009) ... 40
Chapter 3: Table 3.1:Evidence level grades (taken from Branson RD, Joahannigman JA, 2004) ... 63
Chapter 5: Table 5.1: Variables’ grouping. ... 73
Table 5.2: Responders statistics. ... 75
Table 5.3: scoring of patient’s characteristics. ... 76
Table 5.4: scoring of variables groups. ... 78
Table 5.5: scoring of non-invasive variables. ... 79
Table 5.6: scoring of ventilator variables. ... 80
Table 5.7: scoring of invasive variables. ... 82
Table 5.8: scoring of ventilator settings... 82
Table 5.9: selected variables ... 84
Table 5.10:COPD example Patients’ database ... 87
Table 5.11: Patient records overview. ... 88
Table 5.12: correlation coefficients and P values for all categories... 92
Table 5.13: correlation coefficients and P values for all categories, for applied changes data set. . 93
Table 5.14: Evaluators’ scoring on correlation results. ... 95
Table 5.15:Models’ input-output variables based on evaluators voting. ... 97
Chapter 6: Table 6.1: Architecture –setup of EVOFINE models. ... 100
Table 6.2: Calculation of FUN Hidden Layers nodes. ... 103
Table 6.3: Architecture –setup of FUN models based on calculations from table 6.2... 103
Table 6.4: Calculation of hidden layer node number for the ANN. ... 104
Table 6.5: Architecture of ANN Kolmogorov & Normalized models for all categories. ... 105
Table 6.6: Architecture of ANN empirical models for all categories. ... 106
Table 6.7 : Comparison table for ANFIS architecture for the COPD models. ... 107
Table 6.8: Architecture of ANFIS models. ... 107
Table 6.9: Indication of measure for the rmse %. ... 110
Table 6.10: Presentation of rmse interpretation for given mse values. ... 112
Table 6.11: Performance, Normal Category, Training Set. ... 117
Table 6.12: Performance, COPD Category, Training Set. ... 118
Table 6.13: Performance, ALI-ARDS Category, Training Set. ... 119
Table 6.14: Rules and Fuzzy Sets of FiO2 COPD EVOFINE FRBSs of the first generation. ... 122
Table 6.15: Rules and Fuzzy Sets of FiO2 COPD EVOFINE FRBSs of the last generation. ... 123
Table 6.16: FiO2 COPD FUN NN model’s node weights and bias. ... 126
Table 6.17: FiO2 COPD NN Kolmogorov’s node weights and bias. ... 129
Table 6.18: FiO2 COPD NN Normalized model’s node weights and bias. ... 131
Table 6.19: FiO2 COPD NN Embirical model’s node weights and bias... 133
Table 6.20: Inference Engine for ANFIS FiO2 model for the COPD category. ... 137
Table 6.21: Performance, Normal Category, Evaluation Set. ... 146
Table 6.22: Performance, COPD Category, Evaluation Set. ... 147
Table 6.23: Performance, ALI-ARDS Category, Evaluation Set. ... 148
Table 6.24: COPD example of patient scenario. ... 163
Table 6.25: ICU doctors responses to patient scenarios and statistical analysis. ... 165
Table 6.26a: Models’ suggestions outside peer disagreement (peer SD), for VT and FiO2 ... 169
Table 6.26b: Models’ suggestions outside peer disagreement (peer SD), for RR and Pmax ... 170
Table 6.26c: Models’ suggestions outside peer disagreement (peer SD), for Fmax and PEEP ... 171
Appendix I:
Table I.1: Physiological values for blood gases ... 219
Appendix II: Table II.1: Rule description ... 238
Table II.2: coding of table II.1. ... 238
Table II.3: EVOFINE architecture scenarios. ... 244
Table II.4: Chromosome Lengths ... 244
Table II.5: Example of training data for the NN architecture of fig. 6.9 ... 248
Table II.6: FUN User defined NN functions. ... 249
Table II.7: FUN transfer functions. ... 249
Appendix III: Table III.1: EVOFINE experiment’s setup for the mathematical function. ... 253
Table III.2: System variables & constrains ... 258
Table III.3: Callinan testing setup ... 259
Table III.4: PD data base ... 261
Table III.5: Cart pole EVOFINE experiments ... 263
Table III.6: Evolved Rule Base, EVOFINE cart pole experiment 3. ... 264
Table III.7:Mathematical model, FUN Experiments Settings ... 270
Table III.8: FUN tested architectures for the cart pole system. ... 277
Table III.9: ANN architectures for the z=sin(xy) function. ... 280
Table III.10: ANN architectures for the cart pole system. ... 283
Table III.11: re-runs of ANNs tests... 286
Table III.12: ANFIS mathematical function test architectures... 287
Table III.13: Cart pole ANFIS models architecture. ... 290
Table III.14: Comparison of different methods... 293
Appendix IV: Table IV.1: FL categories ... 303
Appendix V: Table V.1: List of selected published research on mechanical ventilation support systems... 321
List of Figures
Chapter 2:Figure 2.1: Classification of mechanical ventilators ... 24
Figure 2.2: Ventilator block diagram. ... 25
Figure 2.3: (Top) baby lung algorithm. (Bottom) open lung approach ... 30
Figure 2.4: Diagram of open and close loop (dashed) systems. ... 34
Chapter 5: Figure 5.1: scoring of patient’s characteristics ... 76
Figure 5.2: scoring of variables groups ... 77
Figure 5.3: scoring of non-invasive variables ... 78
Figure 5.4: scoring of ventilation related variables answers. ... 80
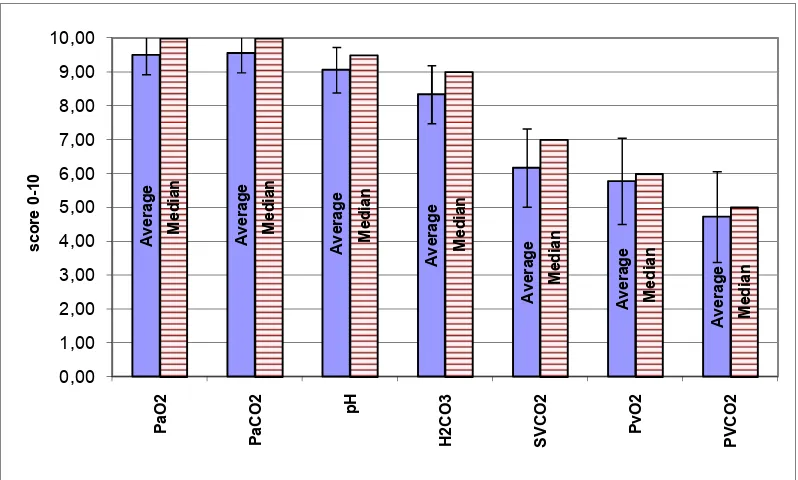
Figure 5.5: scoring of blood gases... 81
Figure 5.6: scoring hemodynamic variables ... 81
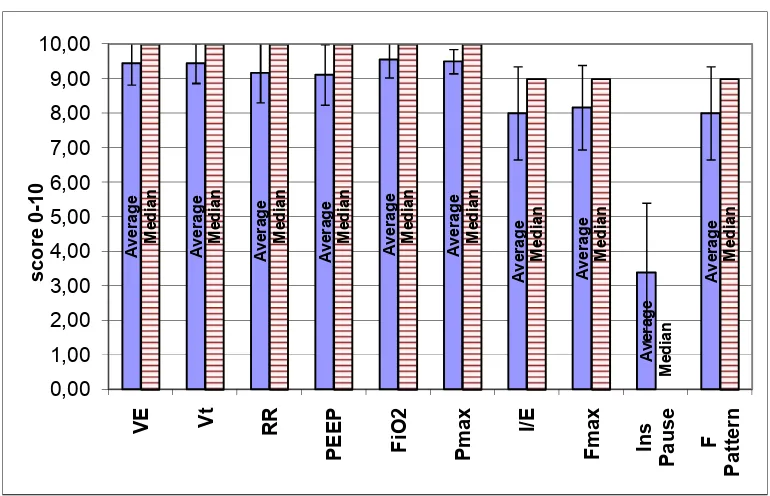
Figure 5.7: scoring ventilator settings... 83
Figure 5.8: Data acquisition Software interface from Ventilator apparatus. ... 86
Figure 5.9: Software data records. ... 86
Figure 5.10: Plimit & Fpeak sample FRBSs architecture for Normal Lungs. ... 96
Chapter 6: Figure 6.1: Graphical presentation of sample EVOFINE FRBSs evolution process. ... 110
Figure 6.2: Graphical presentation of sample FUN ANN training process. ... 111
Figure 6.3: Graphical presentation of sample ANN Kolmogorov training process. ... 113
Figure 6.4: Graphical presentation of FiO2 COPD EVOFINE FRBSs for the best individual of the first generation (top) and last generation (bottom). ... 121
Figure 6.5: Architecture of FUN model for FiO2 COPD category. ... 125
Figure 6.6: FiO2 COPD NN Kolmogorov’s architecture. ... 135
Figure 6.7: FiO2 COPD NN Normalized architecture. ... 135
Figure 6.8: FiO2 COPD NN Embirical architecture. ... 136
Figure 6.9: ANFIS FiO2 model for COPD category, input fuzzy sets and systems’ responce. ... 136
Figure 6.10: Resulted ANFIS FRBS architecture for the Pmax for the COPD Category. ... 138
Figure 6.11: Resulted ANFIS FRBS architecture for the PEEP for the COPD Category. ... 139
Figure 6.12: Resulted ANFIS FRBS architecture for the Fmax for the COPD Category. ... 139
Figure 6.13: Resulted ANFIS FRBS architecture for the VT for the ALI-ARDS Category. ... 140
Figure 6.14: Resulted ANFIS FRBS architecture for the PEEP for the ALI-ARDS Category... 140
Figure 6.15: Resulted ANFIS FRBS architecture for the Fmax for the ALI-ARDS Category. ... 141
Figure 6.16: Resulted EVOFINE FRBS architecture for the VT for the Normal Category. ... 142
Figure 6.17: Resulted EVOFINE FRBS architecture for the FiO2 for the Normal Category. ... 142
Figure 6.18: Resulted EVOFINE FRBS architecture for the Pmax for the Normal Category. ... 143
Figure 6.19: Resulted EVOFINE FRBS architecture for the PEEP for the ALI_ARDS Category. ... 143
Figure 6.20: Performance, Normal Category, Evaluation set. ... 145
Figure 6.21: Performance, COPD Category, Evaluation set. ... 145
Figure 6.22: Performance, ALI-ARDS Category, Evaluation set. ... 145
Figure 6.23: Model’s Output vs. clinical decisions for Tidal Volume in ALI-ARDS lung category. ... 153
Figure 6.24: Model’s Output vs. clinical decisions for Tidal Volume in COPD lung category... 153
Figure 6.25: Model’s Output vs. clinical decisions for Tidal Volume in Normal lung category. ... 154
Figure 6.26: Model’s Output vs. clinical decisions RR in ALI-ARDS lung category. ... 154
Figure 6.27: Model’s Output vs. clinical decisions RR in COPD lung category. ... 155
Figure 6.28: Model’s Output vs. clinical decisions RR in Normal lung category. ... 155
Figure 6.29: Model’s Output vs. clinical decisions FiO2 in ALI-ARDS lung category. ... 156
Figure 6.30: Model’s Output vs. clinical decisions FiO2 in COPD lung category ... 156
Figure 6.31: Model’s Output vs. clinical decisions FiO2 in Normal lung category . ... 157
Figure 6.32: Model’s Output vs. clinical decisions Pmax in ALI-ARDS lung category... 157
Figure 6.33: Model’s Output vs. clinical decisions Pmax in COPD lung category. ... 158
Figure 6.34: Model’s Output vs. clinical decisions Pmax in Normal lung category. ... 158
Figure 6.35: Model’s Output vs. clinical decisions Fmax in ALI-ARDS lung category. ... 159
Figure 6.36: Model’s Output vs. clinical decisions Fmax in COPD lung category. ... 159
Figure 6.38: Model’s Output vs. clinical decisions PEEP in ALI-ARDS lung category. ... 160
Figure 6.39: Model’s Output vs. clinical decision PEEP in COPD lung category. ... 161
Figure 6.40: Percentage of EVOFINE suggestions outside SD of peer disagreement. ... 172
Figure 6.41: Percentage of FUN suggestions outside SD of peer disagreement. ... 172
Figure 6.42: Percentage of NNs suggestions outside SD of peer disagreement. ... 173
Figure 6.43: Percentage of NNs suggestions outside SD of peer disagreement. ... 173
Figure 6.44: Scatter diagram of models’ vs clinical decisions for VT Normal ... 174
Figure 6.45: Scatter diagram of models’ vs clinical decisions for VT COPD ... 174
Figure 6.46: Scatter diagram of models’ vs clinical decisions for VT ARDS ... 174
Figure 6.47: Scatter diagram of models’ vs clinical decisions for RR Normal ... 175
Figure 6.48: Scatter diagram of models’ vs clinical decisions for RR COPD ... 175
Figure 6.49: Scatter diagram of models’ vs clinical decisions for RR ARDS... 175
Figure 6.50: Scatter diagram of models’ vs clinical decisions for FiO2 Normal ... 176
Figure 6.51: Scatter diagram of models’ vs clinical decisions for FiO2 COPD ... 176
Figure 6.52: Scatter diagram of models’ vs clinical decisions for FiO2 ARDS ... 176
Figure 6.53: Scatter diagram of models’ vs clinical decisions for Pmax Normal ... 177
Figure 6.54: Scatter diagram of models’ vs clinical decisions for Pmax COPD ... 177
Figure 6.55: Scatter diagram of models’ vs clinical decisions for Pmax ARDS ... 177
Figure 6.56: Scatter diagram of models’ vs clinical decisions for Fmax Normal ... 178
Figure 6.57: Scatter diagram of models’ vs clinical decisions for Fmax COPD ... 178
Figure 6.58: Scatter diagram of models’ vs clinical decisions for Fmax ARDS ... 178
Figure 6.59: Scatter diagram of models’ vs clinical decisions for PEEP COPD ... 179
Figure 6.60: Scatter diagram of models’ vs clinical decisions for PEEP ARDS ... 179
Chapter 7: Figure 7.1:Mean % mae of EVOFINE models. ... 187
Figure 7.2:Training time of EVOFINE models; y axis is time hours:min:sec ... 187
Figure 7.3: Evolution of RR (ALI-ARDS) for 100 (top) and 500 (bottom) generations. ... 188
Figure 7.4: VT and RR model for ARDS category. ... 189
Figure 7.5: Near of Maxima defuzzification technique vs Middle of Maxima MOM . ... 190
Figure 7.6: Mean % mae of FUN models. ... 191
Figure 7.7:Training Time for FUN models. ... 191
Figure 7.8:Mean % mae of ANN models. ... 192
Figure 7.9: Computation time of ANN models... 193
Figure 7.10:mean % mae of ANFIS models ... 195
Figure 7.11: Computation time for ANFIS models. ... 196
Figure 7.12:Mean % mae of models tested against the evaluation set. ... 199
Figure 7.13:Mean % mae of models tested against the training set. ... 200
Figure 7.14:Mean % mae of models in all categories and in all data sets. ... 201
Figure 7.15: mean models’ training time in seconds for all categories and in all data sets. ... 201
Appendix I: Figure I.1: Oxyhemoglobin dissociation curve. Shift caused by pH changes. ... 220
Figure I.2: Pressure & flow curves, recorded from ICU patient. ... 228
Appendix II: Figure II.1: Snap shot of EVOFINE toolbox. ... 235
Figure II.2: Trapezoid–Triangular membership functions coding. ... 238
Figure II.3: Sigmoid-Gaussian membership functions coding. ... 238
Figure II.4: Example of variable mutation rates, for UserDefinedMUTrate=0.5. ... 239
Figure II.5: Graphical example of Rules Crossover. ... 240
Figure II.6: Flow diagram of the EVOFINE software. ... 241
Figure II.7: Graphical User Interface of FUN. ... 247
Figure II.8: NN driven FRBS architecture. ... 247
Figure II.9: Example architecture of NN driven FRBS. ... 248
Figure II.10: FUN toolbox flow diagram... 250
Appendix III: Figure III.1: Graphical representation of function z=sin(x*y). ... 251
Figure III.3: effect of initial damping mutation rate in the performance of the resulted FRBS. ... 254
Figure III.4: effect of number of fuzzy sets in the performance of the resulted FRBS. ... 255
Figure III.5: Performance of evolved FRBSs, for eq. III.3. ... 256
Figure III.6: minimum fitness values of FRBS with different mutation types... 256
Figure III.7: Graphical representation of FRBS output for modelling MISO system (z=sin[xy]) ... 257
Figure III.8: Graphical simulation of cart pole dynamic system. ... 258
Figure III.9: Feedback linearization controller performance. (top angle, bottom position). ... 260
Figure III.10: Training data generation based on the feedback linearization controller. ... 260
Figure III.11: Evolution process for FRBS cart pole controller ... 262
Figure III.12: Example of evolved architecture of EVOFINE FRBS, experiment 3. ... 263
Figure III.13: EVOFINE, cart pole controller performance; balances pole, experiment 3. ... 265
Figure III.14: EVOFINE, cart pole controller performance; fluctuating pole, experiment 2. ... 265
Figure III.15: Membership Functions (MFs); experiment 8, experiment 10. ... 269
Figure III.16: Training performance; experiment 8, experiment 12. ... 273
Figure III.17: Training performance, experiment 8, experiment 13, experiment 20. ... 274
Figure III.18: Surface mapping of FUN performance for z=sin(x*y); ... 275
Figure III.19: Surface mapping of FUN performance for z=sin(x*y); ... 276
Figure III.20: Graphical representation of FUN 1 architecture. ... 278
Figure III.21: Cart Pole results of FUN 3 architecture. ... 279
Figure III.22:Basic Architecture of the ANN. ... 281
Figure III.23: Surface mapping of ANN performance for z=sin(x*y);... 282
Figure III.24: Effect of hidden node number to ANN performance. ... 284
Figure III.25: ANN performance for the cart pole system; ... 285
Figure III.26.: surface mapping of ANFIS performance for z=sin(x*y) ... 289
Figure III.27 : ANFIS cart pole models performance; ... 290
Figure III.28 : ANFIS experiment 1, resulted FRBS architecture. ... 291
Appendix IV: Figure IV.1: FRBS for patient ventilation control... 297
Figure IV.2: Crisp to Fuzzy. ... 297
Figure IV.3: Graphical Inference Representation of example. ... 300
Figure IV.4: Graphical Representation of defuzzification methods. ... 301
Figure IV.5: Articles containing the keywords “fuzzy AND medical”, in NCBI query. ... 302
Figure IV.6: Published work on fuzzy – medical, according to publication year and category. ... 303
Figure IV.7: Schematic representation of a neuron. ... 314
Figure IV.8: Cascaded systems. ... 316
Figure IV.9: Architecture of the neural-fuzzy network proposed by XZ Wang et al. ... 317
Acknowledgements
I would like to thank my supervisor Dr P.R.Weller for his guidance and support in
the completion of my thesis.
I would also like to thank Dr B. Spyropoulos for assisting my efforts in the pursuit of
my PhD degree, and the ICU medical staff of the Konstadinoupolio (former Ag.
Olga) General Hospital of Athens, University Hospital of Heraklion Crete (PAGNI),
and the Veteran’s General Hospital of Athens (NIMITS) for their active participation
in my research.
Last but not least I would like to express my gratitude to my parents for their
emotional and financial support, and to Sia who has been supportive throughout my
Declaration
I hereby declare that I grand power of discretion to the University Librarian to allow
the thesis to be copied in whole or in part without any further reference to the author.
This permission covers only single copies made for study purposes, subject to
Abstract
Introduction: Intensive Care Unit (ICU) medical personnel, in an ongoing process termed
ventilation management, utilize patient physiology and pathology data to define ventilator
apparatus settings.
Aims: The aim of the research is to develop and evaluate in comparison hybrid ventilation
advisor systems, that could support ventilation management process, specific to lung
pathology for patients ventilated in control mode.
Methodology: A questionnaire was designed and circulated to Intensivists. Patient data, as
defined by the questionnaire analysis, were collected and categorized into three lung
pathologies. Three ICU doctors evaluated correlation analysis of the recorded data.
Evaluation results were used for identifying models basic architecture. Two custom software
toolboxes were developed for developing hybrid systems; namely the EVolution Of Fuzzy
INference Engines (EVOFINE) and the FUzzy Neural (FUN) toolbox. Eight hybrid systems
developed with EVOFINE, FUN, ANFIS and ANN techniques were evaluated against
applied clinical decisions and patient scenarios.
Results: Seventeen (17) models were designed for each of the eight (8) modeling
techniques. The modelled process consisted of twelve physiology variables and six
ventilator settings. The number of models’ inputs ranged from single to six based on
correlation and evaluation findings. Evaluation against clinical recommendations has shown
that ANNs performed better; mean average error as percentage for four of the applied
techniques was 0.16%, 1.29% & 0.62 for ANN empirical, 0.05%, 2.23% & 2.30% for
ANFIS, 0.93%, 2.33% & 1.89% for EVOFINE and 0.73%, 2.63% & 6.56 for FUN NM, in
Normal, COPD and ALI-ARDS categories respectively. Additionally evaluation against
clinical disagreement SD has shown that 70.6% of the NN empirical models were
performing in 90% of their suggestions within clinical SD, while the percentages were 53%,
53% and 59% for the EVOFINE, ANFIS and NN Normalized models respectively. The
EVOFINE and ANFIS produced Fuzzy Systems whose architecture is transparent for the
user. Visual observation of ANFIS architectures revealed possibly hazardous advices.
Evaluation against clinical disagreement has shown that the NN empirical was not producing
hazardous advices, while EVOFINE, ANFIS and NN Normalized were shown to produce
Abbreviations
A Alveolar
a Arterial
ALI Acute Lung Injury
ANFIS Adaptive network based fuzzy inference system
ANN Artificial Neural Network
APRV Airway Pressure Release Ventilation
ARDS Acute respiratory distress syndrome
C Airway & Lung Compliance
CI cardiac index
CDSSs Clinical Decision Support Systems
CMV Continious Mandatory Ventilation
CO Cardiac Output
COPD Chronic obstructive pulmonary disease
CPAP Continious Paositive Airway Pressure
CRS Respiratory system static compliance
CVP Central venous pressure
DB Data Base
E Elastance = 1/C
EA Evolutionary Algorithms
EC Evolutionary Computation
ECG Electrocardiogram
ET endotrachial tubing
ETCO2 End tidal capnography
EVOFINE EVolution Of Fuzzy INference Engines
F Gas Flow
FiO2 Fraction of Inspired Oxygen
FL Fuzzy Logic
FLC Fuzzy Logic Controller
Fmax Flow Limitation, ventilator setting
FRBS Fuzzy Rule Based System
FRC Functional Residual Capacity
FS Fuzzy Set
FUN FUzzy Neural toolbox, training NN driven FL
G Conductance = 1/R
GA Genetic Algorithm
Gfuzzy Genetic Fuzzy Algorithm
HCO3- bicarbonate
I/E Inspiratory (time) / Expiratory (time) ratio
ICU Intensive Care Unit
IDSSs Intelligent Decision Support Systems
IMV Intermittent Mandatory Ventilation
IPPB Intermittent Possitive Pressure Breathing
IPPV Intermittent Possitive Pressure Ventilation
KB Knowledge Base
mae mean absolute error
MMV Mandatory Minute Volume
mse mean square error
Neural Neural Network
NoM Nera of Maxima defuzzification technique
OI Oxygenation Index
P Pressure
PaCO2 Arterial Carbon Dioxide tension
PACO2 Alveolar Carbon Dioxide tension
Pao airway opening pressure
PaO2 Arterial Oxygen tension
PAO2 Alveolar Oxygen tension
PAP pulmonary artery pressure
Pb barometric pressure
PCWP pulmonary capillary wedge pressure
PEEP Positive End Expiratory Pressure
Pex Expiratory pressure (total PEEP)
pH a measure of the activity of hydrogen ions (H+) in a solution and, therefore, its acidity. pH=-log(H+)
PH2O water vapor pressure (47mmHg at 37o C)
PIP Peak Inspiratory Pressure
Pmax Pressure Limit, ventilator setting
Ppl pleural pressure
Pplateau end inspiratory pressure
PSV Pressure Support ventilation
Q Blood Volume
R Airway & Lung Resistance
Raw Airway resistance
RB Rule Base
RI Respiratory Index
rmse root mean square error
RR Respiration / Breathing Frequency in breaths per minute (BPM)
SaO2 Oxygen Saturation of the hemoglobin of arterial blood
SC Soft Computing, synergy of Artificial Intel. techniques
SIMV Synchronized IMV
SOFLC Self Organizing fuzzy logic controller
SpO2 Oxygen Saturation as measured by pulse oximetry
T Temperature
TI Inspiration time
TSK Takagi-Sugeno-Kang model
V Gas Volume
v Venous
V/Q ventilation-perfusion ratio
VCO2 CO2 production
VD Physiologic Dead Space
VD Dead Space volume
Ve Expired Volume / min
VE Minute Ventilation (L/min)
VO2 oxygen consumption
VO2resp Oxygen cost of breathing
Vpk peak flow (L/min)
VT Tidal Volume
WOB Work of breathing
1. Introduction
Mechanical ventilation support is provided to critically ill ICU patients who are
unable to maintain gas exchange. ICU Clinicians monitor and evaluate
cardio-respiratory related physiology variables, in order to evaluate adequacy of mechanical
ventilation. Since a patient’s needs are continuously changing, clinicians have to
adapt the ventilation strategy and drug administration on a regular basis. This
ongoing process is described as ventilation management.
Clinicians examine physiology variables, and search for the optimum solution for the
patient specific pathology. Due to the nature of the cardio-respiratory physiology, the
number of involved variables is high. This is also true of the possible interventions
(solutions) available to a clinician. An optimum set of ventilation variables is not
described by a single solution, but rather by a range of solutions that could be
beneficial to the patient.
The above process could be described as a search for an optimum solution to a
clinical problem, which utilizes a large number of input variables (search space).
Different methods have been applied for modelling mechanical ventilation. Tehrani
and Roum (Tehrani F.T, Roum J.H, 2008), provide an overview of different methods in
intelligent decision support systems (IDSSs) for the mechanical ventilation. Authors
compare different methods from 1985 to present. Three categories of basic
architectures are identified by the authors; namely Rule-based, Model-based and
Rule-based plus model-based. IDSSs utilize available clinical and engineering
knowledge for improving respiratory care. Intelligent systems provide a promising
tool for the ICU clinicians for improving respiratory care quality, decreasing
workload and minimizing medical errors.
1.1 Aims and objectives
The aim of the research is to develop, implement and evaluate hybrid intelligent
decision support methods for ventilation management. This core research aim will be
addressed with the following objectives:
A literature review of current research into intelligent mechanical ventilation.
Establishment of a verified patient data library based on the optimal variables.
Development of hybrid systems for decision support problems.
Evaluation of the systems on established benchmarks.
Development of dedicated hybrid systems for ventilator management of a set
of lung pathologies.
Comparison of the performance of the hybrid systems with ICU domain
experts.
1.2 Methodology
The proposed approach develops and evaluates models’ performance based on the
autonomous and synergetic use of genetic algorithms (GAs), neural networks (NN)
and fuzzy logic (FL). This consortium of methodologies is commonly referred as
Soft Computing.
The models are applied on control ventilated patients. The models do not account for
temporal changes in data sets but the data presented to the models represent specific
time instances of the physiology variables in a way similar to the method
experienced intensivist apply changes to ventilator settings.
Development and optimization of hybrid systems requires first the identification of
the appropriate input – output variables, second the evaluation of available
architectures and decision making on the adapted system’s architecture, and finally
training and evaluation of the system with the assistance of experimental – recorded
data. Input and output variables for the models were identified with the statistical
analysis of questionnaires, developed for this purpose and circulated to eighteen (18)
ICU doctors of three general hospitals. Questionnaire variables that scored high were
candidates for participating in the development of the hybrid systems. These
variables were collected in real ICU settings in two hospitals in Greece. Data
recorded were used to establish the patients’ database. Patients were further
categorized into three major lung pathologies, namely COPD, ALI-ARDS and
normal lungs. The purpose of this categorization was the difference in ventilation
protocols among the different pathologies. Recorded data were randomly allocated
into training (60%) and evaluation (40%) sets.
Collected data were further analyzed for identifying strong relationships between
the assumption that clinical decision making on ventilator settings is based on a
subset of monitored physiology variables. Correlation results were evaluated by
three ICU doctors from three different hospitals. Monitored variables that exhibited a
high correlation degree (Correlation coefficient >0.5) and were accepted by the
majority of the evaluators, were chosen to participate as inputs to the systems.
Two custom toolboxes were developed. The first was named EVOFINE (EVolution
Of Fuzzy INference Engines) and utilizes Genetic Algorithms for identifying the
optimum fuzzy system, based on available input-output training data. The second
was named FUN (FUzzy Neural), and utilized a NN for substituting the rule base
(RB) of a fuzzy system providing to the system the ability to learn from a given
input-output data set. Both toolboxes were evaluated for their performance on non
linear mathematical function and the cart pole system, prior to their application.
Experiments were carried out for identifying the most efficient architecture of all the
components involved in the hybrid systems. Evaluation of different architectures
suggests that Evolved FRBSs perform adequately with a subset of the Rule Base,
damping mutation rates reach faster an optimum solution and moderate number of
Fuzzy Sets reduces complexity and increases performance. Similarly experiments
performed on FUN architectures revealed that the choice of defuzzification
technique is the determinant factor of model’s performance. ANFIS and ANN
performance was also tested against the same modelling problems and optimum
architectures were identified. Neural networks with increased number of nodes and
hidden layers, but sufficiently low to avoid overtraining, performed better.
EVOFINE and FUN were benchmarked against the well established NN and ANFIS
techniques. EVOFINE performed close to benchmarks while FUN could not succeed
in cart pole stabilization.
Utilizing the recorded data training sets and the evaluation findings from the
correlation analysis, different soft computing techniques have been applied for
modeling the ventilation management process; namely EVOFINE, FUN, ANN and
ANFIS. The resulted models were evaluated against the evaluation set. The
performance of the models against the data set was measured in terms of mean
square error and mean average error. Although the error between models’
suggestions and clinical decisions is an important indicator of model’s performance,
it provides little evidence on whether the results are clinically acceptable. In order to
scenarios and were asked to advice on ventilator settings. The difference in their
clinical decisions was analyzed for identifying the clinically acceptable difference
among peers. The analysis of clinical decisions was used as measure of the models’
performance.
1.3 Remainder of thesis
The thesis is organized into eight (8) chapters:
Chapter 2 presents background information necessary for the reader to understand mechanical ventilation principles and ICU decision making methods. The
introduction to ventilation management is followed by a brief review on the
necessity of clinical decision support systems in the ICU. The final part of the
chapter describes briefly the methods used in clinical intelligent decision support
systems, emphasizing to the soft computing methods.
Chapter 3 provides a literature review on respiration physiology models and mechanical ventilation controllers. Key research approaches and relevant research
work undertaken by other authors is reviewed for the following approaches:
Mathematical models and classical controllers, Expert systems, Hybrid and Fuzzy
systems.
Chapter 4 describes the methods used for designing intelligent ventilation decision support systems. Specifically it describes the method for minimizing the systems’
architecture, the method of data collection and analysis, the evaluation process, the
custom hybrid models toolboxes development as well as the research ethics.
Chapter 5 presents the questionnaire development and evaluation. Based on the results of the questionnaire analysis, the data collection process is described. The
final part of this chapter describes the analysis performed on collected data for
further minimizing the models’ architecture.
Chapter 6 describes the process of development, training and evaluating the hybrid systems against the recorded patient data. Evaluation of the EVOFINE, FUN, ANFIS
and ANN systems is visually and numerically performed against clinical decision in
the ICU. Furthermore the developed models are evaluated against ICU peers
disagreement acquired based on real patient scenarios.
Chapter 7 presents and comments on the research findings. Research is discussed in terms of methodology used, models development and performance and comparison
Chapter 8 is presenting conclusions about the methods and the outcome of the research, providing insights of possible future applications and research work.
Appendix I provides the reader with detailed information on the clinical aspects of ventilation management.
Appendix II describes the architecture of the Matlab custom toolboxes developed for the purpose of the research.
Appendix III, evaluates the custom toolboxes against benchmark problems. The performance of the toolboxes is compared to established modelling methods, namely
ANFIS and NNs.
Appendix IV provides the reader with additional information on the theory of AI methods.
Appendix V, provides a summary table (table V.1) of published research on ventilation management as well as the results.
Appendix VI presents the questionnaire used for collecting expert’s opinion on ventilation management variables relative significance.
Appendix VII provides a table (VII.1) with the range of physiology variables and ventilator settings.
1.4 Contribution
Intelligent Decision Support (IDS) of ventilation management is a complex
engineering problem involving a high number of participating variables, clinical
expertise and human cardio-respiration physiology. The proposed research suggests
a solution to the problem by introducing a two step method for modeling the
ventilation management process.
Step one, is reducing the complexity of the problem. Since the number of
participating variables is very high, the proposed approach decreases problem’s
search space by limiting the number of participating variables with the assistance of
a questionnaire, correlation analysis and evaluation. Furthermore the proposed
approach is designed to be pathology specific due to the differences in ventilation
strategy according to pathology.
Data collected from three ICUs formed a real patient data base for three common
lung pathologies. The developed database will be available to research community.
answers provides future researchers with appropriate input variables for each of the
evaluated ventilator settings.
Step two evaluates the appropriateness of different soft computing methods for the
task. Different soft computing techniques (EVOFINE, FUN, ANNs and ANFIS)
have been applied and evaluated in parallel, for modelling the ventilation
management process rather than the physiology, providing future research with
sufficient evidence on the appropriateness of each technique for the task. The
proposed approach is designed for modeling six rather than a single ventilator
setting, providing a more holistical approach to ventilation management.
Additionally to the well established soft computing methods a new method for
evolving FRBSs was suggested, and a new toolbox was designed and developed.
EVOFINE was tested on benchmarking complex engineering problems in order to
evaluate its’ performance. The suggested evolution process has been shown to
sufficiently map complex problems. Furthermore variable damping mutation rates
have been applied. Results suggested that damping mutation rates reach an optimum
2. Background
2.1 Mechanical Ventilatory Support
The major function of the respiratory system is to supply tissues with oxygen and
dispose of carbon dioxide generated by metabolism.
Respiration includes four distinct processes, the pulmonary ventilation which is air
movement into and out of the lungs, the External respiration which describes the
gas exchange between blood and the alveoli air, the Transport of gases which is the
transportation of blood gases between tissues and the lungs, accomplished by the
cardiovascular system, and the Internal respiration, which describes cellular
respiration, the exchange of gases between blood and cells (Marieb E.N. 1995).
Breathing, a term used to describe pulmonary ventilation, is a mechanical process
divided into two phases. The inspiration phase is an active process leading to the
enlargement of the thoracic cavity. During quiet breathing the intrapleural pressure
decreases to about -6 mmHg (relative to atmospheric) and lungs expand. Airway
pressure becomes negative in respect to atmospheric and air flows into the lungs
(Ganong W.F. 1975). Expansion of thoracic cavity is accomplished with the activation of inspiratory muscles. The Diaphragm accounts for 75% of the change of
intrathoracic volume during quiet breathing, while intercostals muscles contract to
expand the thorax both laterally and in the anteroposterior plane (Ganong W.F. 1975).
During quiet breathing the inspiration muscles activation expand the thoracic
dimensions by few millimeters along each plane, as a result intrapulmonary pressure
drops about 1 mmHg relative to atmospheric. The above process is described by
Boyle’s Law assuming that temperature is constant.
The quiet expiration phase in healthy individuals is a passive process that depends on
lung elasticity. Inspiratory muscles relax and thoracic and intrapulmonary volumes
decrease. Intrapulmonary pressure increases to about 1 mmHg above atmospheric,
forcing gases out of the lungs.
Mechanical ventilatory support (which will be described from now as mechanical
ventilation), is initiated when a patient’s ability to maintain gas exchange has failed.
Respiratory failure is categorized mainly to Hypoxemic and Hypercapnic.
pump. The term pump describes the mechanical and the neural control of respiration.
Pump failure is described usually by a combination of failures such as:
Inadequate muscle function: causes might be malnutrition, inadequate electrolyte
balance, use of drugs such as calcium channel blockers.
Excessive ventilatory load: patients with chronic obstructive disease increase
load due to secretion accumulation, mucosal edema or bronchospasm.
Impaired neuromuscular transmission and/or compromised central drive: drugs
may depress or increase ventilatory drive. Metabolic acidosis could cause
hypercapnia, resulting to dyspnea anxiety with increase respiration rate.
Hypoxemic failure is the failure to maintain arterial oxygenation. The basic
mechanisms for this are the Ventilation-perfusion mismatch, right-left shunt,
alveolar hypoventilation, diffusion effect and low concentrations of inspired O2,
termed as Fraction of Inspired Oxygen (FiO2). Hypoxemia does not always call for
mechanical ventilation; it is treatable with oxygenation support devices such as
oxygen supply masks and continuous positive airway pressure (CPAP).
Support of patients with respiratory failure is given by medical devices described as
mechanical ventilators, or artificial ventilators. The majority of mechanical
ventilators provide the patient with a user defined mixture of fresh gases, by
applying positive pressure in the upper airways. Since the pressure is above
atmospheric, air flows into the lungs causing them to expand. Usually during the
expiration phase pressure levels at the upper airways drop at atmospheric or
maintained above atmospheric levels. The latter methodology is called Positive End
Expiratory Pressure, abbreviated as PEEP. However this process is the invert of the
physiological one, where inspiration is initiated due to sub-atmospheric pressure in
lung compartment. This inversion is the cause of ventilator induced lung injuries.
Barotraumas and volume trauma are lung injuries caused by alveolar
over-distension; the former is due to excessive pressure and the latter due to high volume.
Limiting maximum pressure and volume is the obvious solution to lung injuries.
However limitation of these variables is not always advised due to abnormal lung
mechanical properties. The reduction of cardiac output (C.O.) related to the
increased intrathoracic pressure is another ventilator induced problem. Reduction is
caused by the increased pulmonary vascular resistance, which decrease left
decreases venous blood return to the heart. To decrease the effect of positive
pressure ventilation on C.O., intensivists maintain a low mean airway pressure.
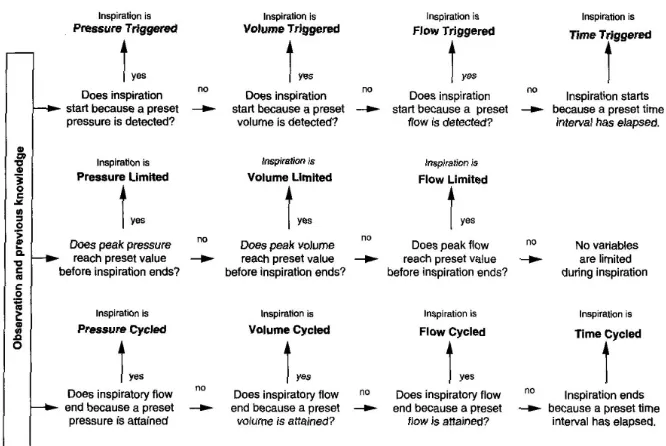
Positive pressure ventilators are classified according to control variables, phase
variables and conditional variables. Control variables remain constant as the
ventilatory load changes. According to this classification a ventilator could be
pressure, volume, flow or time controlled. This is interpreted as maintaining a supply
of gas mixture, during the inspiration phase, until a predefined level of the control
variable is reached. Phase variables initiate some phase of the ventilation cycle.
Phase variables are trigger, limit and cycle. Inspiration triggering could be voluntary
from the patient, detected as drop in airway pressure or as gas flow into the lungs, or
time triggered, controlled by the clinician. The limit variable is a threshold that
cannot be exceeded. Inspiration phase is not always terminated when the limit is
reached. Cycle variable terminates the inspiration when a threshold is reached.
Conditional variables are those controlled by the ventilator logic. Synchronization to
patient’s efforts, permission for spontaneous breaths, and mandatory ventilation are
examples of conditional variables. The flow chart in figure 2.1, taken from Hess and
Kacmarek (Hess D.R., Kacmarek R.M. 2002), is a diagram for classifying mechanical
[image:25.595.113.446.468.691.2]ventilators.
Ventilators are further classified according to drive mechanism (McPherson S.P. 1995). Driving mechanism describes the technology of producing airflow into the lungs.
The drive could be pneumatic, low or high pressure applied directly to the upper
airways, Electric, usually pistons and compressors driven by servo or other electrical
motors, and Bellows where high or low pressure is applied in the bellows chamber
forcing it to collapse.
A modern ventilator is described as a block diagram in figure 2.2. The main modules
of the ventilator are the Control Unit, a user interface for selecting settings, viewing
variables and waveforms, and selecting modes of operation, a mixer, responsible for
providing the correct concentrations of gases (Usually 100% O2 with atmospheric air
although Nitric Oxide was introduced lately to ICUs), the drive mechanism and the
[image:26.595.152.495.368.595.2]transducers for collecting flow, pressure, volume and oxygen concentration signals.
Figure 2.2: Ventilator block diagram.
Ventilators are capable of functioning as controllers, and/or assist devices. Several
modes of operation have been developed in the last years, each having unique
features designed for different respiratory problems and ventilation phases. The
Control ventilation: ventilator delivers preset volume or pressure controlled
breaths, in predefined time intervals. Minute ventilation ( E o
V
) is given by theproduct of tidal volume (VT) multiplied by the respiration rate (RR):
RR V VE T *
0
eq. 2.1
Assist ventilation: ventilator detects patient’s effort for inspiration, either as pressure drop or flow at the upper airways, and provides pressure or volume
controlled ventilation.
Continuous Mandatory Ventilation (CMV): is an assist – control mode, were the
clinician provides with a minimal rate of control ventilation, while the patient
can trigger inspiration at a more rapid rate.
Intermittent Mandatory Ventilation (IMV): delivers breaths at a set frequency
similar to control mode. However the patient can breathe spontaneously between
control breaths from a reservoir or demand system.
Synchronized IMV (SIMV): works similar to assist mode. The difference is that
it divides each minute into cycled time and to time where the patients effort to
breathe will be assisted by synchronized mandatory breath. If patients fail to
initiate a breath, for a given period, the system delivers mandatory breaths.
Mandatory Minute Volume (MMV): system allows the patient to breath
spontaneously. If the volume of spontaneous breaths has not reached a
predefined threshold, then the remaining volume is provided mandatory.
Continuous Positive Airway Pressure (CPAP): this is a spontaneous breathing
mode. Clinicians decide upon a level of positive pressure throughout the
ventilation cycle.
Pressure Support ventilation (PSV): in this mode patient initiates inspiration
phase. The ventilator assists the patient’s effort until a predefined pressure level
is reached. Some ventilators incorporate CMV, in case of patient’s apnoea.
Airway Pressure Release Ventilation (APRV): this is actually a CPAP mode
which periodically lowers the pressure level to atmospheric level. This allows
patient to exhale higher volumes; as baseline is restored patient is ventilated with
higher volumes.
High Frequency Ventilation (HFV): ventilates patients at high rates (above 60
Additionally to ventilation modes there are modifications to ventilation support.
Positive End Expiratory Pressure (PEEP) is blocking exhalation when a preset
pressure level is reached. Similar to PEEP is the Expiratory Retard, in which a
resistance is applied to expiration tract, to maintain positive pressure in alveoli and
prevent collapse. Inspiratory Hold (Pplateau) is a pause between inspiration and
expiration phase, which allows gases to diffuse better in the alveoli.
The choice between mandatory and assist-spontaneous ventilation is patient specific.
Mandatory ventilation is provided to patients with drug suppressed ventilation
trigger, or when clinicians attempt to minimize breathing effort. Partial support is
often used during weaning process. Weaning describes the phase of discontinuation
of ventilation. In patients with Acute respiratory distress syndrome (ARDS), and
Chronic obstructive pulmonary disease (COPD), control-assist modes are suggested
such as CMV.
2.2 Ventilation Management
The care of critical ill mechanically ventilated patients requires regular gathering of
clinical data for the evaluation of the ventilation strategy. Clinicians utilize the
pathology and physiology data available for adapting ventilator settings to patient’s
needs. This process is described in bibliography as patient or ventilation
management.
Patient’s needs are continuously changing, and for this reason ventilation
management is an ongoing process. The periods of evaluation range from several
minutes to hours, depending on patient’s health status and ventilation phase. It is
common when clinicians initiate mechanical ventilation, to collect and evaluate data
regularly, intervals of 15 to 30 minutes, in the first few hours, until the patient’s
physiology variables are stable. Time intervals between evaluations also adapt to
changes in ventilation strategy. Frequent intervals are used when decisions are made
for changes of ventilation modes.
Decision making of ICU clinicians concerning changes in ventilation support and
drug administration, is supported by available clinical data, experience, and
protocols. Appendix I provides with a detailed description on monitoring variables
2.2.1 Decision Making - Ventilation Strategies – Protocols
The changes performed on ventilation settings and drug administration related to
ventilation adequacy, are made based on a strategy. The strategy could be based on
knowledge, expertise and experience, or on available guidelines and protocols, or
more often as a combination of both.
Hancock and Durham (Hancock H.C., Durham L., 2007) addressed the theoretical
background of clinical decision making. Three different approaches are described in
the literature. These are: Analytical methodology, which is a linear process involving
assessment of alternatives and selection of a course of action; Intuition, which is a
holistic consideration of situations based on experience; practitioners have developed
knowledge structures, enabling them to respond to a problem with the use of
accumulated experience; and cognitive continuum theory which suggests that
decision making is somewhere between the analytical and intuitive ends.
In contradiction to the theoretical approach of clinical decision making by Hancock
and Durham (Hancock H.C., Durham L., 2007), Taylor (Taylor F, 2006) reported that ICU
staff utilizes in action different approaches in decision making. He identified that
hypothetico-deductive approach, concept of balance, pattern matching, intuition and
trial and error, were used by the clinical staff participated in the research.
The subjective nature of decision making, as well as the multi-parametric nature of
the ventilation management process, generates the need of protocols and guidelines.
Carson et al (Carson E.R. et al 1991) focus on the need of converting measured data into
information for clinicians. Their argument was supported by the substantial increase
in the number of measured, derived and alarm variables in the ICU, over the past
decades. Since humans have limited ability to estimate covariance between multiple
variables (Morris A.H, Cook D.J, 1998), guidelines are necessary. Hypothesis, memory recall, prejudice, local cultural factors, local technical abilities and experience are all
factors influencing caregiver decisions in the ICU.
Protocols usually present either as paper based flow diagrams, or paper -
computerized decision support trees. Such algorithms developed for the ICU setting
usually contain fuzzy terms such as “optimize PEEP”, which cannot be translated
into executable instructions (Morris A.H, Cook D.J, 1998). Even more when decision trees are developed, it is difficult to implement them in different patient-clinical
guidelines is associated with great variation in practice, due to individual clinical
practice styles (Morris A.H, Cook D.J, 1998).
A different treatment strategy is adopted according to patient pathology. The most
common health related patient categories found in ICU and potentially require some
form of ventilation support, are the following (from: Hess D.R., Kacmarek R.M. 2002):
Acute Lung Injury - Acute respiratory distress syndrome (ALI-ARDS).
Chronic obstructive pulmonary diseases (COPD).
Chest Trauma.
Head Injury.
Postoperative patients.
Neuromuscular disease and chest wall deformities.
Cardiac failure.
Asthma.
Burns and inhalation injury.
Bronchopleural fistula.
Drug overdose.
Although protocols - guidelines have been developed, there are diverse methods for
dealing with the same problem (Brochard et al., 1994, Butter R et al., 1999, Horst H.M, 1998). The controversy surrounding mechanical ventilation is illustrated on ARDS
ventilation management, thus reflecting a more general problem. ARDS is
approached mainly by two different strategies. The open lung approach targets a
specific pressure with pressure controlled ventilation (Amato M.B.P et al., 1998,
Papadakos P.J, Lachmann B, 2002). High respiratory rates, high PEEP and permissive hypercapnia are used to maintain alveolar recruitment. A second approach named
ARDSnet, or baby lung approach, focuses on the limitation of tidal volume using
volume controlled ventilation (ARDS NETWORK, 2000). There is no convincing
evidence that either approach is superior (East T, 1993, Shanhotz C). Figure 2.3 presents
Wall et al (Wall R.J, et al 2001), reports that it has been demonstrated that implementation of protocols in the ICU, for specific clinical procedures, improves
clinical outcomes. However it argues that clinicians are not constrained by the
protocol since it focuses on common aspects of the patient’s illness. Clinicians often
need to deviate from the protocol, due to “subtleties inherent to each patient”.
Authors report that critics argue that protocols reduce the quality of care by reducing
clinical judgment and degrading medical expertise.
We conclude that the multi-parametric nature of the ventilation management
problem and the complexity of the cardio-respiration physiology call for medical
guidelines - protocols. However the design and implementation of the protocols is
compromised by the multi-strategy approaches, the ICU patients’ case-mix (multiple
pathologies) and the variation of clinicians’ expertise and treatment styles.
2.3 An overview of common lung pathologies (ALI-ARDS &
COPD)
Acute Lung Injury (ALI) and acute respiratory distress syndrome (ARDS) are
clinical entities describing the diffuse pulmonary inflammation (Bellingan G & Finney
S.J 2006). ARDS was first described by Ashbaugh and co-workers in 1967 (Lechin A.E. et al 1994). ALI is the less extreme manifestation of ARDS. Annual incidence of ALI-ARDS range from 8 to 70 cases per 100,000 population in developed countries
(Bellingan G & Finney S.J 2006), while mortality ranges from 30-40% adults (Zwischenberger J.B 2006) and 30-75% in children (Hammer J 2006).
ALI-ARDS is the disruption of the normal alveolar-capillary barrier (Lechin A.E &
Varon J 1994). Clinical manifestations are dyspnea, the severe hypoxemia due to mismatching of ventilation and perfusion, and lung stiffness manifested by increased
compliance and WOB. ALI-ARDS could be caused by direct or indirect injury to the
lung (Hammer J 2006). Sepsis is the basic etiology of ARDS in ICUs. Case mix
(multiple risk factors) commonly develops ARDS and is usually the cause of
patients’ mortality rather than ARDS itself.
ALI-ARDS is usually treated with invasive mechanical ventilation and
pharmacotherapeutic approaches. Pharmacotherapeutic approaches focus on the
strategy influences mortality. Strategies focus on lung volumes, FiO2, PEEP and
ventilation modes (Bellingan G & Finney S.J 2006). Adjuncts to traditional mechanical ventilation include prone positioning, recruitment maneuvers to prevent or recruit
lung collapse, surfactant administration to reduce surface tension in alveoli, high
frequency ventilation and non invasive ventilation.
Chronic obstructive pulmonary disease (COPD) is “the airflow limitation due to
narrowing and fibrosis of small airways and loss of airway alveolar attachment as a
result of emphysema” (Barnes P.J 2006). Chronic airflow limitation is initiated by inflammation, airway hyperactivity, secretions and loss of the structural integrity of
the lung parenchyma (Hess D.R, Kacmarek R.M 2002).
COPD affects 6% of the general population and is one of the top five causes of
chronic morbidity and mortality in the USA (Amborosino N, Simonds A, 2007). A large
percentage of COPD patients are admitted to ICU. 26-74% of them receive
mechanical ventilation support (Gursel G 2005). Ventilation is initiated to prevent
hypoxia and to control acidosis and hypercapnia (Plant P.K, Elliot M.W 2003). Research
has shown that COPD patients ventilated with non-invasive mechanical ventilation
have better results than intubation (Hibert G et al 1998, Plant P.K, Elliot M.W 2003). Smoking, environmental and genetic factors are the main causes of COPD.
2.4 Overview & Necessity of Decision Support Systems (DSS)
for mechanical ventilation
The controlled ventilation management process could be described as a closed
control feedback system, where the controller is the ICU clinician and the controlled
system is the patient. Clinicians gather clinical information utilizing multiple sources
of data, such as blood gas analyzers, monitors, ventilators, patient’s drug
administration records and patient’s pathology, and make decisions on the
appropriate control adjustments to the ventilation apparatus. Clinical decisions are
governed by expertise and experience. As it has already been stated the process of
ventilation management, could be considered as a search of an optimum solution
through a complex search space.
When modelling the clinician-patient system the researcher is faced with many