City, University of London Institutional Repository
Citation
:
Spanoudakis, G. and Zisman, A. (2010). Discovering Services during
Service-Based System Design Using UML. IEEE Transactions on Software Engineering, 36(3), pp.
371-389. doi: 10.1109/TSE.2009.88
This is the accepted version of the paper.
This version of the publication may differ from the final published
version.
Permanent repository link:
http://openaccess.city.ac.uk/5164/
Link to published version
:
http://dx.doi.org/10.1109/TSE.2009.88
Copyright and reuse:
City Research Online aims to make research
outputs of City, University of London available to a wider audience.
Copyright and Moral Rights remain with the author(s) and/or copyright
holders. URLs from City Research Online may be freely distributed and
linked to.
City Research Online:
http://openaccess.city.ac.uk/
[email protected]
Discovering Services during Service-based
System Design using UML
G. Spanoudakis and A. Zisman
Abstract—Recently, there has been a proliferation of service-based systems, i.e. software systems that are composed of autonomous services, but can also use software code. In order to support the development of these systems, it is necessary to have new methods, processes, and tools. In this paper we describe a UML-based framework to assist with the development of service-based systems. The framework adopts an iterative process in which software services that can provide functional and non-functional characteristics of a system being developed are discovered, and the identified services are used to re-formulate the design models of the system. The framework uses a query language to represent structural, behavioural, and quality characteristics of services to be identified, and a query processor to match the queries against service registries. The matching process is based on distance measurements between the queries and service specfications. A prototype tool has been implemented. The work has been evaluated in terms of recall, precision, and performance measurements.
Index Terms— Design notations and documentation, software process models, search discovery language, service discovery engine
—————————— ——————————
1 I
NTRODUCTIONervice-based software system engineering has been recog-nised as an important paradigm for software system de-velopment in which different distributed software services are composed to support the rapid and low-cost development of software systems. Services, in this paradigm, are loosely coupled autonomous software entities that can be deployed remotely across organisational and IT infrastructure bounda-ries. To enable this paradigm, software services need to be described, discovered, composed, and monitored.
To address this challenge, service integrators, developers, and providers have been collaborating over the last few years developing approaches and tools that can support the emerg-ing paradigm. These approaches and tools include: (a) lan-guages to describe services (WSDL[60], WSCL[59], BPEL4WS[6], OWL-S[37], and WSMO[62]), (b) techniques for
service discovery (e.g. semantic matchmaking
[2][20][21][25][27][32], behavioural signatures matching [63], and matching of full service behavioural models [19] involv-ing requirements [66], architectural [29], and run-time [52] aspects of service oriented systems); (c) techniques for service composition [3][9][10][45][46], and (d) techniques for service monitoring, validation, verification, and evolu-tion [14][15][19][19]. Despite advances in this area, how-ever, existing techniques still fall short of supporting ade-quately the development and deployment of complex and dependable service-based systems.
In order to overcome this situation, in this paper we describe a framework that we have constructed to
sup-port the development of service-based systems; i.e., soft-ware systems that are composed of services but may also use additional software code to provide the required functionality. Our framework is UML-based and assists with the design of structural and behavioural models of service-based systems. The framework adopts an iterative system development process, in which software services that can provide the functionality and quality of service (QoS) properties required by a service-based system being devel-oped are identified, and identified services are used to amend and re-formulate the design models of the system. The reformulated design models are used in other itera-tions of the development process to trigger the identifica-tion of services that can be used in the design models.
The framework makes use of a query language to specify the characteristics of the services to be discovered, and a query processor that can execute the queries against service regis-tries. These characteristics can be related to different aspects of the system to be developed and the services that can be de-ployed in it, and include structural (aka interface) and behav-ioural models representing expected functionality from the services, and constraints representing additional structural, behavioural, and quality properties that services should sat-isfy (e.g., the time and cost of executing certain operations, conditions about the provider of a service). Constraints can be hard or soft. Hard constraints must always be satisfied by services whilst soft constraints may be compromised if a serv-ice has a good match with other required characteristics but fails to satisfy them.
Queries are executed in a two-stage process. In the first stage, services that satisfy hard constraints in a query are iden-tified generating a set of candidate services. In the second stage, the candidate services of the first stage are matched with the structural and behavioural models of the query as well as its soft constraints, and those services with the best overall match are returned as the final candidate services. The
xxxx-xxxx/0x/$xx.00 © 200x IEEE
————————————————
• G. Spanoudakis is with the School of Informatics, City Univer-sity,Northampton Sqaure, London, EC1V 0HB, UK. E-mail: gespan@ soi.city.ac.uk.
• A. Zisman is with the School of Informatics, City University,Northampton Sqaure, London, EC1V 0HB, UK.. E-mail: [email protected].
matching of services with a query is based on the computation of distances between service descriptions and queries.
The framework assumes services specified by different perspectives, including structural (interface) describing operations of services with their data types using WSDL [60], behavioural describing behavioural models of services in BPEL4WS [6], quality describing non-functional aspects of services in XML-format, and general information of the services. The identification of services based on distinct aspects provide a more accurate match between queries and services and the consequent discovery of services with the required characteristics, as opposed to tech-niques that are based only on keywords or interface as-pects (e.g., WOOGLE [58] and UDDI [54]), which provide less precise match.
The work presented in this paper has been carried out as part of a large European research programme on service cen-tric systems enginering (SeCSE[48]) and has been based on requirements identified in scenarios of service based systems development within different industrial domains including the telecommunication, automotive, and software industries.
The work presented in this paper extends our previous work described in [29][30][68]. The work in [30], presents ini-tial ideas of the framework and describes the discovery proc-ess only in terms of structural matching of queries and service operations. In [68], we describe the results of evaluating the framework for structural matching only in terms of precision measures. The work in [29] describes the discovery process in terms of structural and behavioral matching and evaluates only the precision of the structural matching using a small set of services. In contrast, the main contributions in this paper are: (a) development of constraint language to rep-resent extra conditions when executing service discovery during the design of service-based systems, (b) extension of the discovery process to support structural, behavioral, and quality matching, (c) development of the approach as a web service to allow the framework to be used inde-pendently of any CASE tool, (d) thorough evaluation of structural, behavioral, and constraint matching in terms of recall, precision, and performance measures, (e) detail description of the framework, and (f) more complete ac-count of related work.
The remainder of this paper is structured as follows. In Section 2 we present an overview of the framework. In Section 3 we describe the service discovery query used in our work. In Section 4 we present the computation of dis-tances. In Section 5 we evaluate the work in terms of re-call/precision and performance. In Section 6, we discuss the main features and limitations of the approach under-taken by the framework. In Section 7, we discuss some related work. Finally, in Section 8 we provide some con-cluding remarks and outline directions for future work.
2 F
RAMEWORKO
VERVIEWAs described in Section 1, our framework adopts an iterative process. In this process, service discovery is driven by struc-tural and behavioural design models of service-based sys-tems (called SySM and SyBM, respectively). The services identified during this process can be used to reformulate the
design models and trigger new service discovery iterations. The behavioral models used in the discovery process de-scribe interactions between operations of a service-based system that can be provided by web services, legacy sys-tems, or software components, while the structural models specify the types of the parameters of operations in the be-havioural models1.
[image:3.595.296.543.301.449.2]SySM and SyBM are expressed in UML as class and se-quence diagrams, respectively. The use of UML as a basis for our approach is because this language: (a) is the de facto standard for designing software systems and can effectively support the design of service-based systems [11][16][31], and (b) has the expressive power to represent the design models of service-based systems since it can represent modelling of software services, legacy code and software components in a system. Furthermore, UML provides built-in extensibility mechanisms (aka UML profiles) that can be used to define an extension of its meta model for specifying service discov-ery queries and, thus, enable specification of queries in the same language as the system design models.
Fig. 1. Overview of framework process
Figure 1 presents an overview of the iterative discovery process of the framework. As shown in the figure, queries are specified in reference to the sequence diagrams in SyBM and the classes and interfaces in SySM, and may include additional constraints about the required services. The can-didate services which are identified after the execution of queries can be bound to the SySM and SyBM models by de-signers. When this happens, SySM and SyBM are re-formulated (e.g. by adding message data types and opera-tions of identified services) and their new versions can be used to specify further queries for discovering additional services for other parts of the system. Queries may also be re-formulated and re-executed when the identified services are not adequate. This process can be terminated by the sys-tem designer at any time, when all the required services have been discovered, or when it is clear that further queries would not be able to identify services that have a better match with the current design models.
The framework has been implemented as a web service and can be deployed by any client that is able to produce service discovery queries expressed as UML 2.0 models
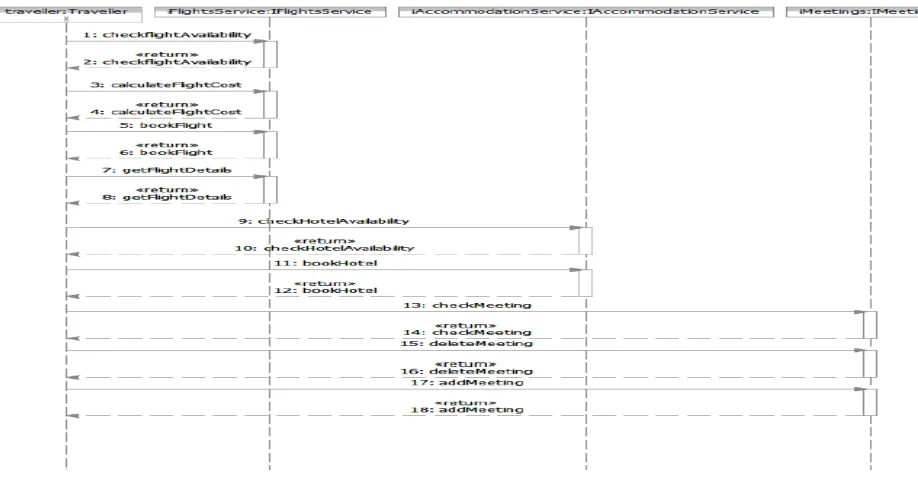
Fig. 2. An interaction of the ConferenceTravel system
represented in XMI. Service discovery queries are expressed using appropriate UML sterotypes that we have defined for this purpose. Queries may also include hard and soft con-straints, which are expressed in an XML based language that we have developed for this purpose (see Section 3). The deployment of the framework as a web service allows the framework to be used by different types of CASE tools that support UML 2.0 and the representation of such models in XMI.
The execution of a query consists of retrieving different types of service specifications from registries and match-ing these specifications against the query. The different types of service specifications are called facets and include structural, behavioral, and quality specifications. In the current implementation, structural and behavioural de-scriptions of services are expressed in WSDL[60] and BPEL[6], respectively, and quality descriptions are ex-pressed in XML. The registry used in the current imple-mentation is an eXist database [12]. The framework also provides access to different types of registries through the use of adapters. In this case it is possible to use standard UDDI [54] technologies to store service interface specifica-tions expressed in WSDL together with other service reg-istries to store other types of facets.
3 S
ERVICED
ISCOVERYQ
UERIESAs discussed earlier, a query may have three different parts, namely (a) structural query model, (b) behavioral query model, and (c) query constraints. The structural and behavioural query models represent functional as-pects of the service-based system being developed that need to be fulfilled by the services. The query constraints represent quality aspects (e.g. performance, availability, or cost of service operations) or extra functional aspects (e.g., provider of a service, receiver of a query message)
that need to be present in the services. The specification of these parts is discussed in the following.
3.1 Structural and Behavioural Query Model
The elements in SySM and SyBM are used to specify que-ries to indetify services that can be used in the service-based systems. To express a query, system designers must select an interaction from the SyBM model of the system being designed and specify the messages in this interaction that should be realized by service operations that are to be discovered. These messages constitute the so called “query messages” of the query. The specification of an interaction message as a query message is possible by associating the message with the stereotype <<query_message>>. This stereotype is part of a service querying profile that we have defined to enable the specification of queries in UML 2.0 and has been presented in detail in [29].
The service querying profile defines additional stereo-types for different stereo-types of UML elements that may exist in a query interaction. These include the stereotypes <<con-text_message>> and <<bound_message>>. The stereotype <<context_message>> indicates additional structural and behavioural constraints for the query messages. For exam-ple, if a context message has a parameter p1 with the same name as a parameter p2 of a query message, then the type of p1 should be taken as the type of p2. The stereotype <<bound_message>> indicates a candidate service opera-tion that is bound to a query message by the designer. All the messages in a query interaction, which are not stereo-typed by any of the above stereotypes, are treated as mes-sages irrelevant to the discovery process and, thus, do not restrict the services to be discovered in any way.
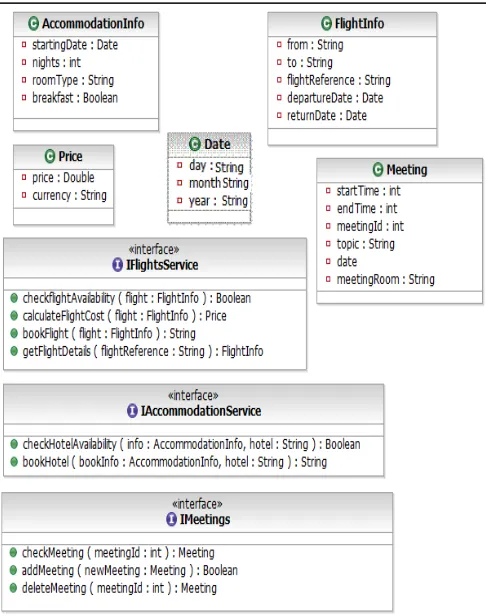
book flights and hotels as part of trip planning and prepa-ration activities. When a designer wants to find service operations that can provide implementations of the mes-sages checkHotelAvailability(info:AccommodationInfo, hotel:String):Boolean and bookHotel(bookInfo: Accommoda-tionInfo, hotel: String): String in the sequence diagram of Figure 2, he/she can create a query as a copy of the
se-quence diagram, and attach the stereotype
[image:5.595.38.281.240.548.2]<<query_message>> to these two messages. The classes representing the data types of the parameters of the two query messages, and all the other classes which are di-rectly or transitively related to them, are automatically identified by the framework and pulled together to for-mulate the structural model of the query. In the example, these classes are those shown in Figure 3.
Fig. 3. Structural model of ConferenceTravel system
3.2 Hard and Soft Contraint Query Language
The specification of hard and soft constraints in queries is based on an XML-based constraint service query lan-guage that we have defined as part of the framework and is called ConstraintSQL. The specification of the con-straints in an XML-based language is motivated by the fact that it is necessary to use XPath [64] expressions to reference elements and attributes in service specifications that are described in XML format.
A soft or hard constraint is defined as a constrain-tQuery. A constraintQuery is a logical expression that de-fines an atomic condition over some element or attribute in a service specification, or a logical combination of atomic conditions that is formed by using logic operators AND and OR. Logical expressions can also be negated.
An atomic condition is defined by a relational expres-sion over the values of two operands (operand1 and op-erand2). This expression can be specified using the rela-tional operators of the language, namely the operations equalTo, notEqualTo, greaterThan, lessThan, greater-ThanEqualTo and lessgreater-ThanEqualTo. The operands of a relational expression can be of three types, namely query operands, arithmetic expressionsor constants.
A query operand identifies an element or attribute in the description of a service (facet) using an XPath [64] expression (see Section 2 for description about facets). An arithmetic expression is used to express a computation over the values of service facet elements and/or attributes and is defined by a sequence of arithmetic operands connected by arithmetic operators (e.g., addition (plus), subtraction (minus), multi-plication (multiply), and division (divide)). The operands of an arithmetic expression can be query operands, constants, or functions. A function operand denotes the execution of a complex computation over a series of arguments, which results in a numerical value that can be subsequently used as an operand in the arithmetic expression. A function has a name indicating the function to be executed and a sequence of one or more arguments that might be query operands, constant, or arithmetic expressions, themselves. Con-straintSQL offers a set of built-in functions including func-tions for computing statistics (e.g. mean, standard deviation) and arithmetic functions (e.g. sum, min/max values, power).
<?xml version="1.0"?>
<constraintQuery xmlns="http://tempuri.org/secse/normalQuery" name="MaxMeanTimeToComplete"
weight="0.5" type="soft">
<logicalExpression> <condition negated="false"> <lessThanEqualTo>
<operand1> <queryOperand> <xpathExpression> <facet>
<name>QoS</name> <type>QoS</type> </facet> <xpath> //Metrics//Metric[Name =
"MeanTimeToComplete"]/MinValue </xpath> </xpathExpression> </queryOperand> </operand1> <operand2> <constant>
<value>3500</value> <type>STRING</type>
</constant></operand2>
[image:5.595.298.547.384.584.2]</lessThanEqualTo> </condition> </logicalExpression> </constraintQuery>
Fig. 4. Example of a soft constraint in CostraintSQL
A constraintQuery has also: (i) a name specifying the name of the constraint; (ii) a type indicating whether the constraint is hard or soft; and (iii) a weight (i.e., a number in the range [0,1]) specifying the significance of the con-straint for the service discovery query. The weight in hard constraints is always 1.0, given that a hard constraint needs to be satisfied by all candidate services, while in soft constraints the weight is in the range [0.0, 1.0], since soft constraints are used to rank a service with respect to a query (see Section 4).
should not be more than 3500 milliseconds. As shown in the figure, the constraint is soft and applies to element
//Metrics/Metric[Name = “MeanTimeToComplete”]/MinValue
of facet QoS in service descriptions. Furthermore, the weight of the constraint is defined as 0.5.
4 Q
UERYE
XECUTIONService discovery queries are executed in two phases by a
query processor. In the first phase, the query processor searches service registries in order to identify services that satisfy the hard constraints of a query. This stage is called filtering phase
and is based on an exact matching of hard constraints of a query against the service descriptions in the registries. In the second stage, candidate services which have been returned at the filtering stage are matched against structural and behav-ioral models and soft constraints of a query, and the best can-didate services for the query are identified. This stage is called
optimisation phase
The fit of services with a query is computed during the op-timisation stage using three partial distances, namely signa-ture, behavioural, and soft constraint distances. These distances are computed by matching service descriptions with struc-tural model, behavioural model, and soft constraints of a query, respectively. This matching is inexact and even services which do not match exactly with the query may be identified as the best possible candidates.
The structural matching between a query and a service is performed by comparing the signatures of query mes-sages in the structural model against the signatures of the operations of the services. In this case, the WSDL specifi-cation of a service and the signatures of the messages in a query are converted into a set of data type graphs (see Subsection 4.1). The matching identifies the mapping and calculates the distances between the elements represented in the graphs.
The behavioural matching between a query and a serv-ice is performed by comparing the behavioral specifica-tion of the services and the behavioral model of a query. In this case, the behavioural specifications of the service and the behavioural model of the query are converted into state machine models and distances between these state machines are calculated (see Subsection 4.2).
The soft constraint matching between a query and a service is performed by analysing the conditions in the constraint part of a query against service specifications (see Subsection 4.3).
The partial signature, behavioural, and soft constraint dis-tances which are computed between services and a query are aggregated in an overall distance which is then used to select the best service operations for different query messages. The selection of the best service operation for query messages is formulated as an instance of the assignment problem [43], i.e., the problem of 1-1 mapping between query messages and service operations, which minimises a weighted sum of the overall distances between all the mapped service operations and query messages.
There may be some differences in the execution proc-ess of a query. These differences are due to the lack of hard, behavioral, and soft constraints in a query, or any
combinations of the above constraints. In the case in which there are no hard constraints in a query, the filter-ing phase is not executed and the partial distances are calculated between all the services in the registries. In the case in which behavioral or soft constraints are not pre-sent in a query, the computation of the corresponding partial distance is bypassed and the overall distance is computed by using only the partial distances of the types of constraints specified in a query. Note that structural constraints are always present in a query and, therefore, at least distances based on them are calculated.
In the following, we discuss the computation of signature, behavioural and soft constraints distances and the selection of the best candidate service operations for a query. We also give an example of computing these distances.
4.1 Signature Distance
The signature distance between a service operation So and a
query message Qm is computed by a function that considers
the linguistic distance between the names of the operation and query message, the names of their parameters, and the data types of these parameters as defined below.
Definition 1: The signature distance between a service
op-eration So and a query message Qm is computed by function:
df-sig(Qm,So) = wN*dL(name(Qm), name(So)) +
wI*dPS(in(Qm),in(So)) + wO*dPS(out(Qm),out(So))
where, dL is a linguistic distance function; dPS is a function
that computes the distance between input and output parameters of So and Qm; and wN, wI, wO are weights
asso-ciated with the names, input parameters, and output pa-rameters of the service operation and query message, re-spectively (with wN+wI+wO=1).
The definitions of the dL and dPS fuctions are given
be-low. Note that df-sig∈[0,1] since this function is defined as a
linear combination of dL and dPS which also return values
in [0,1] as we discuss below.
Definition 2: The linguistic distance between two strings S1
and S2 is computed as:
dL(S1,S2) = |t(S1/S2)| + |t(S2/S1)| +
0.5*|t(S2) ∩s t(S1)| / |t(S2) ∪ t(S1)|
where,
t(S1) and t(S2) are sets of tokens in S1 and S2. The to-kens in a string S are identified by splitting S into suc-cessive substrings starting at the beginning of S, or at a capital letter within S, and ending before the next capi-tal letter,
t(Si/Sj) is the set of tokens x in t(Si) for which there is no token y in t(Sj) that is a synonym of x (the synonymy of two tokens is determined on the basis of WordNet lexi-con [35]),
t(S2) ∩s t(S1) is the set of the tokens in S1 and S2 which
have synonym or identical tokens in the other set,
|Φ| is the cardinality of set Φ.
tokens which have synonyms weighted by 0.5 over the total number of distinct tokens in t(S1) and t(S2) (i.e., the cardinality of the set t(S2) ∪ t(S1)).
Note that dL ≤ 1 since t(S1/S2) ∪ t(S1/S2) ∪ (t(S2) ∩s t(S1))
⊆ t(S2) ∪ t(S1) and t(S1/S2) ∪ t(S1/S2) ∪ (t(S2) ∩s t(S1)) and,
therefore, |t(S1/S2)| + |t(S2/S1)| + 0.5*|t(S2) ∩s t(S1)| ≤
|t(S2) ∪ t(S1)|. Also, 0≤dLsince t(S1)≠∅ and t(S2)≠∅ (every
string will have at least one token) and, therefore, |t(S2) ∪
t(S1)|> 0.
dPS is computed by finding the best possible morphism
between the data types of the parameters of a service op-eration So and a query message Qm. To compute this
mor-phism, the query processor first formulates graphs that represent the data types of the input and output parame-ters of So and Qm and then matches the input graphs and
output graphs with each other.
The data type graphs of the input and output parame-ters of a service operation and a query message are con-structed taking into consideration both primitive and non-primitive data types. In the graph of a set P of pa-rameters, a special node representing the root of the graph is created with immediate children nodes, for each parameter pi in set P. The data type associated with pa-rameter pi is added to the graph as a child node of the respective root node (datatype_pi node). The name of the
parameter pi is represented in the graph as the name of the edge between the root nodeand datatype_pi node. In
the case of a data typethat is a non-primitive type, a sub-graph for this data type is constructed such that each data type of the attributes in the class representing datatype_pi
is added to the graph as a child of datatype_pi with the
name of the attribute as the name of the respective edge. If the data type of an attribute is also non-primitive the process is repeated for this data type. The process termi-nates when all the leaf nodes in the graph have only primitive data types.
More specifically, the graph that represents the data types of a set S of parameters p1,…,pm with types T1, …, Tm is a labeled
directed graph that includes the following set of edges: Edges(S) = ∪i=1,…,m <pi, (sn,Ti)> ∪i=1,…,m Edges’(Ti)
Edges(S) containts: (i) the edges <pi, (sn,Ti)> that represent the
parameters in S, and (ii) sets of Edges(Ti) which represent the
structure of the types Ti of the different parameters pi . In an
edge <pi, (sn,Ti)>, pi is the name of the parameter that labels
the edge, sn isa special root node that does not represent any specific parameter type and Tiis the type of the relevant
pa-rameter. If the type of a parameter is primitive Edges’(Ti) is
empty (i.e., Edges’(Ti)=∅). Otherwise, for non primitive data
types, assuming that Sfeatures(Ti) is the setof structural
fea-tures of Ti, (i.e., the set of attributes and associations of Ti) and
each feature x in Sfeatures(Ti) relates Ti with another type
Type(x), Edges’(Ti) is defined as Edges’(Ti)= ∪x∈ Sfeatures(Ti)
{<name(x), (Ti,Type(x))>} ∪x∈Sfeatures(Ti) {Edges’(Type(x))}. Thus,
the set of nodes which are inteconnected by Edges(S) repre-sent T1, …, Tm and all the types in their own structures, and are
labelled by the names of these types. Also, the edges in Edges(S) represent the structural relations (attributes and as-sociations) between T1, …, Tm and all the types in their
struc-tures, and are labelled by the name of the relevant relation. An example of graphs of input parameter data types is
shown in Figure 5 for a query message checkHotelAvailabil-ity(info:AccommodationInfo,hotel:String):Boolean from the
ConferenceTravel system described in Section 3, and a
serv-ice operation checkRoomAvaliability(room:Room,
Starts:Date,Ends:Date):Boolean, where Room is a non-primitive data type with attributes hotelName:String and
category:String.
Definition 3: The distance between two sets of parameters P1
and P2 is computed as:
dPS(P1,P2) = MIN m ∈ Morphisms(Edges(P1), Edges(P2)) {(∑ (e1,e2) ∈ m dE(e1,e2)
+abs(|Edges(P2)|− |Edges(P1)|)) / max(|Edges(P2)|, |Edges(P1)| ) } where,
Morphisms(Edges(P1), Edges(P2)) is the set of all the total morphisms from the edges in Edges(P1) to the edges in Edges(P2)
abs(exp) is the absolute value of the arithmetic expression,
dE(e1,e2) is the distance between two edges e1=< e1-name,
(T1S, T1D)> and e2=< e2-name, (T2S, T2D)> defined as
dE(e1,e2) = w1.dL(e1-name, e2-name) +
w2.dL(name(T1S), name(T2S)) +
w3.dL(name(T1D),name(T2D)) +
w4.dEDGES(Edges(T1D), Edges(T2D)))
with TiS and TiD are the source and destination data type
nodes respectively; and w1, w2, w3 and w4 weights
associa-ted with the linguistic distances of the names of the edges, the names of the data types, and the distances of two e-dges.
dEDGES(Edges(T1D), Edges(T2D)) is the distance between the
edges of two types, defined as
dEDGES(Edges(T1D), Edges(T2D)) = 1 if Edges(T1D)=∅ or
Edges(T2D) =∅
dEDGES(Edges(T1D), Edges(T2D)) =
MIN m ∈ Morphisms(Edges(T1D), Edges(T2D))
{(∑ (e1,e2) ∈ m dE(e1,e2) + abs(|Edges(T2D)|−
|Edges(T1D)|)) / max(|Edges(T1D)|, |Edges(T2D)|) }
Otherwise
According to Definition 3, the morphism of the structure of the data types of the parameters is determined by finding the matching between the edges of the data type graphs of two parameters that has the least possible sum of edge distances (see formula (∑(e1,e2)∈mdE(e1,e2) + |Edges(P2)|−|Edges(P1)|)
/|Edges(P2)|). The distance between two edges is computed by taking into account the linguistic distance between the names of the structural features represented by the edges, the names of the types that have these features (T1S and T2S), and
the similarity of the structures of the types that the features point to (see function dEDGES(Edges(T1D), Edges(T2D))). Thus, the
computation of dE analyses recursively the entire structure of
the graphs that represent the data types of two parameters. Note that 0≤dPS≤1. This is because Edges(P1)≠∅ and
Edges(P2)≠∅ and, thus, max(|Edges(P2)|,|Edges(P1)|) ≥ 0. Also, for any morphism m in Morphisms(Edges(P1),Edges(P2)), we have that |m|= min(|Edges(P2)|,|Edges(P1)|). Thus, for all m in Morphisms(Edges(P1),Edges(P2)) it will be that ∑ (e1,e2)∈m
dE(e1,e2)) ≤ |m| and ∑(e1,e2)∈mdE(e1,e2) + abs( |Edges(P2)|−|Edges(P1)|)) ≤ max(|Edges(P2)|,|Edges(P1)|) if 0 ≤ dE(e1,e2) ≤ 1. However, dE(e1,e2) is computed recursively as a
values in [0,1], and dEDGES. At the end of the recursion,
howe-ver, dEDGES will be applied on primitive types with no further
edges and therefore it will be equal to 1. Hence, in the precee-ding computation it will be that dE(e1,e2)≤ 1. Similarly it can be
shown that for all previous computations of dE in the
recur-sion it will be dE≤ 1. An example of signature distance is
de-scribed in Section 4.4.
4.2 Behavioural Distance
The behavioural distance between a service operation So and a
query message Qm is computed by matching the state
ma-chine representing the behaviour expected by interface I that executes Qm in the query (SMQ) and the state machine
repre-senting the behaviour of the service S that provides So (SMS)
(see Definition 4). The state machines SMQ and SMS are
gener-ated automatically from the interaction diagram of a query Q and the BPEL specification of a service S in the registry, respec-tively. The algorithms used to generate the state machines can be found in [29].
Definition 4: The behavioural distance between So and Qm is
computed as:
df-beh(So, Qm; k) = dbeh(SMQ, SMS; k) =
MINn=0...k
{MINm ∈ Morphs(n)(SMQ, SMS)
{1/(MAX(len(SMQ),len(SMS))
(∑ ti∈p and m(ti) ≠ NULL df-sig(oper(ti),oper(m(ti))) +
(∑ ti∈transititions(SMQ) and m(ti)= NULL1) +
(∑ tj∈q and m-1(tj)= NULL1))}}} if SMQ.Transitions≠∅
and SMS.Transitions≠∅
df-Beh(So, Qm; k) = 1 Otherwise
where,
SMQ and SMS are state machines representedas SM = <σ,
O, T, σI> where σ is the set of states of SM, O is the set of
signatures of the operations provided by SM, T is a set of transitions of SM which are labelled by an operation signa-ture in O, and σI is the initial state of S(σI ∈σ),
len(SMQ) and len(SMS) are maximum length of a path in
SMQ and a path in SMS, respectively;
Morphs(n)(SM
Q,SMS) is the set of all the possible 1-1
map-pings between the transitions of two paths p and q in SMQ
and SMS that preserve the ordering of the transitions
within these paths (i.e. for all transitions ti and tj in psuch
that ti p tj it also holds that m(ti) q m(tj)2) and leave n
tran-sitions in p or q without counterparts (the counterpart of all such transitions will, by convention, be a dummy tran-sition NULL);
m-1 is the inverse mapping of a mapping m from p to q;
k (flexibility matching) is a parameter defining the maxi-mum number of the transitions of p or q that are allowed not to have a counterpart in the mappings between these paths, 0 ≤ k ≤ ABS(len(SMQ) − len(SMS));
oper(t) is the operation signature that labels a transition t in a state machine;
2
p is a relation that reflects the linear order of transitions within a
path p.
df-sig is the distance between signatures of two operations.
The algorithm that computes dbeh(SMQ, SMS; k) is a search
algorithm that finds the path q in SMS which has the best
pos-sible match with the single path p of SMQ , and returns the
aggregate distance between these paths as the distance be-tween SMQ and SMS. In this search, the degree of match
be-tween two paths p and q is computed as the sum of the signa-ture distances between the operations which label the mapped transitions of p and q (df-sig(oper(ti),oper(m(ti)))).
The search of a path q in SMS that has the best possible
match with path p in SMQ is implemented by trying to
con-struct alternative mappings from p onto q (Morphs(n)(p,q))
Incrementally. These alternative mappings must preserve the order of the transitions in the two paths (i.e., for all transitions ti and tj in psuch that ti p tj it should also hold that m(ti) q
m(tj)). Furthermore, valid mappings are allowed to leave up to
k transitions of p and q without a counterpart.
More specifically, the construction of alternative mappings from p onto q is executed by consuming one by one all the transitions tp in p, comparing these transitions with the
transi-tions tq in q, preserving the order of tp and tq in the paths, and
verifying if transition tp can be (i) accepted, when tp matches tq;
(ii) removed, if tp does not match tq, but a transition tp+x
follow-ing tp in p matches transition tq (where 1 ≤ x ≤ k-L and L is the
number of transitions that have already been removed or added during the transformation process), or (iii) tq, tq+1, tq+x
can be added when t p, tq+x and the other transitions in p can be
consumed. The mapping that minimizes the distance d
f-beh(SMQ, SMS; k) is the one selected. It should be noted that
whilst matching the state machine of a query with the state machine of a service any conditions of the later are ignored. This is because it is not possible to establish the equivalence of such conditions without making strong assumptions about naming of internal service variables.
The flexibility of the approach to allow up to k transitions of p to be left without counterparts makes it possible to discover services whose behaviour is similar to the behaviour of the required service, but not identical. It should be noted, how-ever, that while unmapped transitions of p and q are allowed in a mapping m, such transitions contribute a distance of 1 to the aggregate distance of m. Thus, the more the transitions that a mapping leaves without counterparts, the less likely is for m to present the best possible match for p.
Note that, df-beh takes always values in range [0,1]. This is a
direct implication of its definition when if SMQ.Transitions=∅
or SMS.Transitions=∅. In cases where SMQ.Transitions≠∅ and
SMS.Transitions≠∅ df-beh ≥ 0 since MAX(len(SMQ),len(SMS) > 1.
We also have that df-beh ≤ 1, since |Morphs(n)(SMQ,SMS)| ≤
MAX(len(SMQ),len(SMS) and df-sig(oper(ti),oper(m(ti)) ≤ 1.
An example of the behavioural distance is described in Subsection 4.4.
4.3 Soft Constraint Distance
The soft constraint distance between a query message Qm
and a service operation So is computed by the function in
Definition 5 below:
Definition 5: The soft constraint distance between So and Qm
is computed as:
df_con(Qm, So) = 0 if Scons(Qm) =∅
where,
Scons(Qm) is the set of soft constraints defined for query
message Qm in the query and the global soft constraints
of the query which apply to Qm by default,
wi is a weight expressing the significance of the
con-straint Ci for query message Qm (wi >0),
dcon(Ci,So) is a distance measure that represents if the
con-straint Ci is satisfied by service operation So. This
meas-ure is 0 if the constraint Ci is satisfied by So, and 1
other-wise.
According to this definition, the soft constraint distance between Qm and So is the sum of the weights of the soft
con-straints that apply to Qm and are not satisfied by So , divided
by the sum of the weights of all the soft constraints in the query which apply to Qm. It should also be noted that
df_con(Qm,So) takes always values in the range [0,1] since
dcon(Ci,So) ∈ [0,1] and, therefore, ∑Ci∈Scons(Qm) widcon(Ci,So) ≤ ∑wi
and ∑wi > 0.
4.4 Overall Distance
The overall distance between a query message Qm and a
serv-ice operation So is computed as the weighted sum of the
signa-ture, behavioural, and soft constraint distances between Qm
and So as defined below.
Definition 6: The overall distance between Qm and So is
com-puted as:
D(Qm, So; k) = wsig df-sig(Qm, So) + wbeh df-beh(Qm, So; k) +
wcon df-con(Qm, So)
where wsig, wbeh and wcon are weights of signature, behavioural
and constraint distances for which wsig + wbeh + wcon = 1.
It should be noted that D(Qm, So; k) returns always a
va-lue in the range [0,1] since df-sig, df-beh and df-con also return
values in the same range, as discussed earlier.
Following the computation of the D distances between all the query messages in a query (Qm) and the set of service
op-erations in registries (So), the best service operation for each
query message is determined by finding the morhism (1-1 mapping) between query messages and service operations which minimises the function
MIN M∈Morphisms(QM,SO) {∑ (Qm,So)∈M D(Qm, So; k) }
for a given value of flexibility matching K (Morphisms(Qm,So)
in the above formula denotes the set of all the possible mor-phisms from Qm to So).
More specifically, the computation of the best service operation for each query message is executed by con-structing an operation matching graph G with (a) two dis-joint sets of vertices: one set of vertices representing mes-sages in a query and another set of vertices representing the service operations identified in the filtering stage (or the service operations in the registries when the filtering stage has not been executed); and (b) edges that connect each of the messages in the query with all the operations of the retrieved services, and vice versa. Each edge e(m,o)
in graph G is weighted by a measure that indicates the overall distance D(Qm, So; k) between a message m in Qm
and an operations o in So.
Following the computation of the distances between
the vertices, the matching between the messages in the query and the operations in the candidate services is de-tected by selecting a subset E’ of the edges in graph G, such that E’ is a total morphing between the vertices in G, and has the minimal distance values. This subset is se-lected by applying an instance of the assignment problem algorithm following the approach in [51]3.
4.5 Example
As an example of computing the different types of dis-tances between query messages and service operations consider again the query for ConferenceTravel system that we introduced in Section 3. This query has two query
messages, namely
checkHotelAvailabil-ity(info:AccommodationInfo, hotel:String):Boolean (QM1) and
bookHotel(bookInfo: AccommodationInfo, hotel: String): String
(QM2), and the soft constraint as described in Figure 4. Suppose also that the query is matched with a service, called HotelService1, which offers the following 3 opera-tions:
SO1:HotelService1::checkRoomAvailability(room:Room,Start s:Date,Ends:Date): Boolean
SO2: HotelService1::reserveRoom(room: Room, From:Date, To:Date): Reservation
SO3: HotelService1::cancelReservation(reservation: Reserva-tion): Boolean
Assume that HotelService1 has a QoS facet indicating that the time to execute the operations in the service is 3500 miliseconds (this facet is not shown in the paper due to space limitations).
As an example of the computation of signature distance, consider the signature distance between query message QM1 and the service operation SO1. According to Definition 1, this distance is computed from the linguistic distance
dL(checkHotelAvailability, checkRoomAvailability) between the
names of QM1 and SO1, the distance between the input pa-rameters of QM1 and SO1 dPS(in(QM1),in(SO1)), and the
distance between the output parameters of QM1 and SO1 dPS(out(QM1),out(SO1)). The linguistic distance between
QM1 and SO1 is equal to 0.5 as the names of QM1 and SO1 have two identical substrings (i.e., “check” and “availabil-ity”) and two non identical substrings with no synonyms (i.e., “hotel” and “room”). Hence, dL(checkHotelAvailability, checkRoomAvailability) = 2/4 = 0.5.
The computation of dPS(in(QM1),in(SO1)) and
dPS(out(QM1),out(SO1)) is based on the graphs of the data
types of QM1 and SO1. Figure 5 shows the graphs of the data types of the input parameters of QM1 and SO1. Based on these graphs, the distance dPS(in(QM1),in(SO1)) is 0.415.
Ac-cording to Definition 3, this distance is computed from dE
dis-tances between the pairs of edges that have been mapped by the best possible morphism between the input parameters of QM1 and SO1 which is shown by the dashed lines in Figure 54. The d
E distances between these edges are shown in the grey
boxes which appear upon the dashed lines in Figure 5 (each of
3When the number of messages in a query is not the same to the
number of operations in the candidate services, special vertices are added in the graph representing dummy operations, in order to make the number even.
these boxes shows the distances (dE(e1, e2),
dL(name(T1S),name(T2S)), dL(e1-name,e2-name), dL(name(T1D),
name(T2D)), dEDGES(Edges(T1D), Edges(T2D)))) for the relevant
pair of mapped edges).
As shown in Figure 5, the best morphism between the in-put parameters of QM1 and SO1 maps the edges day, month and year of data types Date in the two graphs. This is because the linguistic distance between the names of these edges, the names of their starting nodes (Date), the names of their desti-nation nodes (String), and the distance between the edges of their destination nodes are all equal to 0. Note also, that the edge which represents the attribute StartingDate of data type
AccommodationInfo in QM1 is mapped on the input parameter
Starts of SO1. These two edges have an overall distance 0.437 which is the minimum possible edge distance excluding the mappings discussed above. For the same reason, the attribute
roomType of the data type AccommodationInfo in QM1 is mapped onto the attribute category of data type Room in SO1.
The computation of dPS(out(QM1),out(SO1)) is performed
in a similar way to the computation of dPS(in(QM1),in(SO1)).
In the example, dPS(out(QM1),out(SO1)) is zero, since both
[image:10.595.308.553.302.430.2]QM1 and SO1 have returned parameters of type Boolean.
Fig. 5. Graphs for data types of input parameters of QM1 and SO1
Consider wN = 0.4, wI = 0.4, and wO= 0.2 the weights
as-sociated with the linguistic distance and the input and output parameter distances, respectively. The signature distance for QM1 and SO1 is df-sig(QM1,SO1) = 0.4*0.5 + 0.4*
0.415 + 0.2 * 0 = 0.366.
The behavioural distance between QM1 and SO1 is 0.209 for K=0. This distance results from the computation of the best possible mapping between the state machine of QM1 and the state machine of SO1. This mapping is shown by the dashed lines in Figure 6 where (i) transition checkHotelAvailability() in the state machine of QM1 is mapped onto transition check-RoomAvailability() from state S1 to state S1 in the state machine of SO1, and (ii) transition BookHotel() in the state machine of QM1 is mapped onto transition reserveRoom() from state S1 to state S2 in the state machine of SO1. This particular mapping is selected because (a) it consists of the minimum sum of dis-tances between possible pairs of transitions (the disdis-tances
be-tween the former and the latter pair of mapped transitions were 0.174 and 0.281, respectively), and (b) the value of the parameter K=0 eliminates other alternative mappings of tran-sitions with the same pairwise distances.
One of these alternatives, for example, is a mapping in which transition BookHotel() in the state machine of QM1 is mapped onto transition reserveRoom() from state S1 to state S2 in the state machine of SO1 (as in the selected mapping) , but transition checkHotelAvailability() in the state machine of QM1 is mapped onto transition checkRoomAvailability() from the initial state to state S1 in the state machine of SO1. Although, the pairwise distance between the latter pair of transitions in the alternative mapping is the same as the distance between transition checkHotelAvailability() in QM1 and transition check-RoomAvailability() from state S1 to state S1 in the selected mapping, the alternative mapping was eliminated since this mapping requires one unmapped transition between two mapped transitions in the state machine of SO1 (i.e., transition
[image:10.595.45.303.317.529.2]checkRoomAvailability() from state S1 to state S1) and, as the value of K is zero, no such unmapped transitions are allowed.
Fig. 6. ConferenceTravel and HotelService1 statemachines
The soft constraint distance between QM1 and SO1 is zero since the constraint specified in Figure 4 matches the performance time describe in the QoS facet of the service.
Suppose in the example that the signature distance has a weight of 0.5, the behavioural distance has a weight of 0.3, and that constraint distance has a weight of 0.2. In this case, the overall distance between QM1 and SO1 is D(QM1,SO1,0) = 0.5*0.366 + 0.3*0.209 + 0.2*0 = 0.2457.
5 E
VALUATIONTo evaluate our framework, we have performed a set of experiments, designed to measure and analyse: (a) the recall and precision of the results of service discovery, and (b) the performance of the matching process.
5.1 Experimental SetUp
online banking. All the 95 services had structural specifica-tions expressed in WSDL [60] and QoS specificaspecifica-tions, and more than half of them (52) had behavioral specifications ex-pressed in BPEL [6]. The registry had been implemented as an eXist database [12].
In the evaluation, we also used six queries drawn from de-sign models of two service-based systems that had been pro-vided as case studies by the industrial partners of the SeCSE project, namely ConferenceTravel (i.e., the system introduced in Section 3), and PurchaseTransaction (i.e. a system for purchas-ing services and goods over the Internet). Three of these que-ries (Q1, Q2, and Q3) were defined for the PurchaseTransaction
system and another three were defined for the Conference Travel system (queries Q4, Q5, and Q6). The exact form of the queries that we used reflected steps in the design of the relevant systems that had been identified by the industrial partners. The queries had a total of 18 query messages with different complexities, where (i) Q1 and Q5 had two query messages, (ii) Q2 and Q6 had three query messages, and (iii) Q3 and Q4 had four query messages.
The complexity of query messages was determined by the number of edges in the graphs of the data types of the pa-rameters of the message, as in the case of operations (see Sub-section 4.1). Based on this measure, a query message was clas-sified as of low complexity if it had a data type graph with less or equal to ten edges and of medium-high complexity if it had a data type graph with more than ten edges. This boundary value between low and medium-high complexity was deter-mined by a previous analysis of the complexity of service op-erations in the registry [68]. This previous analysis has dem-onstrated that 49% of the services in the registry had data type graphs of low complexity and 51% had data type graphs of medium-high complexity. The boundary value represented the median operation complexity found in that study. Fur-thermore, all the queries used in the experiment included the soft constraint shown in Figure 4, but no hard con-straints. Hard constraints were excluded from queries as they could filter out services before the optimisation stage during query execution and, therefore, reduce the query execution time (due to the reduction on the number of services to be matched in the optimization phase) and im-prove recall and precision. Furthermore, each query was executed twice: once with a flexibility matching level k=0 and once with flexibility matching level k=1.
To evaluate recall and precision we used assessments of the relevance of service operations in the registry to the messages in the queries. These assessments of relevance were provided by six different users, who had no involve-ment in the developinvolve-ment of the discovery framework and the specification of the queries and design models used in the experiment, and no knowledge of the algorithms used by the framework. Four of the users had a PhD in Software Engineering or Computer Science and two of them had an MSc in Computer Science and were undertaking a PhD in Software Engineering at the time of the experimentation. All users were familiar with service-oriented system engi-neering and UML based system design.
The six users who participated in the experiment assessed the relevance of 5688 possible pairs of query messages and service operations (18 query messages × 316 service
opera-tions) independently and prior to the execution of queries. Each user was given the queries and access to the descriptions of the services in the registry and asked to assess if the service operation in each of these pairs was relevant to the query mes-sage based on two criteria of relevance.
The first of these relevance criteria (RC1) was to assess rele-vance by looking at both the signatures and the behaviour of the query messages and service operations and consider as relevant only operations whose behaviour had an exact fit with what was expected in the query. The second criterion (RC2) was to assess relevance by looking at both the signa-tures and the behaviour of the query message and the service operations and consider as relevant operations whose behav-iour was similar to what was required in the query even if it was not exactly the same.
The provision of generic criteria of relevance to the us-ers was to avoid excessive divus-ersity in their assessments [49]. The selected criteria corresponded to general factors that could be taken into account in the software design process and had a general correspondence to the different types of matching used in the discovery process of the framework. It should be noted, however, that no hints about this correspondence were given to the users.
Based on the assessments of the different users, we de-rived an aggregate final assessment of the relevance of service operations to query messages with respect to each of the three different relevance criteria. Aggregate rele-vance assessments were derived based on “voting scheme”. More specifically, an operation was deemed relevant to a message with respect to a specific relevance criterion only if least 4 of the 6 users confirmed the rele-vance of a result (i.e., when at least 65% of the users con-firmed the relevance of a result).
5.2 Recall and Precision Evaluation Results
The evaluation of recall and precision was used for as-sessing the ability of the framework to locate as many as possible service operations which are relevant to a spe-cific query (recall), and disregard operations which are irrelevant in the discovery process (precision). In the ex-periments, recall and precision were measured according to the following formulas:
Precisionc =|SO ∩UOc|/|SO|) (1)
Recallc =|SO∩UOc|/|UOc| (2)
In these formulas,
SOis the set of service operations that were retrieved as possible results for a query Q;
UOc, is the set of service operations that more than T
per-cent of the users considered to be relevant to query Q ac-cording to criterion C; and
|X| is the cardinality of set X.
Recall and precision measures were computed for individ-ual messages in the different queries using the above formu-las. Based on these assessments, after the execution of queries, we measured recall and precision (using the above formulas) for the service operations that were returned for each query message, at 10 successive distance cut-off levels (dt); i.e., for
enabled the evaluation of recall and precision when consider-ing results at different distance levels. The main findconsider-ings of the recall and precision evaluation of the framework are discussed below.
Overall Performance
Table 1 shows cumulative precision (P) and recall (R) measures taken at successive overall cut-off distance lev-els (dt) between query messages and service operations
(i.e., for operations having up to a dt distance from the
relevant query message). The shown recall and precision measures are averages of recall and precision measures obtained across the individual messages of the different queries for different distance cut-off points using formu-las (1) and (2). They are also based on: (i) overall query message to service operation distances computed using ws=0.6, wb=0.35 and wsc=0.05 as weights, and (ii)
aggre-gate assessments of relevance that were derived from in-dividual relevance assessments of the six users using the voting scheme discussed in Subsection 5.1. The values of the weights used in the experiments demonstrate the im-portance of the different factors for the scenarios.
TABLE1
OVERALL RECALL AND PRECISION FOR ALL QUERIES
k=1 k=0
D(≤dt) R P R P
0.1 0.10 0.97 0.19 0.86 0.2 0.54 0.74 0.67 0.42 0.3 0.80 0.30 1.00 0.15 0.4 0.83 0.22 1.00 0.11 0.5 0.95 0.07 1.00 0.03 0.6 1.00 0.03 1.00 0.01 0.7 1.00 0.03 1.00 0.01 0.8 1.00 0.03 1.00 0.01 0.9 1.00 0.03 1.00 0.01 1 1.00 0.03 1.00 0.01
The assessments of relevance that were used to evalu-ate recall and precision in the case of exact matching dis-tances (i.e., when k=0) were different from those used for inexact matching distance (i.e., when k=1). More specifi-cally, for k=0 we used assessments of relevance formu-lated by users after considering the relevance criterion RC1 (consideration of service and query message opera-tion signatures and behaviour and the existence of an ex-act behavioural matching). For k=1, we used assessments of relevance formulated by the users after considering the criterion RC2 (consideration of service and query message operation signatures and behaviour and the existence of a non exact but good behavioural matching).
As shown in the table, precision was high for service op-erations with a distance of up to 0.1 from a query message since 97% and 86% of the retrieved operations in this dis-tance range on average were relevant in the case of inexact and exact matching, respectively. For operations with dis-tances up to 0.2, precision dropped to 74% in the case of in-exact matching and 42% in the case of in-exact matching. Re-call reached its maximum value of 1.0 when considering service operations with a distance of up to 0.3 in the case of exact matching and up to 0.6 in the case of inexact
matching. These findings indicate that the users of the framework should expect a high accuracy of results when considering service operations whose distance from a query message is up to 0.2 in the case of inexact matching and up to 0.1 in the case of exact matching, but need to consider the relevance of service operations carefully for distances higher than these values depending on the required matching flexi-bility. Furthermore, to ensure that no relevant results are missed, all service operations with a distance of up to 0.3 or 0.6 need to be considered, when exact and inexact matching are deployed, respectively.
The results shown in Table 1 also indicate that the pre-cision of inexact matching was higher than the prepre-cision of exact matching for all distance cut-off levels (see col-umns (k=1)-P and (k=0)-P in Table 1). The statistical sig-nificance of the difference in precision between inexact and exact matching was tested using the paired t-test. The use of this test in checking the statistical significance of comparative evaluations of the precision and recall of IR methods is supported by different studies and evidence that t-test produces reliable results even when assump-tions about the normality of underpinning data do not hold [23][47].
The t-test was applied to pairs of cumulative precision rates that were calculated for each query message of the queries used in the experiments by the two types of matching for each distance cut-off level. The use of the test indicated that the observed differences at all the dif-ferent distance cut-off levels were statistically significant at α=0.05 (the probability p yielded by the t-test for the different cut-off points ranged from 0.00025 to 0.0425)5.
The same test was applied to the recall measures of the two types of matching. As shown in Table 1, the recall of exact matching was higher than the recall of inexact matching until the distance cut-off level of 0.5. This dif-ference was also statistical significant at α=0.05.
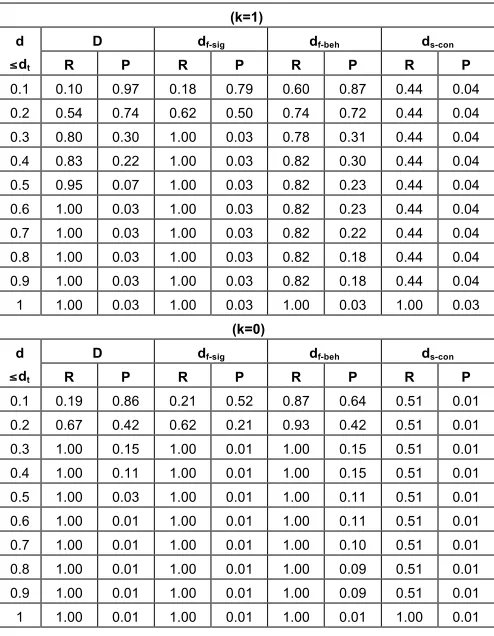
Effect of Partial Distances on Precision and Recall In the evaluation, we also investigated differences in the re-call and precision measures produced by different partial dis-tances. Table 2 presents the average recall and precision meas-ures that were obtained at different distance cut-off levels based on the different types of distances computed by the framework, namely the overall (D), signature (df-sig),
behav-ioural (df-beh), and soft constraint distances (df-con).
As shown in the table, the precision of results based on overall distances was higher than the precision of results based on signature distances only for all the cut-off distance points up to 0.5 in both inexact and exact matchings. The statistical significance of this difference was examined using the paired t-test and found to be statistically significant at
α=0.05 for all the cut-off distance levels up to 0.5.
The overall distance was also found to generate more precision results than the behavioural distance at the first cut-off point (0.1) for both types of matching (the differ-ences at this level were statistically significant at α=0.025 in both cases). However, for higher cut-off points, the pic-ture was mixed. In particular, the differences in the
preci-5 p is the probability of the two samples coming from a population with
[image:12.595.72.261.319.482.2]sion of the overall and behavioural distance results were not statistically different at the cut-off point 0.2 in the case of exact matching and at the cut-off points 0.2 and 0.3 in the case of inexact matching. Following these two cut-off points, the differences in precision between these two distances became statistically significant again at α=0.025 but this time the behavioural distance was found to gen-erate results of higher precision. The reason for this phe-nomenon might be an increased focus of the users on be-havioural aspects when service operations start being dissimilar to query messages.
Finally, the precision of the overall distance clearly outper-formed the precision of the constraint distance at all cut-off points and the observed differences were statistically signifi-cant at α=0.025.
The behavioural distance also produced more precise results than the signature distance at all the distance cut-off points for both types of matching, as shown in Table 2. However, the observed differences in the precision of these two distances were statistically significant at
α=0.025 for all but the first cut-off point (i.e., 0.1).
TABLE2
RECALL AND PRECISION OF DIFFERENT DISTANCES
(k=1)
D df-sig df-beh ds-con
d
≤dt R P R P R P R P
0.1 0.10 0.97 0.18 0.79 0.60 0.87 0.44 0.04 0.2 0.54 0.74 0.62 0.50 0.74 0.72 0.44 0.04 0.3 0.80 0.30 1.00 0.03 0.78 0.31 0.44 0.04 0.4 0.83 0.22 1.00 0.03 0.82 0.30 0.44 0.04 0.5 0.95 0.07 1.00 0.03 0.82 0.23 0.44 0.04 0.6 1.00 0.03 1.00 0.03 0.82 0.23 0.44 0.04 0.7 1.00 0.03 1.00 0.03 0.82 0.22 0.44 0.04 0.8 1.00 0.03 1.00 0.03 0.82 0.18 0.44 0.04 0.9 1.00 0.03 1.00 0.03 0.82 0.18 0.44 0.04 1 1.00 0.03 1.00 0.03 1.00 0.03 1.00 0.03
(k=0)
D df-sig df-beh ds-con
d
≤dt R P R P R P R P
0.1 0.19 0.86 0.21 0.52 0.87 0.64 0.51 0.01 0.2 0.67 0.42 0.62 0.21 0.93 0.42 0.51 0.01 0.3 1.00 0.15 1.00 0.01 1.00 0.15 0.51 0.01 0.4 1.00 0.11 1.00 0.01 1.00 0.15 0.51 0.01 0.5 1.00 0.03 1.00 0.01 1.00 0.11 0.51 0.01 0.6 1.00 0.01 1.00 0.01 1.00 0.11 0.51 0.01 0.7 1.00 0.01 1.00 0.01 1.00 0.10 0.51 0.01 0.8 1.00 0.01 1.00 0.01 1.00 0.09 0.51 0.01 0.9 1.00 0.01 1.00 0.01 1.00 0.09 0.51 0.01 1 1.00 0.01 1.00 0.01 1.00 0.01 1.00 0.01
In the case of recall, the signature distance produced better results than the overall distance for all cut-off points up to 0.5 in the case of inexact matching, and the observed differ-ences were statistically significant at α=0.025. In the case of exact matching, however, the differences in the recall of these two distances were neither consistent nor statistically significant.
A mixed picture of recall differences was observed across
signature and behavioural distances. More specifically, the behavioural distance generated higher recall for the first two cut-off distance levels (0.1 and 0.2) for both types of match-ing. The differences for the 0.1 cut-off level were statistically significant at α=0.025 for both types matching. At the 0.2 cut-off level, however, the recall difference was statisti-cally significant (at α=0.025) only in the case of exact matching. For cut-off levels greater than 0.2, however, the signature distances resulted in statistically better recall measures than behavioural distances (at α=0.025) in the case of inexact matching, or equal recall measures in the case of exact matching.
Effect of Matching Flexibility on Precision and Recall The effect of matching flexibility in recall and precision was also analysed in the experiments.
As discussed earlier, inexact matching (k=1) resulted in sta-tistically significant higher average precision than exact matching (k=0) in the case of overall distances across all the distance cut-off points. Also exact matching resulted in statis-tically significant higher recall than inexact matching for all the distance cut-off levels up to 0.5, as discussed earlier.
The application of the t-test on the precision and recall measures associated with the different partial distances across the two types of matching indicated further statis-tically significant differences. More specifically, the differ-ences in the precision of both the signature distances and the behavioural distances across the two types of match-ing flexibility were also statistically significant for all the distance cut-off points at α=0.025. Also, the recall of be-havioural distances in exact matching was higher than the recall of the same distances in inexact matching up to dis-tances of 0.9 and the relevant differences were statistically significant at α=0.025. In the case of structural distances, however, no statistically significant differences were ob-served in the recall measures.
5.3 Performance Evaluation Results
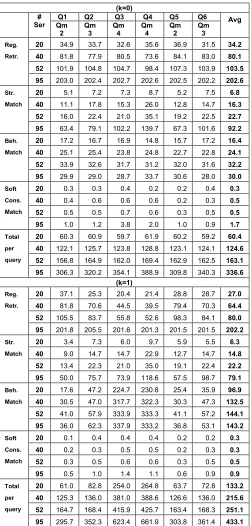
The performance evaluation focused on the time to execute queries Q1 to Q6. This time was measured for flexibility matching levels k=0 and k=1 and for service registries with 20, 40, 52, and 95 services, in order to analyze whether in-crements in these two factors affect the performance of the discovery process. All the queries were executed on an Intel Core 2 Duo machine, with 2.33 GHz and 500 MB Ram.
Table 3 presents the results of the execution times in sec-onds for Q1 to Q6 and flexibility matching k=0 and k=1. The results shown for each query Qi represent the average
execu-tion time of Qi that was taken across ten different executions
of it for each of the different sizes of the registry used in our experiment. For each query, the table shows the average time taken to: (a) retrieve services from the registry, (b) execute structural matching, (c) execute behavioral matching, (d) execute soft constraint matching, and (e) execute whole query (rows Total per query). Table 3 also presents the total average time to execute all queries for each different number of services (column Avg) and the number of the query mes-sages in each query (row Qm in the table).
[image:13.595.45.292.334.652.2]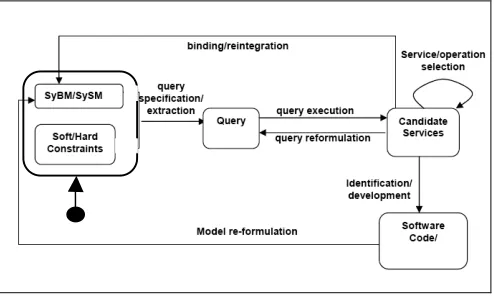

![TABLE tions about the normality of underpinning data do not ECALL AND 1 PRECISION FOR ALL QUERIES hold [23][47]](https://thumb-us.123doks.com/thumbv2/123dok_us/1614289.114424/12.595.72.261.319.482/table-tions-normality-underpinning-data-ecall-precision-queries.webp)