R E S E A R C H A R T I C L E
Open Access
The p52 isoform of SHC1 is a key driver of
breast cancer initiation
Kevin D. Wright
1,2, Bradley S. Miller
1,2, Sarah El-Meanawy
6,7, Shirng-Wern Tsaih
1,3, Anjishnu Banerjee
4,
Aron M. Geurts
1,3, Yuri Sheinin
5, Yunguang Sun
5, Balaraman Kalyanaraman
6,7, Hallgeir Rui
5, Michael J. Flister
1,3and
Andrey Sorokin
1,2*Abstract
Background:SHC1 proteins (also called SHCA) exist in three functionally distinct isoforms (p46SHC, p52SHC, and p66SHC) that serve as intracellular adaptors for several key signaling pathways in breast cancer. Despite the broad evidence implicatingSHC1gene products as a central mediator of breast cancer, testing the isoform-specific roles of SHC1 proteins have been inaccessible due to the lack of isoform-specific inhibitors or gene knockout models. Methods:Here, we addressed this issue by generating the first isoform-specific gene knockout models for p52SHC and p66SHC, using germline gene editing in the salt-sensitive rat strain. Compared with the wild-type (WT) rats, we found that genetic ablation of the p52SHC isoform significantly attenuated mammary tumor formation, whereas the p66SHC knockout had no effect. Rats were dosed with 7,12-dimethylbenz(a)anthracene (DMBA) by oral gavage to induce mammary tumors, and progression of tumor development was followed for 15 weeks. At 15 weeks, tumors were excised and analyzed by RNA-seq to determine differences between tumors lacking p66SHC or p52SHC.
Results:Compared with the wild-type (WT) rats, we found that genetic ablation of the p52SHC isoform significantly attenuated mammary tumor formation, whereas the p66SHC knockout had no effect. These data, combined with p52SHC being the predominant isoform that is upregulated in human and rat tumors, provide the first evidence that p52SHC is the oncogenic isoform ofShc1gene products in breast cancer. Compared with WT tumors, 893 differentially expressed (DE; FDR < 0.05) genes were detected in p52SHC KO tumors compared with only 18 DE genes in the p66SHC KO tumors, further highlighting that p52SHC is the relevant SHC1 isoform in breast cancer. Finally, gene network analysis revealed that p52SHC KO disrupted multiple key pathways that have been previously implicated in breast cancer initiation and progression, including ESR1 and mTORC2/RICTOR.
Conclusion:Collectively, these data demonstrate the p52SHC isoform is the key driver of DMBA-induced breast cancer while the expression of p66SHC and p46SHC are not enough to compensate.
Keywords:DMBA, Shc proteins, Breast cancer, Signaling, Rat model
Background
The progression of breast carcinomas is controlled by the aberrant expression of a variety of signaling mole-cules expressed in the mammary tumor itself, or in cells
of the tumor microenvironment [1,2]. The principal
fac-tors that control mammary tumor formation remain
unclear and insufficiently defined. Mediating some of these signals are the SHC adaptor proteins. Many studies have implicated SHC1 involvement in signaling by epidermal growth factor receptor-2 (HER-2), estrogen receptor (ER), and prolactin (PR) signaling, three
well-established biological markers for prognosis and
response to breast cancer therapy [3–5]. More recently,
increased expression of the p66SHC isoform was shown to occur in cell lines with increased metastatic potential and in patient samples with metastatic breast tumors [5–7]. However, to date, there has been no direct in vivo
© The Author(s). 2019Open AccessThis article is distributed under the terms of the Creative Commons Attribution 4.0 International License (http://creativecommons.org/licenses/by/4.0/), which permits unrestricted use, distribution, and reproduction in any medium, provided you give appropriate credit to the original author(s) and the source, provide a link to the Creative Commons license, and indicate if changes were made. The Creative Commons Public Domain Dedication waiver (http://creativecommons.org/publicdomain/zero/1.0/) applies to the data made available in this article, unless otherwise stated. * Correspondence:[email protected]
1
Cardiovascular Center, Medical College of Wisconsin, 8701 Watertown Plank Road, Milwaukee, WI 53226, USA
2Department of Medicine, Medical College of Wisconsin, 8701 Watertown
Plank Road, Milwaukee, WI 53226, USA
examination of the role of specific SHC1 protein iso-forms in the progression of mammary tumorigenesis.
The ubiquitously expressed adaptor protein SHC1 [8] exists in three isoforms with relative molecular masses of 46 kDa, 52 kDa, and 66 kDa (p46SHC, p52SHC, and
p66SHC) encoded by single gene SHC1 (also known as
SHCA). p46SHC and p52SHC arise from the use of
alternative translation initiation sites within the same transcript, whereas p66SHC isoform contains a unique N-terminal region and is believed to be generated as a result of activation of an alternative promoter [9]. Al-though all three Shc proteins contain a recognition site for the SH2 domain of the adaptor protein GRB2, a number of studies have suggested distinct physiological roles for the three isoforms [10–12]. Additionally, differ-ent intracellular localization patterns have been reported for each (reviewed in [12]). Moreover, it has been shown
that p66Shc and p46Shc/p52Shc exert
counter-regulatory effects on the c-fos promoter [11]. This has
given rise to the general consensus that isoform p52SHC functions as an adaptor protein linking receptor tyrosine kinases and G-protein-coupled receptors with the RAS signaling cascade, while p66SHC isoform contributes to reactive oxygen species (ROS) production as well as regulation of vascular contraction [12]. While early stud-ies suggested p46SHC functions to be like p52SHC, re-cent data indicate a distinct role for p46SHC in the
mitochondria [12,13].
In mice, the polyomavirus middle T antigen (MT) model is frequently used to study mammary tumor pro-gression. Several lines of evidence suggest the direct
in-volvement of products of theShc1gene in the regulation
of breast cancer initiation and progression in this model
[14,15].Shc1products have been shown to directly bind
to the MT antigen protein, serving as an adaptor protein leading to activation of downstream signaling cascades such as RAS/MAPK and PI3K, all of which have a posi-tive effect on tumorigenesis [14]. Furthermore, increased
expression of Shc1 gene products have been shown to
accelerate tumorigenesis in the MT antigen model, indi-cating its importance in this model of breast cancer [16].
More recently, studies have shown thatShc1gene
prod-ucts in this model further function in a paracrine man-ner to promote a pro-tumorigenic state by inhibiting the
adaptive immune response [17, 18]. These data clearly
indicate both cell autonomous function, as well as
microenvironment effects ofShc1products in this model
of mammary tumorigenesis. However, in these studies, the role of individual SHC1 isoforms have not been tested, as many of the mutations in the previous studies will alter all three Shc1 protein isoforms, or overexpres-sion systems will produce multiple SHC1 protein iso-forms. Furthermore, this is an activated model in which increased expression of several well-known signaling
pathways promotes tumorigenesis. This model does not address the role of SHC1 proteins in spontaneous le-sions and tumorigenesis that is more typical of human populations that develop mammary cancer.
For these reasons, we generated the first animal
models for Shc1-isoform-specific knockout of the
p52SHC (p52SHCKO) isoform and first rat knockout of
p66SHC (p66SHCKO) isoform [19] in the SS/
JrHsdMcwi (SS) genetic background, which is a well-studied rat parental background for breast cancer risk [20, 21]. Mammary tumors were induced by the oral administration of 7,12-dimethylbenz(a)anthracene (DMBA), a known inducer of breast cancers that introduce random mutations into the genome and develop spontaneous
mam-mary tumors [22–24]. DMBA-induced tumors are typically
ER+ and PR+ lesions and serve as excellent models to study these types of tumors, as these represent a clinically needed model [25]. In humans, ER+ tumors represent tumor types successfully targeted by hormone therapy; however, few clinical options remain in case of cancer relapse. Accord-ingly, analysis of tumor incidence, latency, and molecular characteristics of mammary tumors in the rat DMBA model could provide data relevant for breast cancer treat-ment in humans. Here, we show for the first time that
p52SHC is the predominant Shc1 isoform that mediates
mammary tumorigenesis via multiple key signaling path-ways, whereas the p66SHC isoform is expendable in DMBA-induced tumorigenesis.
Methods
Animals
All studies were performed on rats generated and maintained on the SS/JrHsdMcwi (SS) genetic background. Generation of the p66SHC-KO rats has been described previously [19]. Briefly, p52SHC knockout rats (SS-Shc1em6Mcwi) were gener-ated by pronuclear injection of a CRISPR plasmid expressing Cas9 and single-guide RNA targeting the sequence CACT CAGCTTGTTCATGTCCTGG (protospacer adjacent motif underlined) into one-cell SS (SS/JrHsdMcwi) rat embryos. Founder animals were genotyped by Cel-1 assay and con-firmed by Sanger sequencing to identify a founder animal harboring a 6-bp deletion including the p52SHC initiation codon. All subsequent litters are genotyped using the
follow-ing primers: p52ShcKO forward 5′
-CCCTCCTCCAGGA-CAAGC-3′; wild-type forward 5′-TCCTCCAGGACATG
AACAAGC-3′; common reverse 5′
-TATGCACTCACCC-GAACCAA-3′. p52SHC-KO rats are born in the expected
Mammary tumor model
To induce mammary tumors, 45- to 55-day-old female
rats (WT n= 14, p52SHC-KO n= 12, p66SHC-KO n=
13) were administered 65 mg/kg of body weight of 7,12-dimethylbenz(a)anthracene (DMBA) by oral gavage, as described [20]. Animals were then palpated weekly for tumor formation in the mammary fat pads. The latency of tumor development is defined as the time between DMBA administration and detection of the first tumor, whereas tumor multiplicity is the number of tumors per rat at week 15. At week 15 post-DMBA, rats were
eutha-nized by CO2 asphyxiation and number of tumors and
total tumor burden per rat were recorded. Tumor bur-den is calculated as the sum total weight of all tumors from one animal.
Whole-mount stain of mammary glands
Carmine alum staining of whole inguinal mammary glands was performed using standard protocols. Briefly, excised fourth and fifth mammary glands from the left and right side of adult approximately three-month-old rats were stretched and pressed onto a 2 × 3 in. glass slide and fixed 24 h in Carnoy’s fixative. Following
rehy-dration to H2O, slides were stained in Carmine Alum
stain 24 h and then serially dehydrated in ethanol.
Fi-nally, slides were cleared in Histo-Clear™ clearing
re-agent up to 72 h until translucent and coverslipped using Histomount mounting media. Images were taken on a Nikon SMZ1500 microscope.
RT-qPCR
Quantitative real-time PCR was performed using Power
SYBR™ Green PCR Master Mix (Invitrogen) on a
Tis-sueScan cancer survey cDNA panel (OriGene), covering 8 different cancers, with three normal tissue controls and 9 samples for each type of cancer included. Primers were validated for efficiency using cDNA from human mesangial cell cultures, known to express all three SHC protein isoforms. Additionally, dissociation curve ana-lysis and gel electrophoresis of PCR products were used to validate specificity. Primer sequences were p52Shc/
p46Shc forward 5′-GGCCCTGGACATGAACAA-3′ and
reverse 5′-CCATGACTTTGTCGTTGGGA-3′; p66Shc
forward 5′-CTGAAACTGTCTGGGTCTGAG-3′and
re-verse 5′-TAGCCTGGTTGGACCTCT-3′;β-actin control
primers were provided with the TissueScan kit and were used as a reference gene.
RNA-seq
Total RNA was extracted by Trizol from whole tumors
that were excised from WT (n= 5), p52SHC-KO (n= 5),
and the p66SHC-KO (n= 5), followed by library
prepar-ation using Illumina’s TruSeq RNA library kit and
se-quencing on an Illumina HiSeq2500 (Illumina, Inc., San
Diego, CA). Individual libraries were prepared for each sample, indexed for multiplexing, and then sequenced on an Illumina HiSeq2500. The Trim Galore program (v0.4.1) was used to trim bases with a Phred quality score < 20 [https://www.bioinformatics.babraham.ac.uk/ projects/trim_galore/] and only reads with a Phred qual-ity score equal or higher than 20 were taken for analysis.
The RSEM program function “rsem-prepare-reference”
(v1.3.0) was used to extract the transcript sequences from the rat genome (build Rnor6.0) [26] and to gener-ate Bowtie2 indices (Bowtie2 v2.2.8) [26], followed by
read alignment using the “rsem-calculate-expression”
function. Differential expression analysis was performed using the Bioconductor package DESeq2 version 1.12.4 to compute log2 fold changes and false discovery rate-adjustedP values [27]. Statistical significance was deter-mined at a false discovery rate threshold of 0.05. Data were analyzed for molecular and functional pathway en-richment using Ingenuity Pathway Analysis (IPA; Qia-gen, Redwood City, CA, USA).
Western blot
Frozen OCT-embedded human breast tissue (tumor and matched normal) was obtained from the Medical College of Wisconsin Tissue Bank. For these specimens, normal tissue is defined as being distant from the tumor of the same patient that has no visual tumor present as deter-mined by the pathologist at the time of procurement. Specimens were washed with PBS to remove OCT com-pound before protein extraction, performed using a Potter-Elvehjem homogenizer followed by sonication in RIPA buffer. Lysates were centrifuged to remove debris, and protein was measured using the BCA assay (Thermo
Fisher) and frozen at −80 °C before SDS-PAGE western
blot analysis. SHC protein expression was analyzed using anti-SHC1 antibody (EMD Millipore 06-203) (dilution 1: 2000) followed by IRDye800 secondary antibodies (Li-COR). Total protein was assessed by REVERT (Li-(Li-COR).
Human INSTA-Blot™Breast Tissue OncoPair (Novus
Bi-ologicals #NBP2-30128) ready-to-use PVDF membranes were used to assess total SHC proteins expressions in
human breast cancer and normal adjacent tissue, 14μg
total protein per sample. Total protein was assessed by amido black stain provided by the manufacturer. Mem-brane was blotted with anti-SHC1 supplemented with anti-p66SHC antibody (Biosource 44829M) (dilution 1: 1000) followed by goat rabbit-HRP and goat anti-mouse-HRP (Biorad) (dilution 1:2000), according to
manufacturer’s protocol. For rats, tumor and distant
anti-SHC1 antibody (EMD Millipore) (dilution 1:1000) and
anti-β-actin (Sigma) (dilution 1:2000) overnight in 1:1
Odyssey Blocking Buffer/TBST. Membranes were rinsed in TBST and incubated with appropriate IRDye second-ary antibodies (Li-COR) at dilution 1:15,000. Membranes were scanned on a LI-COR Odyssey scanner.
Immunohistochemistry
Staining for ER, PR, HER2, and SHC1 was performed using Dako EnVision FLEX mini Kit on a Dako Autostai-ner Omnis (Agilent, Santa Clara, CA). High-resolution digital images were captured at × 20 using a Pannoramic 250 Flash III slide scanner (3DHISTECH Ltd., Budapest, Hungary). ER, PR, HER2, and SHC1 were detected using EnVision FLEX Target Retrieval Solution Low pH (Citrate buffer, pH 6.1, Agilent) and incubation with anti-ER (1: 200, ab3575, Abcam, Cambridge, MA), anti-PR (1: 2000, ab16661, Abcam), anti-HER2 (1:400, A0485, Agilent), and anti-SHC (1:50, 06-203, Sigma) for 30 min, followed by secondary antibody (Polymer) for 30 min. Counterstaining with hematoxylin, dehydration, clearing, and coverslipping was performed. The Dako HER2 antibody recognizes rat HER2 [28].
Statistical analysis
Tumor latency and multiplicity between genotypes were
analyzed by a multiple comparison test using Tukey’s
method and adjusted using single-step Bonferroni. To compare tumor latency at 5, 10, and 15 weeks, a non-parametric survival regression model was used (with tu-mors never developed being treated as right-censored observations), while pair-wise comparisons were per-formed using a two-sample melded BPCP test. Total tumor burden was calculated as the sum of all tumors extracted from each rat. Total tumor burden between genotypes was compared using the non-parametric Kruskal-Wallis test (since the data appeared to be non-normal), followed by testing of pairwise contrasts using
Dunn’s test. Multiplicity adjustments for the P values
were done using Holm’s method. For western blot
semi-quantitative analysis, group means were compared using the Mann-Whitney rank sum test.
Results
Expression ofSHC1gene products are upregulated in mammary tumors
According to the Human Protein Atlas, in breast carcin-omas, there is a difference in expected outcome between
patients expressing high levels ofSHC1RNA and patients
expressing low levels ofSHC1RNA based on best
separ-ation (P= 0.0412), but not median separation (P= 0.0928) [29]. Even though these data suggest the significance of
high levels ofSHC1RNA for the worst expected outcome
of breast cancer, they do not address the impact of
individual protein isoforms in the progression of breast
carcinomas. In mammals,SHC1 is expressed as two
dis-tinct transcripts based on the utilization of alternate pro-moters [9]. The shorter (3062 bp) transcript, termed here the p52SHC/p46SHC transcript, contains in-frame initi-ation codons for both p52SHC and p46SHC. The longer (3481 bp) transcript, termed the p66SHC transcript, con-tains initiation codons for all three protein isoforms, but is considered to serve predominately as a source of p66SHC. A broad human TissueScan cancer survey panel was screened for expression of both SHC1 transcripts. Each
panel contained cDNA, normalized forβ-actin expression,
from 9 cancer samples from individual patients of increas-ing stage from 8 different cancer types and three normal tissues [30]. Expression of p52SHC/p46SHC transcript was upregulated more than 2-fold (*) compared to non-cancer tissue in 5 out of the 9 breast non-cancer samples, with one additional sample being greater than 1.5 times (#)
higher (Fig.1a) when compared to the median non-tumor
samples. According to supplied information from Ori-Gene, most of the tumors assayed are estrogen receptor (ER) and prolactin receptor (PR) positive, with mixed
Her2 positive staining (Additional file 1: Figure S1). In
contrast, no significant changes in p52SHC/p46SHC tran-script were observed in colon, ovary, and thyroid cancers. Prostate, lung, kidney, and liver carcinomas exhibited vari-able expression in p52SHC/p46SHC expression, ranging between 1.5- and 2-fold increase over normal tissue
(Fig. 1a). Breast carcinomas were unique in that most
samples expressed the p52SHC/p46SHC transcript 2-fold higher than the normal breast tissues. Expression of the
p66SHC transcript, the lesser-expressed Shc1 transcript,
was below detectable levels in most normal and some breast tumor samples (data not shown). Additionally, p66SHC transcript levels were below detectable levels in many of the tumor samples across all cancer types (data not shown).
To assess differences in expression of all three SHC1 protein isoforms in human breast tumors, we have ana-lyzed 9 independent breast cancer tumor samples (T) paired with matched normal protein samples (N) from tissues obtained from MCW Tissue Bank. It is of note,
that in all (five) ER+/PR+/HER2−breast cancer samples,
we detected the increased expression of p52SHC and p46SHC whereas the difference in p66SHC expression
was not observed (Fig. 1b, c). The tumor/stroma
com-position (contribution of normal mammary epithelial)
was quantified by a pathologist (Additional file 5: Table
S1). Although triple negative tumors appeared to have increased SHC1 proteins levels, the differences did not reach significance compared to normal tissues when
normalized to the total amount of protein (Fig. 1d, e).
Additionally, commercial INSTA-Blot™ OncoPair
recognizes all three isoforms, concurrently with an N-terminal p66Shc antibody. Comparison of seven inde-pendent tumor samples of increasing grade and stage [31] with matched normal protein samples from adja-cent tissues indicated that p52SHC and p46SHC iso-forms were upregulated in 6 out of 7 tumor samples
compared to normal-paired samples (Fig. 1f ). Likewise,
3 out of 7 tumor samples expressed increased levels of p66SHC protein compared with the normal-paired breast tissues. Similar to observations made with human breast tissue, the analysis of DMBA-induced rat tumors compared with normal rat mammary tissue revealed
in-creased expression of all SHC1 isoforms (Fig. 1g).
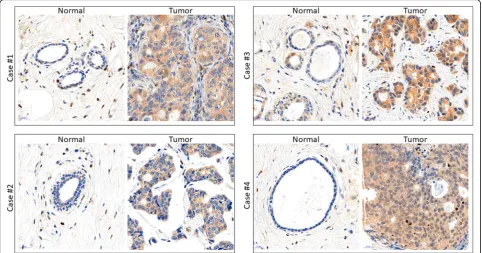
Im-munohistochemical staining of SHC1 proteins showed markedly elevated expression of SHC1 proteins in breast cancer cells compared to adjacent normal breast
epithe-lia or stromal cells, both in human (Fig. 2) and rat
tu-mors (Additional file2: Figure S2).
The p52SHC isoform is required for DMBA-induced mammary tumor formation
Individual contributions of p66SHC and p52SHC in the development and progression of breast cancer are un-clear. Since both p66SHC and p52SHC protein levels were elevated in some human and in rat DMBA-induced
tumors (Fig.1d, e), we utilized rats in which p66SHC or
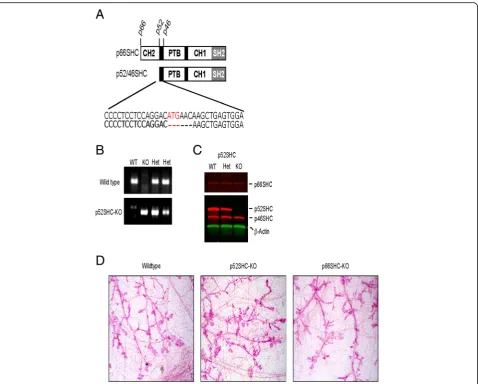
p52SHC proteins were genetically removed to study the consequence of their loss on DMBA-induced mammary tumor formation. The p66SHC knockout (p66SHC-KO) was generated by targeting the unique sequence of p66Shc using Zinc Finger technologies and has been previously described [19]. For the first time in any spe-cies, a p52SHC knockout was generated using CRISPR/ Cas-9 genomic editing [32]. A single founder was
Fig. 1Upregulation ofSHC1p46SHC/p52SHC transcript and SHC proteins in human breast cancers.aQuantitative real-time RT-PCR analysis ofSHC1p52SHC/p46SHC transcript levels on a TissueScan cancer survey panel of the breast, colon, prostate, lung, ovary, thyroid, kidney, and liver non-tumor tissue (red bars) and tumor tissue (black bars). Expression is normalized to the median non-cancerous tissue samples. Expression of p52SHC/p46SHC transcript greater than 1.5 is indicated with a number sign, while expression greater than 2 times is indicated with an asterisk.bWestern blot analysis of SHC1 isoform expression of paired ER+/PR+/HER2−tumor (T) and non-tumor (N) samples, 5μg/lane. Lane numbers are indicated at the bottom.c Quantification of data frombpanel by normalization to total protein, where *P= 0.008.dWestern blot analysis of SHC1 in triple negative ER
[image:5.595.57.291.86.546.2]generated in which 6-base pairs, including the p52SHC ATG initiation codon, were deleted (termed
p52SHC-KO, Fig. 3a). This deletion resulted in a 2-amino acid
loss from p66SHC protein that was not predicted to alter p66SHC function. The deleted amino acids are not located in any known functional protein domains [12]. Furthermore, p52SHC-KO rats do not exhibit common phenotypes associated with p66SHC loss of function when placed on a high salt diet (data not shown), sug-gesting a normal p66SHC function in the p52SHC-KO rats. Additionally, the p46SHC sequence was preserved. Importantly, the mutation did not alter expression of ei-ther p66SHC or p46SHC protein levels, while p52SHC isoform lacks completely as detected by PCR genotyping
(Fig. 3b) and western blot using a total SHC1 antibody
(Fig. 3c, Additional file 3: Figure S3). Absence of
p66SHC band by western blot analysis in p66SHC-KO, but not in WT or p52SHC-KO rats is also demonstrated
(Additional file 3: Figure S3). Additionally, both
p52SHC-KO and p66SHC-KO rats can be maintained at homozygous knockouts and give birth to average litter size and pup size (data not shown). There was no differ-ence in the mammary gland structure between WT,
p52SHC-KO, and p66SHC-KO rats (Fig.3d). No masses,
cysts or other lesions were identified across all three groups. Thus, changes in the development of mammary glands due to p52SHC or p66SHC ablation are likely not responsible for differences in DMBA-induced mammary
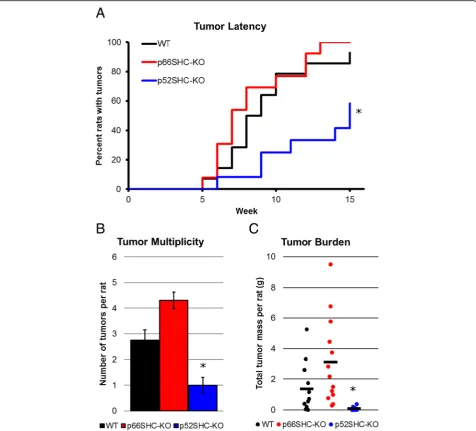
tumor formation. Following administration of DMBA, loss of p52SHC resulted in an increase in tumor latency and a decrease in tumor incidence to 58.3% (7 of 12) by 15 weeks, compared to WT (92.9%, 13 of 14) and
p66SHC-KO (100.0%, 13 of 13), (P= 0.038 andP= 0.003,
respectively, Fig. 4a). Differences in tumor development
were apparent as early as 10 weeks post-DMBA in a pair-wise comparison, 25.0% (3 of 12) p52SHC-KO rats had tumors compared to 78.6% (11 of 14) for WT and
76.9% (10 of 14) p66SHC-KO (P= 0.02 and P= 0.03
re-spectively). There was no difference in latency between WT and p66SHC-KO at any point during the 15-week
time course (P= 0.4). During the 15 weeks that tumor
progression was analyzed, rats were individually palpated for the presence of tumors. It may be possible that very small lesions were missed in the analysis. In addition to increased latency, p52SHC-KO rats also had lower tumor multiplicity, averaging 1.0 ± 0.3 tumors per rat compared to 2.75 ± 0.4 and 4.31 ± 0.3 tumors in WT and
p66SHC-KO, respectively (P= 0.002 and P< 10−4
, Fig. 4b). Furthermore, p52SHC-KO rats had a lower overall tumor burden per rat, 0.08 ± 0.04 g, compared to WT, 1.34 ± 0.5 g, and p66SHC-KO rats, 3.10 ± 0.8 g, re-spectively (P< 0.02 and P< 10−5, Fig. 4c). In contrast, p66SHC-KO rats trended towards increased multiplicity and tumor burden compared to WT DMBA-induced
rats but was not significant (P= 0.09 and P= 0.08). We
[image:6.595.57.540.89.342.2]of DMBA-induced mammary tumors formed in our gen-etically modified rats (Additional file6: Table S2). All an-alyzed DMBA-induced tumors were ER and PR positive and HER2 negative.
RNA-seq analysis reveals significant changes in the p52SHC tumor transcriptome
To begin identifying gene networks that are mediated by p52SHC and p66SHC in breast cancer, RNA-seq was
performed on mammary tumors derived from WT (n= 4),
p52SHC-KO (n= 5), and p66SHC-KO (n= 5) rats.
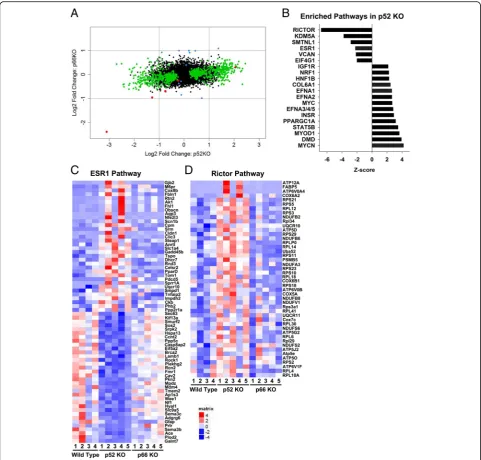
Com-pared with the WT tumors, 893 genes were differentially expressed (DE; FDR < 0.05) in the p52SHC-KO tumors, whereas only 18 DE genes were detected in the
p66SHC-KO tumors (Fig.5a, Additional file7: Table S3). Although
the WT and p66SHC-KO tumors were largely indistin-guishable, gene ontology (GO) enrichment analysis using IPA revealed multiple enriched GOs in p52SHC-KO
tumors compared with WT (Fig.5b), including the ESR1
pathway (68 DE genes, Z-score =−2.2, P = 1.46 × 10⁻³
)
and the RICTOR/mTORC2 pathway (46 DE genes, Z
-score =−6.8, P = 6.17 × 10⁻¹⁹). Collectively, these data provide the first in vivo link between p52SHC isoform and well-known drivers of breast cancer.
Discussion
[image:7.595.60.539.86.470.2]onset of tumorigenesis observed in the mouse model of polyomavirus middle T antigen (MT)-induced mammary tumors in which critical tyrosine phosphorylation
resi-dues in SHCA are mutated (termed ShcA3Fand ShcA2F)
resulting in fewer tumors are likely due to phosphoryl-ation defects of the p52SHC isoform [17]. Indeed, the same phosphorylation of p66SHC can antagonize down-stream RTK signaling, whereas phosphorylated p52SHC activate signaling downstream of RTK [11]. In the p52SHC-KO animals, we report that despite being de-rived from the same mRNA transcript, those p46SHC protein levels are not increased as may be expected. This
is likely due to the role p46SHC is performing in normal cells. Recent data suggests that p46SHC expression is re-stricted to mitochondria where it acts to tightly regulate thiolase and lipid oxidation [13]. As such protein levels are likely to be highly regulated. However, in cancer cells, where p52SHC and p46SHC are overexpressed, studies have indicated p46SHC is able to co-precipitate (along with p52SHC, and sometimes p66SHC) with key factors regulating tumorigenesis and proliferation and are unable to distinguish distinct functions of p46SHC
or p52SHC [15, 16, 18, 33–36]. Data presented here
(Fig. 4) is the first to show that p52SHC is the
[image:8.595.60.537.88.519.2]predominant Shc1 isoform that mediates mammary tumorigenesis and that p66SHC and p46SHC are less likely to influence tumorigenesis to a major extent. In p52SHC-KO animals, even partial redundancy of ei-ther p66SHC or p46SHC may explain why some tu-mors do form. Furthermore, it must be mentioned that MT-induced mammary tumor model is a
non-random model of breast cancer, in which MT
interacts and activates a panel of host signaling mole-cules components of ERK, AKT and other signaling pathways, including SHC/MAPK cascade [37]. Since DMBA-induced mammary tumors in rats represent a model of random mutagenesis it resembles naturally occurring human ER+/PR+ luminal breast tumors [25, 38]. Evidence suggests that p66SHC, while expendable
in DMBA-induced tumors (Fig. 4), may function in
[image:9.595.57.539.87.547.2]tumors with higher metastatic potential [5–7], and as such p66SHC-KO rats should be used to study more metastatic models of breast cancer.
Estrogen signaling through ESR1, also known as ERα,
is well known in human breast cancers. Several lines of
evidence suggest co-regulation of 17β-estradiol (E2, the
ligand for ERα and ERβ) and growth factor signaling,
such as IGF and EGF, in the traditional genomic regula-tion of gene transcripregula-tion [4]. In addiregula-tion to serving as a co-regulator mediating growth factor signaling with the
canonical nuclear action of ERα, recent works have
highlighted non-genomic functions of ERα in reciprocal
activation of growth factor signaling pathways [4, 39].
Non-genomic activation of membrane ERα has been
identified in tumor cells that become hypersensitive to E2 during acquired resistance to hormone deprivation therapies, which appears to be dependent on SHC1 pro-teins. For example, SHC1 proteins directly interact with
ERα and mediate its translocation to the cell membrane
for docking with IGF-1R, which subsequently leads to activation of the RAS/MAPK signaling cascade at the
plasma membrane [40–42]. Ultimately, the
SHC1-mediated crosstalk between ERαand IGF-1R leads to
ro-bust activation of proliferation and suppression of
apop-tosis [40–42]. However, despite the evidence that SHC1
is a key mediator of non-genomic ERα mechanisms of
resistant to anti-estrogen therapy, the functionally sig-nificant role(s) of SHC1 isoforms were largely unclear. We addressed this question using RNAseq analysis of the p52SHC-KO and p66SHC-KO tumors, which
dem-onstrated that loss of p52SHC disrupts ERα signaling,
whereas deletion of p66SHC had no effects (Fig.5c).
To-gether, these data suggest that genes identified in our RNA-seq analysis of p52SHC-KO tumors represent a partial list of genes that are regulated by non-genomic
ERα activation of MAP Kinase/ERK signaling pathways
in a p52SHC-dependent manner. Analysis of ERK activa-tion in primary mammary epithelial cells isolated from WT and p52ShcKO rats revealed a slight decrease in ERK activation in p52ShcKO estradiol-treated cells when
compared to cells isolated from WT (Additional file 4:
Figure S4).
Identification of the RICTOR signaling pathway as be-ing significantly downregulated in p52SHC-KO tumors signifies a potential novel interaction between p52SHC and RICTOR/mTORC2 signaling pathway in mammary carcinogenesis. RICTOR, a defining component of mTORC2 (mammalian target of rapamycin complex 2), is involved in regulating kinases of the AGC group (named after the protein kinases A, G, and C families [43]. Majority of the RICTOR targets identified as being
differentially regulated (Fig. 5d) represent genes
identi-fied in a microarray of liver-specific conditional RICTOR knockout mice as components of a ribosomal protein
complex (EIF signaling) or oxidative phosphorylation pathways negatively regulated by RICTOR/mTORC2 signaling [44]. Coincidently, EIF2 signaling and oxidative phosphorylation represent two canonical pathways sig-nificantly dysregulated in p52SHC-KO mammary tu-mors (P value 2.18 × 10⁻¹²
and 2.18 × 10⁻¹⁰, respectively; data not shown). While mTORC2-dependent and mTORC2-independent functions of RICTOR are known [45–48], genes identified in the RNA-seq analysis appear to represent mTORC2-dependent functions of RICTOR signaling pathways, as loss of mTOR itself also causes significant changes in oxidative phosphorylation and
mitochondrial dysfunction [49, 50]. Additionally, mTOR
is reported to functionally co-regulate RNA polymerase II-dependent genes, such as ribosomal proteins, many of which are also identified in our RNA-seq analysis [51]. These data suggest a previously unrecognized role for p52SHC in the regulation of RICTOR/mTORC2 signal-ing pathways.
Conclusion
In summary, our data strongly suggest that p52SHC-dependent signaling is required for mammary tumor progression and suggest p52SHC may serve as node interlinking several critical signaling pathways implicated breast cancer progression. Lack of overlap of genes iden-tified as being dysregulated in ESR1 and RICTOR, signaling suggest p52SHC serves distinct functions regu-lating each of these pathways. Each of these pathways has been targeted therapeutically in order to combat the progression of mammary cancers in women. Our finding that p52SHC appears to be a central hub regulating these pathways provides a rationale for an exciting target for new drug therapies.
Additional files
Additional file 1:Figure S1.Hormone receptor expression status of human breast cancer samples used for qRT-PCR. Quantitative real-time RT-PCR of p52Shc/p46Shc transcript levels from TissueScan cancer survey panel of normal (red bars) and breast cancer (black bars), as seen in Fig.1. Corresponding expression of Estrogen Receptor (ER), Prolactin Receptor (PR), or Her2 Receptor (Her2) status of breast cancers used in the qRT-PCR assay. NA, not applicable; +, positive staining; +w; weak positive staining; BL, borderline expression; NR, status not reported. (TIFF 621 kb)
Additional file 2:Figure S2.Immunohistochemistry of SHC1 proteins shows the increased staining of SHC1 proteins in mammary carcinoma cells compared to adjacent normal breast epithelia or stromal cells in DMBA-induced rat breast cancer. Shown is expression of Shc1 proteins in two wild-type rat DMBA tumors. (TIF 794 kb)
by REVERT Total Protein Stain (LI-COR). Samples were run on the same gel, but were not contiguous. (TIF 330 kb)
Additional file 4:Figure S4.Western blot analysis of ERK1/2 stimulation. Primary mammary epithelial cells isolated from wild-type or p52ShcKO rats were serum-starved overnight and stimulated for 5 min with b-estradiol at the indicated concentrations. Western blot analysis is carried out with phosphospecific ERK antibodies. Positions of phospho-ERK 1 and 2 are indicated by arrows. Shown is a representative experi-ment out of 3. (TIF 105 kb)
Additional file 5:Table S1.Tumor sample composition. Pathologist quality control report on the cellular composition of tumor specimens from MCW Tissue Bank. Necrosis was not detected in any sample. * Remaining tissue was not sufficient for analysis. (TIF 197 kb)
Additional file 6:Table S2.ER, PR and HER2 staining of DMBA-induced mammary tumors formed in wild-type and genetically modified rats. Staining for ER, PR and HER2 were achieved using Dako EnVision FLEX mini Kit on a Dako Autostainer Omnis (Agilent, Santa Clara, CA) and high-resolution digital images were captured at × 20 using a Pannoramic 250 Flash III slide scanner (3DHISTECH Ltd., Budapest, HUNGARY). (TIF 122 kb)
Additional file 7:Table S3.Transcripts differentially expressed in p66SHC-KO tumors compared to tumors from wild-type control animals. BaseMeans value WT and p66SHC-KO tumor samples (N= 4,n= 5, re-spectively). Listed is log2 fold change between WT and p66SHC-KO tumor and adjustedPvalue. (TIF 345 kb)
Acknowledgements
The authors thank Mary Rau, Tissue Bank Manager at the MCW, for assistance with human breast cancer tissues and Donna McAllister (MCW) for initial help with the DMBA model.
Ethics approval and consent to participate
The animal studies were completed in line with our animal protocol with approval by the Institutional Animal Care and Use Committee of the Medical College of Wisconsin.
Consent for publication Not applicable.
Availability of data and materials
All data generated or analyzed during this study are included in this published article and its supplementary information files.
Competing interests
The authors declare that they have no competing interests.
Funding
KDW, BM, SE, and AS are supported by NIH grants R01 DK098159 (to AS) and grants from the Wisconsin Breast Cancer Showhouse, Inc. and the Medical College of Wisconsin Cancer Center (to AS and AB, respectively) and MCW Cancer Center Pilot Grant (to AS). Supported in part by Institutional Research Grant #14-247-29 from the American Cancer Society and the MCW Cancer Center (to Y. Sun). MJF and SWT are supported by a seed grant from the Wisconsin Breast Cancer Showhouse and the MCW Cancer Center, the Advancing a Healthier Wisconsin Endowment, the Mary Kay Foundation (Grant No. 024.16), the METAvivor Foundation, and the NCI (R01CA193343).
Authors’contributions
KDW and AS conceptualized the study and provided the overall design of the experiments and writing of the manuscript, with KDW contributing most of the experiments. KDW and SEM analyzed tumor latency and burden. BSM carried out the analysis of expression of SHC1 isoforms in human breast cancer tissues from MCW Tissue Bank and contributed to other research aspects of this project. SWT and MJF performed the RNAseq analysis. AB provided assistance with statistical analysis. YS and KDW performed morphology analysis of rat mammary glands. BK contributed to establishing the DMBA model. HR and YS carried out the analysis of hormone receptor expression status of DMBA-induced tumors. AMG generated the p52SHC-KO rat strain. KDW, HR, MJF, and AS analyzed the data. AS supervised the study. All authors read and approved the final manuscript.
Author details
1Cardiovascular Center, Medical College of Wisconsin, 8701 Watertown Plank
Road, Milwaukee, WI 53226, USA.2Department of Medicine, Medical College of Wisconsin, 8701 Watertown Plank Road, Milwaukee, WI 53226, USA. 3Department of Physiology, Medical College of Wisconsin, 8701 Watertown
Plank Road, Milwaukee, WI 53226, USA.4Institute for Health and Equity, Medical College of Wisconsin, 8701 Watertown Plank Road, Milwaukee, WI 53226, USA.5Department of Pathology, Medical College of Wisconsin, 8701 Watertown Plank Road, Milwaukee, WI 53226, USA.6Department of Biophysics, Medical College of Wisconsin, 8701 Watertown Plank Road, Milwaukee, WI 53226, USA.7Free Radical Research Center, Medical College of Wisconsin, Milwaukee, WI 53226, USA.
Received: 6 April 2018 Accepted: 23 May 2019
References
1. Nagini S. Breast cancer: current molecular therapeutic targets and new players. Anti Cancer Agents Med Chem. 2017;17(2):152–63.
2. Soysal SD, Tzankov A, Muenst SE. Role of the tumor microenvironment in breast cancer. Pathobiology. 2015;82(3–4):142–52.
3. Das R, Vonderhaar BK. Involvement of SHC, GRB2, SOS and RAS in prolactin signal transduction in mammary epithelial cells. Oncogene. 1996;13(6):1139–45.
4. Fox EM, Andrade J, Shupnik MA. Novel actions of estrogen to promote proliferation: integration of cytoplasmic and nuclear pathways. Steroids. 2009;74(7):622–7.
5. Hudson J, Ha JR, Sabourin V, Ahn R, La SR, Livingstone J, Podmore L, Knight J, Forrest L, Beauchemin N, et al. p66ShcA promotes breast cancer plasticity by inducing an epithelial-to-mesenchymal transition. Mol Cell Biol. 2014; 34(19):3689–701.
6. Haines E, Saucier C, Claing A. The adaptor proteins p66Shc and Grb2 regulate the activation of the GTPases ARF1 and ARF6 in invasive breast cancer cells. J Biol Chem. 2014;289(9):5687–703.
7. Jackson JG, Yoneda T, Clark GM, Yee D. Elevated levels of p66 Shc are found in breast cancer cell lines and primary tumors with high metastatic potential. Clin Cancer Res. 2000;6(3):1135–9.
8. Pelicci G, Lanfrancone L, Grignani F, McGlade J, Cavallo F, Forni G, Nicoletti I, Grignani F, Pawson T, Pelicci PG. A novel transforming protein (SHC) with an SH2 domain is implicated in mitogenic signal transduction. Cell. 1992; 70(1):93–104.
9. Ventura A, Luzi L, Pacini S, Baldari CT, Pelicci PG. The p66Shc longevity gene is silenced through epigenetic modifications of an alternative promoter. J Biol Chem. 2002;277(25):22370–6.
10. Migliaccio E, Mele S, Salcini AE, Pelicci G, Lai KM, Superti-Furga G, Pawson T, Di Fiore PP, Lanfrancone L, Pelicci PG. Opposite effects of the p52shc/ p46shc and p66shc splicing isoforms on the EGF receptor-MAP kinase-fos signalling pathway. EMBO J. 1997;16(4):706–16.
11. Okada S, Kao AW, Ceresa BP, Blaikie P, Margolis B, Pessin JE. The 66-kDa Shc isoform is a negative regulator of the epidermal growth factor-stimulated mitogen-activated protein kinase pathway. J Biol Chem. 1997;272(44): 28042–9.
12. Wright KD, Staruschenko A, Sorokin A. Role of adaptor protein p66Shc in renal pathologies. Am J Physiol Renal Physiol. 2018;314(2):F143–53. 13. Tomilov A, Tomilova N, Shan Y, Hagopian K, Bettaieb A, Kim K, Pelicci PG,
Haj F, Ramsey J, Cortopassi G. p46Shc inhibits thiolase and lipid oxidation in mitochondria. J Biol Chem. 2016;291(24):12575–85.
14. Campbell KS, Ogris E, Burke B, Su W, Auger KR, Druker BJ, Schaffhausen BS, Roberts TM, Pallas DC. Polyoma middle tumor antigen interacts with SHC protein via the NPTY (Asn-Pro-Thr-Tyr) motif in middle tumor antigen. Proc Natl Acad Sci U S A. 1994;91(14):6344–8.
15. Ursini-Siegel J, Muller WJ. The ShcA adaptor protein is a critical regulator of breast cancer progression. Cell Cycle. 2008;7(13):1936–43.
16. Rauh MJ, Blackmore V, Andrechek ER, Tortorice CG, Daly R, Lai VK, Pawson T, Cardiff RD, Siegel PM, Muller WJ. Accelerated mammary tumor
development in mutant polyomavirus middle T transgenic mice expressing elevated levels of either the Shc or Grb2 adapter protein. Mol Cell Biol. 1999;19(12):8169–79.
Stat3 activity to promote breast cancer immune suppression. Nat Commun. 2017;8:14638.
18. Ursini-Siegel J, Cory S, Zuo D, Hardy WR, Rexhepaj E, Lam S, Schade B, Jirstrom K, Bjur E, Piccirillo CA, et al. Receptor tyrosine kinase signaling favors a protumorigenic state in breast cancer cells by inhibiting the adaptive immune response. Cancer Res. 2010;70(20):7776–87.
19. Miller B, Palygin O, Rufanova VA, Chong A, Lazar J, Jacob HJ, Mattson D, Roman RJ, Williams JM, Cowley AW Jr, et al. p66Shc regulates renal vascular tone in hypertension-induced nephropathy. J Clin Invest. 2016; 126(7):2533–46.
20. Adamovic T, McAllister D, Wang T, Adamovic D, Rowe JJ, Moreno C, Lazar J, Jacob HJ, Sugg SL. Identification of novel carcinogen-mediated mammary tumor susceptibility loci in the rat using the chromosome substitution technique. Genes Chromosomes Cancer. 2010;49(11):1035–45. 21. Flister MJ, Endres BT, Rudemiller N, Sarkis AB, Santarriaga S, Roy I,
Lemke A, Geurts AM, Moreno C, Ran S, et al. CXM: a new tool for mapping breast cancer risk in the tumor microenvironment. Cancer Res. 2014;74(22):6419–29.
22. Escrich E. Validity of the DMBA-induced mammary cancer model for the study of human breast cancer. Int J Biol Markers. 1987;2(3):197–206. 23. Russo J, Russo IH. Experimentally induced mammary tumors in rats. Breast
Cancer Res Treat. 1996;39(1):7–20.
24. Thompson HJ, Singh M. Rat models of premalignant breast disease. J Mammary Gland Biol Neoplasia. 2000;5(4):409–20.
25. Alvarado A, Lopes AC, Faustino-Rocha AI, Cabrita AMS, Ferreira R, Oliveira PA, Colaco B. Prognostic factors in MNU and DMBA-induced mammary tumors in female rats. Pathol Res Pract. 2017;213(5):441–6.
26. Langmead B, Salzberg SL. Fast gapped-read alignment with Bowtie 2. Nat Methods. 2012;9(4):357–9.
27. Love MI, Huber W, Anders S. Moderated estimation of fold change and dispersion for RNA-seq data with DESeq2. Genome Biol. 2014;15(12):550. 28. Le Mercier I, Poujol D, Sanlaville A, Sisirak V, Gobert M, Durand I, Dubois B,
Treilleux I, Marvel J, Vlach J, et al. Tumor promotion by intratumoral plasmacytoid dendritic cells is reversed by TLR7 ligand treatment. Cancer Res. 2013;73(15):4629–40.
29. Uhlen M, Fagerberg L, Hallstrom BM, Lindskog C, Oksvold P, Mardinoglu A, Sivertsson A, Kampf C, Sjostedt E, Asplund A, et al. Proteomics. Tissue-based map of the human proteome. Science. 2015;347(6220):1260419.
30. TissueScan Cancer and Normal Tissue cDNA Arrays [http://www.origene. com/qPCR/Tissue-qPCR-Arrays.aspx]. Accessed 1 Mar 2018.
31. INSTA-blot breast tissue OncoPair NBP2–29911 [https://www.novusbio.com/ PDFs2/NBP2-29911.pdf]. Accessed 1 Mar 2018.
32. Guan Y, Shao Y, Li D, Liu M. Generation of site-specific mutations in the rat genome via CRISPR/Cas9. Methods Enzymol. 2014;546:297–317.
33. Ahn R, Sabourin V, Ha JR, Cory S, Maric G, Im YK, Hardy WR, Zhao H, Park M, Hallett M, et al. The ShcA PTB domain functions as a biological sensor of phosphotyrosine signaling during breast cancer progression. Cancer Res. 2013;73(14):4521–32.
34. Biscardi JS, Belsches AP, Parsons SJ. Characterization of human epidermal growth factor receptor and c-Src interactions in human breast tumor cells. Mol Carcinog. 1998;21(4):261–72.
35. Guvakova MA, Surmacz E. Tamoxifen interferes with the insulin-like growth factor I receptor (IGF-IR) signaling pathway in breast cancer cells. Cancer Res. 1997;57(13):2606–10.
36. Song RX, McPherson RA, Adam L, Bao Y, Shupnik M, Kumar R, Santen RJ. Linkage of rapid estrogen action to MAPK activation by ERalpha-Shc association and Shc pathway activation. Mol Endocrinol. 2002;16(1):116–27. 37. Webster MA, Hutchinson JN, Rauh MJ, Muthuswamy SK, Anton M,
Tortorice CG, Cardiff RD, Graham FL, Hassell JA, Muller WJ. Requirement for both Shc and phosphatidylinositol 3′kinase signaling pathways in polyomavirus middle T-mediated mammary tumorigenesis. Mol Cell Biol. 1998;18(4):2344–59.
38. Samuelson E, Nilsson J, Walentinsson A, Szpirer C, Behboudi A. Absence of Ras mutations in rat DMBA-induced mammary tumors. Mol Carcinog. 2009; 48(2):150–5.
39. Soltysik K, Czekaj P. Membrane estrogen receptors - is it an alternative way of estrogen action? J Physiol Pharmacol. 2013;64(2):129–42.
40. Santen R, Jeng MH, Wang JP, Song R, Masamura S, McPherson R, Santner S, Yue W, Shim WS. Adaptive hypersensitivity to estradiol: potential mechanism for secondary hormonal responses in breast cancer patients. J Steroid Biochem Mol Biol. 2001;79(1–5):115–25.
41. Song RX, Barnes CJ, Zhang Z, Bao Y, Kumar R, Santen RJ. The role of Shc and insulin-like growth factor 1 receptor in mediating the translocation of estrogen receptor alpha to the plasma membrane. Proc Natl Acad Sci U S A. 2004;101(7):2076–81.
42. Zhang Z, Kumar R, Santen RJ, Song RX. The role of adapter protein Shc in estrogen non-genomic action. Steroids. 2004;69(8–9):523–9.
43. Oh WJ, Jacinto E. mTOR complex 2 signaling and functions. Cell Cycle. 2011; 10(14):2305–16.
44. Lamming DW, Demirkan G, Boylan JM, Mihaylova MM, Peng T, Ferreira J, Neretti N, Salomon A, Sabatini DM, Gruppuso PA. Hepatic signaling by the mechanistic target of rapamycin complex 2 (mTORC2). FASEB J. 2014;28(1): 300–15.
45. Agarwal NK, Chen CH, Cho H, Boulbes DR, Spooner E, Sarbassov DD. Rictor regulates cell migration by suppressing RhoGDI2. Oncogene. 2013;32(20): 2521–6.
46. Boulbes D, Chen CH, Shaikenov T, Agarwal NK, Peterson TR, Addona TA, Keshishian H, Carr SA, Magnuson MA, Sabatini DM, et al. Rictor phosphorylation on the Thr-1135 site does not require mammalian target of rapamycin complex 2. Mol Cancer Res. 2010;8(6):896–906.
47. Hagan GN, Lin Y, Magnuson MA, Avruch J, Czech MP. A Rictor-Myo1c complex participates in dynamic cortical actin events in 3T3-L1 adipocytes. Mol Cell Biol. 2008;28(13):4215–26.
48. Lu M, Wang J, Jones KT, Ives HE, Feldman ME, Yao LJ, Shokat KM, Ashrafi K, Pearce D. mTOR complex-2 activates ENaC by phosphorylating SGK1. J Am Soc Nephrol. 2010;21(5):811–8.
49. Gopal YN, Rizos H, Chen G, Deng W, Frederick DT, Cooper ZA, Scolyer RA, Pupo G, Komurov K, Sehgal V, et al. Inhibition of mTORC1/2 overcomes resistance to MAPK pathway inhibitors mediated by PGC1alpha and oxidative phosphorylation in melanoma. Cancer Res. 2014;74(23):7037–47. 50. Kalim KW, Zhang S, Chen X, Li Y, Yang JQ, Zheng Y, Guo F. mTOR has a
developmental stage-specific role in mitochondrial fitness independent of conventional mTORC1 and mTORC2 and the kinase activity. PLoS One. 2017;12(8):e0183266.https://doi.org/10.1371/journal.pone.0183266. 51. Giguere V. Canonical signaling and nuclear activity of mTOR-a teamwork
effort to regulate metabolism and cell growth. FEBS J. 2018.
Publisher’s Note