SHORT REPORT
Isolation and characterization of 24
polymorphic microsatellite loci for the
study of genetic population structure of the
sheepshead
Archosargus probatocephalus
(Actinopterygii, Perciformes, Sparidae)
Seifu Seyoum
1*, Cecilia Puchutulegui
1and Richard S. McBride
2Abstract
Background: The sheepshead (Archosargus probatocephalus) is found in nearshore waters from Nova Scotia, Canada, to Rio Grande do Sul, Brazil. In the southeastern United States two subspecies are recognized based on a number of meristic characters, primarily counts of melanistic pigment bars. The only previous study based on mtDNA control-region sequence found limited divergence between those subspecies and isolation by distance among 15 locations from Florida (Atlantic Ocean) to Texas (Gulf of Mexico). In the same study, using six sparid microsatellite markers, Bayesian analysis showed that the Gulf and Atlantic sheepshead form a single population. To reinvestigate the fine-scale genetic population structure and examine genetic support for the morphologically classified subspecies, a set of species-specific microsatellite markers was needed.
Findings: Here we report on 24 polymorphic microsatellite markers isolated from sheepshead and screened in 57 specimens from the Indian River, Florida. The average number of alleles per locus was 13.1; mean observed and expected heterozygosities were 0.68 and 0.73, respectively. Nine sparid markers screened for the same specimens showed an average of 8.6 alleles per locus; mean observed and expected heterozygosities were 0.46 and 0.55, respectively.
Conclusions: The polymorphic markers reported here can be used to search for genetic evidence for the mor-phologically defined subspecies, to elucidate the fine-scale genetic population structure of this broadly distributed coastal species, and to provide an opportunity to directly compare results of population delineation between non-specific and species-non-specific markers.
Keywords: Sheepshead, Archosargus probatocephalus, Microsatellites, Population structure, Subspecies, Non-specific markers
© 2016 Seyoum et al. This article is distributed under the terms of the Creative Commons Attribution 4.0 International License (http://creativecommons.org/licenses/by/4.0/), which permits unrestricted use, distribution, and reproduction in any medium, provided you give appropriate credit to the original author(s) and the source, provide a link to the Creative Commons license, and indicate if changes were made. The Creative Commons Public Domain Dedication waiver (http://creativecommons.org/ publicdomain/zero/1.0/) applies to the data made available in this article, unless otherwise stated.
Findings
The sheepshead (Archosargus probatocephalus) is an economically important, estuarine–marine teleost fish that is widely distributed from Nova Scotia, Canada, to Rio Grande do Sul, Brazil [1–3]. They migrate offshore
to spawn in late winter and return to estuaries in early spring [3]. Limited movement of sheepshead along the coast could lead to discrete populations among spawn-ing groups, but assumspawn-ing pelagic eggs disperse freely, this may facilitate gene flow and thwart the formation of pop-ulation structure [4].
Geographic variation in sheepshead bar counts and growth rates is evident [2, 5]. Variation in melanistic bar patterns initially led to the designation of two subspecies
Open Access
*Correspondence: [email protected]
1 Fish and Wildlife Research Institute, Florida Fish and Wildlife Conservation Commission, St. Petersburg, FL, USA
in North America [6], one in the western and northern Gulf of Mexico and another in the eastern Gulf of Mexico and along the Eastern Seaboard. A recent statistical re-evaluation of morphometric data confirmed that these putative subspecies exhibited significantly different num-bers not only of melanistic bars but also of several other meristic characters (i.e., scales, gill rakers, and fin rays [2, 7]). This new analyses also indicated the presence of a hybrid zone in the northeastern Gulf [7].
The only study of the genetic population structure of the sheepshead based on six microsatellite loci developed for other sparid showed that the Gulf and Atlantic popu-lations belong to a single panmictic population [7]. In the same study based on mtDNA control region sequence, no specific genetic boundaries were evident that corre-sponded with the two morphologically defined subspe-cies mentioned above. In samples from northeast Florida to Texas, mtDNA and microsatellite differentiation was attributed to isolation by distance rather than independ-ent genetic stocks [7]. The mtDNA, however, as a sin-gle locus may not reflect enough genealogical histories among populations and because of this has a low-reso-lution power and often fails to reveal fine-scale popula-tion structure. Nonspecific markers may also fall in the category of low resolution molecular techniques, particu-larly if few are used. Species-specific microsatellite mark-ers, however, may represent genealogical record from the source organism with which to observe population structure in fishes that reside in open, coastal habitats. We postulate that in direct competition species-specific markers should be superior to nonspecific markers and can be helpful in re-examining genetic evidence for the validity of the subspecies and the genetic stock structure of the sheepshead.
Microsatellite loci were isolated following the PIMA (PCR-based isolation of microsatellite arrays) method of Lunt et al. [8], modified by Seyoum et al. [9]. Nuclear DNA (nDNA) was first purified from liver tissue from a single sheepshead via density-gradient ultracentrifu-gation [10] to minimize competition with mitochon-drial DNA during random amplified polymorphic DNA (RAPD) PCRs. RAPD PCRs were conducted in 50-µl reactions containing 15–25 ng of the purified DNA, 50 μM of dNTP mix, 0.25 μl of 0.1–mg/ml BSA; two or three primers randomly chosen from a set of 120, 10-mer RAPD primers (Qiagen Operon Inc.); 5 μl of Taq poly-merase buffer (10×), 2.5 mM MgCl2 (Promega, final con-centration); and 1.25 units of Go Taq DNA polymerase (Promega Corporation). The reaction profile was 94 °C for 2 min, 30 × (94 °C for 40 s, 35 °C for 40 s, 72 °C for 45 s), and final extension at 72 °C for 30 min. The purified PCR products (Agilent Technologies) were T-A cloned [11] into plasmid vectors Bluescript PBC KS-Agilent
Technologies) that had been tailed with homemade dTTP [12]. About 50 recombinant colonies from each of the PCR products were screened by performing PCR (12.5 μl total reaction volume) containing T3 and T7 vec-tor primers and four repeat-specific primers (5′-[AC]10 -3′, 5′-[AG]10-3′, 5′-[AGC]5-3′, 5′-[ACT]12-3′). Here, the reaction profile was 94 °C for 2 min, 35 × (94 °C for 30 s, 55 °C for 30 s, 72 °C for 30 s), and final extension 72 °C for 7 min. The PCR products of the clones were run through a 1.5 % low-EEO agarose gel. Colonies that showed two or more bands were further amplified using only the vector primers, the products gel-purified and then cycle-sequenced from both directions using BigDye (version 3.1; Applied Biosystems), and the sequencing products visualized on an Applied Biosystems Prism™ 3130-Avant Genetic Analyzer. Primers were designed for candidate loci using OligoPerfect (Thermo Fisher Scien-tific); annealing temperature was adjusted to 58–60 °C and fragment size to three categories, 95–115, 125–165, and 185–250, to facilitate multiplex PCR and minimize overlapping of fragment sizes during visualization. Mul-tiplex PCR amplifications for each specimen were carried out in an Eppendorf thermal cycler containing 50–100 ng of total DNA and three optimally selected primers, each forward primer labeled with a unique fluorescent dye. The multiplex PCR reaction consisted of a step-down profile and was as follows: 94 °C for 2 min, 5 × (94 °C for 45 s, 61 °C for 45 s, 72 °C for 45 s); 8 × (94 °C for 40 s, 59 °C for 40 s, 72 °C for 40 s); 10 × (94 °C for 35 s, 57 °C for 35 s, 72 °C for 35 s) 12 × (94 °C for 30 s, 55 °C for 30 s, 72 °C for 30 s) and a final extension at 72 °C for 15 min. The fragments were visualized on an ABI 3130 XL genetic analyzer and genotyped using GeneMapper (version 4.0, Applied Biosystems Inc.). For fragment assays, we used a Gene Scan-500 ROX-labeled size standard.
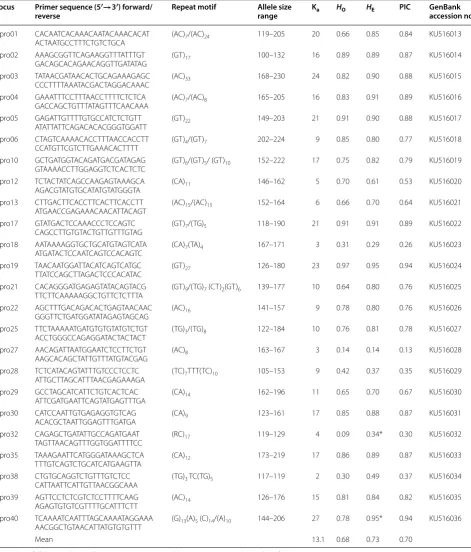
We extracted total DNA by using a PureGene DNA isolation kit (Gentra Systems Inc., Minneapolis, MN) according to the manufacturer’s instructions from 57 specimens of sheepshead collected from the Indian River, Florida, and used these samples to screen the markers for polymorphisms (Table 1) for a final genetic population structure and analysis of the morphologically defined subspecies.
Table 1 Characteristics of 24 polymorphic microsatellite loci in 57 specimens of sheepshead (Archosargus probatocepha-lus) from the Indian River, Florida
Ka number of alleles, HO observed heterozygosity, HE expected heterozygosity, PIC polymorphic information content
* Indicates significant departure from HWE
Locus Primer sequence (5′→3′) forward/
reverse Repeat motif Allele size range Ka HO HE PIC GenBank accession no.
Apro01 CACAATCACAAACAATACAAACACAT
ACTAATGCCTTTCTGTCTGCA (AC)7/(AC)24 119–205 20 0.66 0.85 0.84 KU516013 Apro02 AAAGCGGTTCAGAAGGTTTATTTGT
GACAGCACAGAACAGGTTGATATAG (GT)17 100–132 16 0.89 0.89 0.87 KU516014 Apro03 TATAACGATAACACTGCAGAAAGAGC
CCCTTTTAAATACGACTAGGACAAAC (AC)33 168–230 24 0.82 0.90 0.88 KU516015 Apro04 GAAATTTCCTTTAACCTTTTCTCTCA
GACCAGCTGTTTATAGTTTCAACAAA (AC)7/(AC)8 165–205 16 0.83 0.91 0.89 KU516016 Apro05 GAGATTGTTTTGTGCCATCTCTGTT
ATATTATTCAGACACACGGGTGGATT (GT)22 149–203 21 0.91 0.90 0.88 KU516017 Apro06 CTAGTCAAAACACCTTTAACCACCTT
CCATGTTCGTCTTGAAACACTTTT (GT)4/(GT)7 202–224 9 0.85 0.80 0.77 KU516018 Apro10 GCTGATGGTACAGATGACGATAGAG
GTAAAACCTTGGAGGTCTCACTCTC (GT)6/(GT)5/ (GT)10 152–222 17 0.75 0.82 0.79 KU516019 Apro12 TCTACTATCAGCCAAGAGTAAAGCA
AGACGTATGTGCATATGTATGGGTA (CA)11 146–162 5 0.70 0.61 0.53 KU516020 Apro13 CTTGACTTCACCTTCACTTCACCTT
ATGAACCGAGAAACAACATTACAGT (AC)15/(AC)15 152–164 6 0.66 0.70 0.64 KU516021 Apro17 GTATGACTCCAAACCCTCCAGTC
CAGCCTTGTGTACTGTTGTTTGTAG (GT)7/(TG)5 118–190 21 0.91 0.91 0.89 KU516022 Apro18 AATAAAAGGTGCTGCATGTAGTCATA
ATGATACTCCAATCAGTCCACAGTC (CA)7(TA)4 167–171 3 0.31 0.29 0.26 KU516023 Apro19 TAACAATGGATTACATCAGTCATGC
TTATCCAGCTTAGACTCCCACATAC (GT)27 126–180 23 0.97 0.95 0.94 KU516024 Apro21 CACAGGGATGAGAGTATACAGTACG
TTCTTCAAAAAGGCTGTTCTCTTTA (GT)9/(TG)7 (CT)2(GT)6 139–177 10 0.64 0.80 0.76 KU516025 Apro22 AGCTTTGACAGACACTGAGTAACAAC
GGGTTCTGATGGATATAGAGTAGCAG (AC)16 141–157 9 0.78 0.80 0.76 KU516026 Apro25 TTCTAAAAATGATGTGTGTATGTCTGT
ACCTGGGCCAGAGGATACTACTACT (TG)3/(TG)8 122–184 10 0.76 0.81 0.78 KU516027 Apro27 AACAGATTAATGGAATCTCCTTCTGT
AAGCACAGCTATTGTTTATGTACGAG (AC)8 163–167 3 0.14 0.14 0.13 KU516028 Apro28 TCTCATACAGTATTTGTCCCTCCTC
ATTGCTTAGCATTTAACGAGAAAGA (TC)7TTT(TC)10 105–153 9 0.42 0.37 0.35 KU516029 Apro29 GCCTAGCATCATTCTGTCACTCAC
ATTCGATGAATTCAGTATGAGTTTGA (CA)14 162–196 11 0.65 0.70 0.67 KU516030 Apro30 CATCCAATTGTGAGAGGTGTCAG
ACACGCTAATTGGAGTTTGATGA (CA)9 123–161 17 0.85 0.88 0.87 KU516031 Apro32 CAGAGCTGATATTGCCAGATGAAT
TAGTTAACAGTTTGGTGGATTTTCC (RC)17 119–129 4 0.09 0.34* 0.30 KU516032 Apro35 TAAAGAATTCATGGGATAAAGCTCA
TTTGTCAGTCTGCATCATGAAGTTA (CA)12 173–219 17 0.86 0.89 0.87 KU516033 Apro38 CTGTGCAGGTCTGTTTGTCTCC
CATTAATTCATTGTTAACGGCAAA (TG)3 TC(TG)5 117–119 2 0.30 0.49 0.37 KU516034 Apro39 AGTTCCTCTCGTCTCCTTTTCAAG
AGAGTGTGTCGTTTTGCATTTCTT (AC)14 126–176 15 0.81 0.84 0.82 KU516035 Apro40 TCAAAATCAATTTAGCAAAATAGGAAA
AACGGCTGTAACATTATGTGTGTTT (G)13(A)5 (C)14/(A)10 144–206 27 0.78 0.95* 0.94 KU516036
[image:3.595.62.534.113.666.2]There were significant departures from HWE after Bonferroni correction at two loci and no linkage disequi-librium at any pair of loci. Analyses using the program CERVUS suggested that the observed nonconform-ance to HWE may have resulted from the presence of null alleles at those loci. The average number of alleles per locus was 13.1 (range 2–27); the mean observed and expected heterozygosities were, respectively, 0.68 (range 0.09–0.97) and 0.73 (range 0.29–0.95). The relative infor-mativeness of each marker ranged from 0.24 to 0.93 (mean 0.70), with 11 of the 24 loci between 0.82 and 0.94.
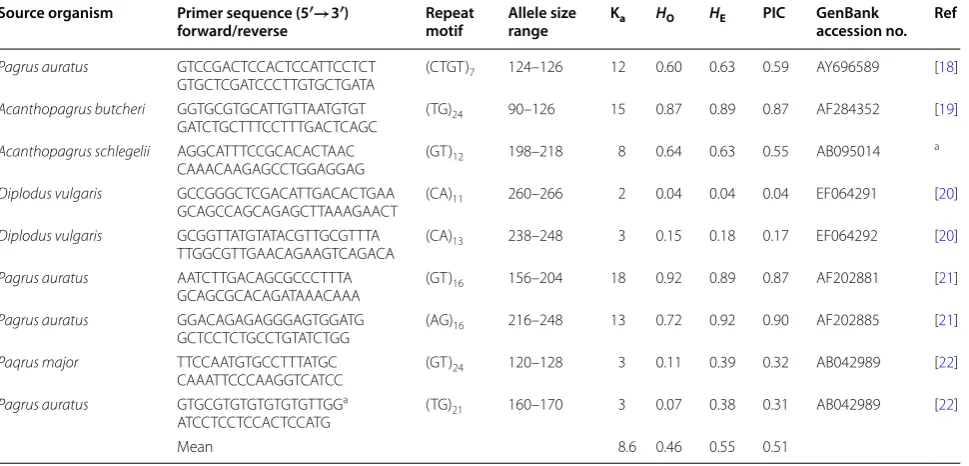
To build the basis for a preliminary comparative analy-sis between nonspecific and species-specific markers, 9 sparid markers were characterized for the 57 specimens (Table 2; 4 specimens had incomplete genotypes and were excised). The result showed that the sparid markers provided 8.6 alleles per locus, but much lower means of observed and expected heterozygosities, 0.46 and 0.55, respectively. Overall, the species-specific markers show greater variability and would be of a higher resolution power than the 9 sparid microsatellite DNA loci.
Costs of developing species-specific markers remain a concern. Compared with the enrichment protocol of developing microsatellite markers, the PIMA method requires less expertise, less time, and, so, less expense. The method’s drawback is that it results mostly in dinucleotides, which are more plentiful because their
mutation rate is at least six times that of other short tan-dem repeats (STR). Although tri- and tetranucleotides may not be more variable than dinucleotide, they’re definitely easier to score and lead to a lower genotyping error. The various kinds of tri- tetra- penta- and hexanu-cleotides can be obtained with the PIMA method, but with specific designs and much more laborious search.
Nonspecific markers are used to circumvent the exper-tise and the expense required to develop specific mark-ers, but they may not have adequate resolution power to reveal fine-scale population structure. In a direct comparative study, the use of 11 highly polymorphic red drum (nonspecific) markers failed to delineate the eastern and western Gulf spotted seatrout (Cynoscion nebulosus) samples as belonging to different clusters compared to only three spotted seatrout markers that accomplished the task (Seyoum et al. in preparation). While nonspecific microsatellite loci are widely used [15, 16] and could reveal strong genetic breaks between populations, there has been no study to directly com-pare specific vs. nonspecific microsatellite loci on equal terms of allelic variability in revealing fine genetic breaks between populations. The inadequate (and possibly mis-leading) results of the previous work on the study of the genetic population structure of the sheepshead that used non-specific markers may be offset by these new, species-specific markers developed in this study. We believe that
Table 2 Characteristics of 9 adopted sparid microsatellite DNA loci in 53 specimens of sheepshead (Archosargus probato-cephalus) from the Indian River, Florida
Four specimens did not amplify for three or more loci and were excised
Ka number of alleles, HO observed heterozygosity, HE expected heterozygosity, PIC polymorphic information content, Ref references
a Direct submission-Jeong et al. (NCBI) 2007
Source organism Primer sequence (5′→3′)
forward/reverse Repeat motif Allele size range Ka HO HE PIC GenBank accession no. Ref
Pagrus auratus GTCCGACTCCACTCCATTCCTCT
GTGCTCGATCCCTTGTGCTGATA (CTGT)7 124–126 12 0.60 0.63 0.59 AY696589 [18]
Acanthopagrus butcheri GGTGCGTGCATTGTTAATGTGT
GATCTGCTTTCCTTTGACTCAGC (TG)24 90–126 15 0.87 0.89 0.87 AF284352 [19]
Acanthopagrus schlegelii AGGCATTTCCGCACACTAAC
CAAACAAGAGCCTGGAGGAG (GT)12 198–218 8 0.64 0.63 0.55 AB095014
a
Diplodus vulgaris GCCGGGCTCGACATTGACACTGAA
GCAGCCAGCAGAGCTTAAAGAACT (CA)11 260–266 2 0.04 0.04 0.04 EF064291 [20]
Diplodus vulgaris GCGGTTATGTATACGTTGCGTTTA
TTGGCGTTGAACAGAAGTCAGACA (CA)13 238–248 3 0.15 0.18 0.17 EF064292 [20]
Pagrus auratus AATCTTGACAGCGCCCTTTA
GCAGCGCACAGATAAACAAA (GT)16 156–204 18 0.92 0.89 0.87 AF202881 [21]
Pagrus auratus GGACAGAGAGGGAGTGGATG
GCTCCTCTGCCTGTATCTGG (AG)16 216–248 13 0.72 0.92 0.90 AF202885 [21]
Paqrus major TTCCAATGTGCCTTTATGC
CAAATTCCCAAGGTCATCC (GT)24 120–128 3 0.11 0.39 0.32 AB042989 [22]
Pagrus auratus GTGCGTGTGTGTGTGTTGGa
ATCCTCCTCCACTCCATG (TG)21 160–170 3 0.07 0.38 0.31 AB042989 [22]
[image:4.595.58.543.461.694.2]these suite of species-specific markers will shed light on the stock structure of the sheepshead and on the valid-ity of the morphologically classified subspecies. The stock structure of this fish ought to be determined now, espe-cially because as attention increases toward regulation of other Gulf species, the sheepshead is now the target of greater demand and pressure of in the Gulf of Mexico [17]. Updated knowledge of sheepshead stock structure will help direct relevant management actions to protect this species at the appropriate spatial scale across its range.
Authors’ contributions
SS and CP did the study and carried out the computational work for locus identification and the statistical analysis. All authors read and approved the final manuscript.
Author details
1 Fish and Wildlife Research Institute, Florida Fish and Wildlife Conservation Commission, St. Petersburg, FL, USA. 2 Northeast Fisheries Science Center, National Marine Fisheries Service, Woods Hole, MA, USA.
Acknowledgements
We are thankful to the Tequesta Field Laboratory of the Fish and Wildlife Research Institute for collecting fish. This work was supported by the US Department of the Interior, US Fish and Wildlife Service, under the Federal Aid in Sport Fish Restoration Program, Grant F–69. The statements, findings, and conclusions are those of the authors and do not necessarily reflect the views or policies of the Department of the Interior. Mention of trade names or commercial products does not constitute their endorsement by the US Government.
Sample collection and availability of raw data
Permission to sample the fish was given by the Fish and Wildlife Research Institute and actual collection was carried out by the Fisheries Independent Monitoring program of the Institute. Actual DNA sequences of the microsatel-lite markers were all deposited in GenBank and the raw data is available upon request from the contact author.
Competing interests
The authors declare that they have no competing interests.
Received: 29 January 2016 Accepted: 21 April 2016
References
1. Robins C, Richard C, Ray GC, Douglas J, Freud R. A field guide to Atlantic coast fishes of North America. Peterson field guide series no 32. Boston: Houghton Mifflin Co.; 1986.
2. Caldwell DK. Systematics and variation in the sparid fish Archosargus probatocephalus. Bull South Calif Acad Sci. 1965;64:89–100.
3. Tremain DM, Harnden CW, Adams DH. Multidirectional movements of sportfish species between an estuarine no-take zone and surrounding waters of the Indian River Lagoon, Florida. Fish Bull. 2004;102:533–44. 4. McBride R. Managing a marine stock portfolio: stock identification,
structure, and management of 25 fishery species along the Atlantic coast of the United States. N Am J Fish Manag. 2014;34:710–34.
5. Dutka-Gianelli J, Murie DJ. Age and growth of sheepshead, Archosargus probatocephalus (Pisces: Sparidae), from the northwest coast of Florida. Bull Mar Sci. 2001;68:69–83.
6. Ginsburg I. Eight new fishes from the Gulf Coast of the United States, with two new genera and notes on geographic distribution. J Wash Acad Sci. 1952;42:84–101.
7. Anderson JD, Karel JW, Anderson KA, Roper-Foo PA. Genetic assess-ment of sheepshead stock structure in the northern Gulf of Mexico: morphological divergence in the face of gene flow. N Am J Fish Manag. 2008;28:592–606.
8. Lunt D, Hutchinson W, Carvalho G. An efficient method of PCR-based isolation of microsatellite arrays (PIMA). Mol Ecol. 1999;8:891–4. 9. Seyoum S, Tringali MD, Sullivan JG. Isolation and characterization of 27
polymorphic microsatellite loci for the common snook, Centropomus undecimalis. Mol Ecol Notes. 2005;5:192–4.
10. Lansman RA, Shade RO, Shapira JF, Avise JC. The use of restriction endonucleases to measure mitochondrial DNA sequence relatedness in natural populations. III. Techniques and potential applications. J Mol Evol. 1981;17:214–26.
11. Zhou MY, Gomez-Sanchez CE. Universal TA cloning. Curr Issu Mol Biol. 2000;2:1–7.
12. Marchuk D, Drumm M, Saulino A, Collins FS. Construction of T–vectors, a rapid and general system for direct cloning of unmodified PCR products. Nucl Acid Res. 1990;19(5):1154.
13. Rousset F. Genepop’007: a complete reimplementation of the GenePop software for Windows and Linux. Mol Ecol Res. 2008;8:103–6.
14. Kalinowski ST, Taper ML, Marshall TC. Revising how the computer program CERVUS accommodates genotyping error increases success in paternity assignment. Mol Ecol. 2007;16:109–1106. doi:10.1111/j.1365-294X.2007.03089.x.
15. Barbará T, Palma-Silva C, Paggi GM, Bered F, Fay MF, Lexer C. Cross-species transfer of nuclear microsatellite markers: potential and limitations. Mol Ecol. 2007;16:3759–67.
16. Maduna SN, Rossouw C, Roodt-Wilding R, Bester-van der Merwe AE. Microsatellite cross-species amplification and utility in southern African elasmobranchs: a valuable resource for fisheries management and con-servation. BMC Res Notes. 2014;7:1–12.
17. VanderKooy SJ, editor. The sheepshead fishery of the Gulf of Mexico, United States: a fisheries profile, United State. Ocean Springs: Gulf States Marine Fisheries Commission, Publication Number 143; 2006.
18. Chen SL, Liu YG, Xu MY, Li J. Isolation and characterization of polymorphic microsatellite loci from an EST-library of red sea bream (Chrysophrys major) and cross-species amplification. Mol Ecol Notes. 2005;5:215–7. 19. Yap ES, Spencer PB, Chaplin JA, Potter IC. The estuarine teleost,
Acan-thopagrus butcheri (Sparidae), shows low levels of polymorphism at five microsatellite loci. Mol Ecol. 2000;9:2225–6.
20. Roques S, Galarza JA, Macpherson E, Turner GF, Rico C. Isolation and characterization of nine polymorphic microsatellite markers in the two-banded sea bream (Diplodus vulgaris) and cross-species amplification in the white sea bream (Diplodus sargus) and the saddled bream (Oblada melanura). Mol Ecol Notes. 2007;7:661–3.
21. Adcock GJ, Ramirez JHB, Hauser L, Smith P, Carvalho GR. Screening of DNA polymorphisms in samples of archived scales from New Zealand snapper. Fish Biol. 2000;56:1283–7.