Long-Range Vibrational Dynamics are Directed by
Watson-Crick Base-Pairing in Duplex DNA
Gordon Hithell,
†Daniel J. Shaw,
†Paul M. Donaldson,
‡Gregory M. Greetham,
‡Michael Towrie,
‡Glenn A. Burley,
ξAnthony W. Parker,
‡Neil T. Hunt*
††Department of Physics, University of Strathclyde, SUPA, 107 Rottenrow East, Glasgow, G4 0NG, UK
‡STFC Central Laser Facility, Research Complex at Harwell, Harwell Science and Innovation Campus, Didcot, OX11 0QX, UK
ξ Department of Pure and Applied Chemistry, University of Strathclyde, 295 Cathedral Street, Glasgow, G1 1XL, UK
Supporting Information Placeholder
ABSTRACT: Ultrafast two-dimensional infrared (2D-IR) spectroscopy of a 15-mer A-T DNA duplex in solution has revealed structure-dependent vibrational coupling and ener-gy transfer processes linking bases with the sugar-phosphate backbone. Duplex melting induces significant changes in the positions of off-diagonal peaks linking carbonyl and ring-stretching vibrational modes of the adenine and thymine bases with vibrations of the phosphate group and phos-phodiester linkage. These indicate that Watson-Crick hydro-gen bonding and helix formation leads to a unique vibration-al coupling arrangement of base vibrationvibration-al modes with those of the phosphate unit. Based on observations from time-resolved 2D-IR data, we conclude that rapid energy transfer processes occur between base and backbone, medi-ated by additional modes locmedi-ated on the deoxyribose moiety within the same nucleotide. These relaxation dynamics are insensitive to duplex melting, showing that efficient intramo-lecular energy relaxation to the solvent via the phosphate groups is the key to excess energy dissipation in both single and double-stranded DNA.
Introduction
Deoxyribonucleic acid (DNA) is the most fundamental of biological molecules. Despite considerable efforts since the structure of the double helix was first determined in 1953 however,1 questions regarding the relationship between the solution phase molecular physics of DNA and its biological function remain unanswered. For example, the manner in which disparate aspects of the DNA structure (base pairing and stacking; deoxyribose rings; phosphodiester groups) combine cooperatively to stabilize double helical DNA or contribute to duplex unwinding in transcription and replica-tion are not clear. These inter and intramolecular interac-tions also influence the dynamic landscape of DNA and vari-ations in molecular dynamics with base sequence are be-lieved to underpin fundamental biological processes such as protein-DNA interactions and the recognition of damaged DNA bases. This is manifest in the action of anti-sense ther-apeutics where the subtle interplay of backbone and base influence efficacy through control of solvation and binding strength respectively. 2
The dynamics of vibrational relaxation, relating to mode-mode energy migration and efficient energy dissipation are linked to the naturally short non-radiative lifetimes of DNA excited states and may contribute to the prevention of exten-sive DNA-damage following electronic-excitation and relaxa-tion.3-5 Ultrafast spectroscopy has provided considerable in-sights into the dynamics of electronically-excited DNA,6-11 including investigations using time-resolved IR spectroscopy on adenine and thymine systems,5,12 but the precise relaxa-tion pathways remain to be clearly elucidated.
There exists a clear need to observe, experimentally, the dynamics as well as the structure of DNA in a whole mole-cule manner, but this brings considerable challenges be-cause, although powerful, time resolved optical spectroscopic methods are often limited by available technology to probing specific, relatively localized aspects of the molecule.
Studies of ground state dynamics have revealed the im-portance of delocalized phenomena centered on the DNA bases: 2D-IR spectroscopy of carbonyl stretching modes of double-stranded (ds)-GC sequences established that inter-strand vibrational couplings due to W-C H-bonding out-weigh those occurring along the strand due to base-stacking interactions. 13,14 Subsequent computational modeling studies identified significant changes in base vibrational modes upon base pairing leading to the formation of new vibrational ‘W-C modes’ spanning the paired bases.15-18 Vibrational coupling and related delocalization of modes has been further shown to be present in the vibrational modes of the isolated bases,19 while studies of the N-H stretching modes show that cou-pling affects these to a similar degree and vibrational relaxa-tion between the N-H stretching modes and lower-frequency base modes has been reported at low relative humidity.20-28
Recently, the dynamics of the phosphate backbone vibra-tional modes have been determined under carefully-controlled hydration conditions.29,30 These experiments show that the phosphate and phosphodiester modes are also cou-pled and indicate that the primary energy dissipation mech-anism of DNA is through solvent interactions of the phos-phate group.
be-tween the purine and pyrimidine modes and the sugar ring modes is not conclusive,31,32 yet is of vital importance when considering the mechanism by which the bases and back-bone are dynamically-linked in relation to, for example, an energy transfer pathway. Here, we exploit two-color 2D-IR experiments to specifically probe the interaction of vibra-tional modes located on the bases with those involving the sugar-phosphate backbone under both double- and single-stranded conditions. We reveal for the first time coupling and energy transfer dynamics that span these spatially-disparate groups via mutual interactions with the deoxyri-bose unit. The structure-specific nature of the results pro-vides an insight into the unique physical processes that arise from the double helix structure.
Figure 1: a) IR absorption spectra of AT 15-mer in the backbone
stretch-ing region of the spectrum at a range of temperatures from 20 ˚C (blue) to 80 ˚C (red). b) IR absorption spectra showing vibrational modes of the bases as a function of temperature. c-f) 2D-IR spectra (ZZYY) showing results of one color (d,f) and two color (c,e) experiments at 20 ˚C (c,d) and 80 ˚C (e,f). For vibrational mode definitions, see Fig 2. In all 2D-IR spectra presented, the color scheme runs from red (negative) to blue (positive); contours represent 10% increments in the signal; ‘base’ 2D-IR spectra (d,f) signals cover a range equivalent to ± 10 mOD; ‘base-backbone’ signals were an order of magnitude smaller.
Experimental
Fourier-transform ultrafast 2D-IR spectra were obtained using the pseudo pump-probe geometry method33,34 with the LIFEtime spectrometer.35,36 Mid-infrared laser pulses were produced by three optical parametric amplifiers (OPA) pumped by two 100 kHz Yb:KGW amplified laser systems, (6W, 180 fs, and 15W, 300 fs) pumping one pump OPA (OPA1) and two probe OPAs (OPA2 and OPA3 respectively). OPA1 provided the 2D-IR excitation pulses centered near 1650 cm-1, resonant with the base carbonyl/ring stretching modes. OPA2 provided probe pulses also centered on these base modes (1650 cm-1) for single color ‘base’ 2D-IR experi-ments while OPA3 was used in two-color ‘backbone’ 2D-IR experiments to probe the phosphate backbone region of the spectrum near 1070 cm-1. The probe pulse durations
pro-duced by the OPAs were ~ 200 fs. Two co-linear pump puls-es, separated by a variable time delay, τ, were created by di-recting the output of OPA1 into a mid-IR pulse shaper (Phasetech) and the waiting (pump-probe delay) time was set using an optical delay line situated after the pulse shaper. The pump-pulse duration was ~300 fs, which limits the ex-perimental time resolution. The two probe beams were dis-persed in separate spectrometers, each equipped with a 128 element MCT array detector. 2D-IR signals were measured using phase cycling and 2D-IR datasets were obtained by scanning τ for a fixed waiting time. Spectra were obtained by Fourier transform along τ. Data was collected in both ZZZZ and ZZYY polarization geometries.
[image:2.612.53.290.195.462.2]The sample consisted of a 15 base pair oligomer 5’ – ATTATTATTATATTA-3’ and its complementary sequence (BioTeZ Berlin Buch GmbH) dissolved, without further puri-fication, to a concentration of 10 mM in deuterated tris-buffer (100 mM, pD7.4) containing 100 mM NaCl. Under these conditions, the DNA forms a B-type double helix with a melting temperature of ~55 °C, as confirmed by UV-vis and FT-IR absorption spectroscopy (see ESI Figs.S1 and S2). For all IR measurements, the sample was held between two CaF2 windows separated by a 25 µm thickness poly-tetrafluoroethylene spacer and housed in a thermostatically-controlled mount, allowing the temperature to be varied between 20 °C and 80 °C, accurate to ± 1°C, where the DNA was predominantly in double- and single-stranded confor-mations respectively.
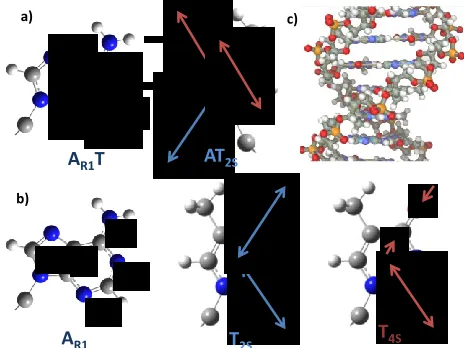
Figure 2: Schematic representation of the vibrational modes of a)
W-C base pairs and b) individual bases as used in the text. De-scriptions are based on simulations reported in Refs 15-18 c) shows a schematic representation of the ds-AT 15-mer studied in which the bases and sugar-phosphate backbone are visible.
Results
IR spectroscopy: The results of the 2D-IR experiments are shown in Fig.1 alongside temperature-dependent IR ab-sorption spectra. In the ‘base’ region of the IR spectrum near 1650 cm-1, four bands are visible at 20 °C (Fig.1(b) blue spec-trum), located at 1692, 1663, 1640 and 1622 cm-1. Following mode designations based on previous computational simula-tions, these are assigned to the AT2S, AT4S, TR and AR1T modes of the AT W-C base pair respectively (Fig.2(a)). 15-18 Heating to 80 °C (Fig 1(b) red spectrum) induced a change in the spectrum with three peaks being observed at 1693, 1661 and 1623
A
R1T
2ST
4SAT
2SAT
4SA
R1T
a)
b)
[image:2.612.324.556.357.531.2]Figure 3: (a-d) Slices taken through 2D-IR spectra of the backbone region at a range of waiting times. Figure legends show identity of
excited mode (pump frequency) and temperature in each case. Data has been smoothed using the 7 pt Savitzky-Golay method to remove a low-amplitude modulation on the probe spectrum due to etalon effects caused by the GaSe crystal used for Difference Frequency Genera-tion in OPA3.
T
(˚C)
Excited
Mode T1
(fs)
τr
(fs)
P2 L2
AT2S 550 700 -
20 AT4S 850 700 1550
ATR 900 750 700
AR1T 850 1900 600
T2S 700 350 -
80 T4S 850 - 600
TR - - 700
[image:3.612.142.488.63.298.2]AR1 800 - -
Table 1: Results of fitting peak dynamics from time-resolved 2D-IR spectroscopy, as described in main text. τr values for P2 peaks represent the average rise times observed for the negative and positive features marked with blue and black arrows in Fig 5 (see text).
cm-1; attributed to the T2S, T4S, and AR1 modes of the single-stranded bases respectively (Fig.2(b)). 15-18 A shoulder is also visible at 1632 cm-1 corresponding to the ring-based TR mode. In the ‘backbone’ region of the spectrum, near 1070 cm-1, (Fig.1(a)) three bands are observed at both low (blue) and high (red) temperatures; these are assigned to the symmetric PO2- stretching mode (P2) located at 1086 cm-1 and the L1 and L2 phosphodiester stretching modes at 1075 and 1055 cm-1 respectively.29 The P1 asymmetric PO2- stretching mode ex-pected near 1230 cm-1 is obscured by a D2O solvent transition. A low-intensity feature, located at 1105 cm-1 (inset Fig.1(a)), is assigned to a C1’-C2’-C3’O vibrational mode of the
deoxyri-bose unit. 31,37 Increasing the temperature resulted in a reduc-tion in the intensity of the P2 mode, while the L2 mode shift-ed slightly to higher wavenumber. Detailshift-ed analysis of the IR absorption spectra in both base and backbone regions as a function of temperature (ESI Fig.S2) shows that the changes in both spectral regions are well-represented by a sigmoid-type function with a midpoint near 58 ± 2 °C, consistent with the changes being attributable to helix melting. Fig S2 also shows that FT-IR spectra of the individual ss-DNA sequences used to form the duplex are consistent with that of the melt-ed duplex at 80 °C, confirming that the effect of temperature on the ss-DNA spectroscopy is minimal.
‘Base’ 2D-IR spectroscopy: A representative diagonal 2D-IR spectrum of the base modes, obtained at 20 °C and a waiting time of ~250 fs is shown in Fig.1(d). Negative peaks (red) appear on the spectrum diagonal, corresponding to the v=0-1 transition of each vibrational mode, with associated positive (blue) v=1-2 peaks, which are shifted to lower probe frequency by the diagonal anharmonicity of the modes. In light of subsequent discussions focusing on vibrational relax-ation, a ‘pump-probe’ description of these spectra has been employed, however it is noted that the signs of the v=0-1 and v=1-2 signals are often reversed in photon-echo experiments. Additional peaks are visible in the off-diagonal region of the spectrum. These are present from the shortest waiting times, showing that all four of the base-pair modes in this spectral region are coupled to one-one-another, consistent with previous computational predictions (Fig.2(a)).15-18
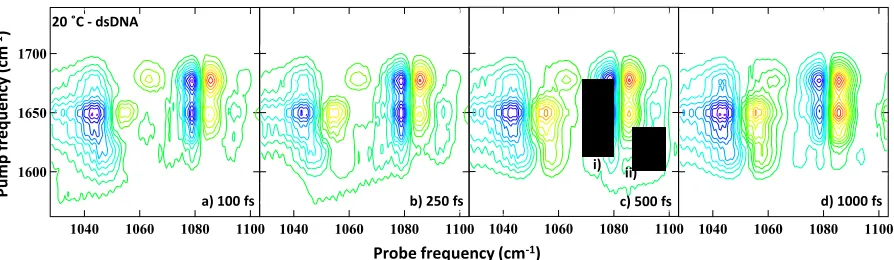
[image:3.612.86.256.362.528.2]Figure 4: Backbone 2D-IR spectra obtained at a range of waiting times for the ds-DNA sample at 20 ˚C and ZZYY polarization conditions. The waiting time is given in the individual figure legends. Labels in c) show i) the position of lineshape evolution of the P2 peak and ii) the v=1-2 transition
of the 1105 cm-1 deoxyribose mode as referred to in the text. ss- and ds-DNA configurations.15-18 However, careful
inspec-tion shows that the TR mode shifts to lower frequency on going from ds- to ss-DNA and that coupling between AR1 and the three T modes is lost upon breaking of the W-C base pairas would be anticipated. Indeed, the coupling patterns observed at 80 °C are very similar to those reported for the individual bases.19 This result indicates that the interstrand coupling that dominates base vibrational modes in duplex DNA is completely lost when the W-C interaction is broken and is not encouraged through simple solvent-mediated wa-ter-phosphate bonding. Thus, the 2D-IR data of these sam-ples further indicates that inter-strand coupling of the bases is more dominant than intra-strand coupling, in agreement with previous conclusions on dsGC sequences.14
2D-IR spectra of the bases were obtained as a function of waiting time and peaks were fit to Gaussian lineshape pro-files to extract relaxation dynamics (ESI Fig S3(a,b)). The dynamics of the diagonal peaks of both the ds- and ss-DNA configurations were typically well-represented by a single exponential decay function with a timescale of ~750 ± 200 fs (see T1, Table 1). The v=0-1 and v=1-2 transitions showed con-sistent temporal behavior and good agreement with broad-band pump-probe measurements (ESI Fig S4). Neglecting the effects of molecular rotation on these fast timescales, these values are taken to represent the vibrational lifetime (T1) of the excited modes. The lack of dependence of this parameter upon temperature suggests that the relaxation mechanism of the base modes is not strongly affected by strand confor-mation or solvent access.
‘Base-Backbone’ 2D-IR spectroscopy: In contrast to the base 2D-IR data, significant changes in the two-color ‘base-backbone’ 2D-IR spectra are observed upon changing the temperature.
Double-stranded DNA: At 20 °C, corresponding to the ds-DNA configuration (Fig 1(c)), off-diagonal peaks were observed to link all four of the excited base W-C vibrational modes to both the P2 mode of the PO2- unit and the L2 mode of the phosphodiester. Experiments using the perpendicular ZZYY polarization geometry showed changes in amplitude but not in the positions of the peaks observed in the 2D-IR spectra. Fitting cross-sections through the data, such as those shown in Fig.3(a,b), to Gaussian line-shape functions showed that the data was best-represented by a fit that also included peaks linking the base modes with the L1 mode as well as the P2 and L2 modes (ESI Fig S5). With the exception
of excitation of the AT2S mode under ZZYY polarization con-ditions (Fig.4), where the L1 peak was more prominent, the L1 peaks were largely obscured by the strong P2 and L2 peaks.
The temporal dynamics of the peaks in the backbone 2D-IR spectra were measured and examples are shown in Fig.4. All peaks were found to be present, albeit of low intensity, at the earliest waiting times (Fig.4(a)). The peaks linking base modes to the L2 mode for the ds-DNA sample displayed a rise in amplitude. The dynamics recovered for this process were mode-dependent (see τr, Table 1) a timescale of 650 ± 100 fs recovered for excitation of ATR and AR1T; the AT4S-L2 peak displayed a slower rise time.
In all cases, the rise was followed by a decay that did not show an easily-defined kinetic behavior (eg ESI Fig S6), alt-hough fitting the small signal sizes to an exponential decay function suggested a timescale on the order of ~10 ps. Extrac-tion of the L1 relaxation dynamics was found to be problem-atic due to spectral congestion.
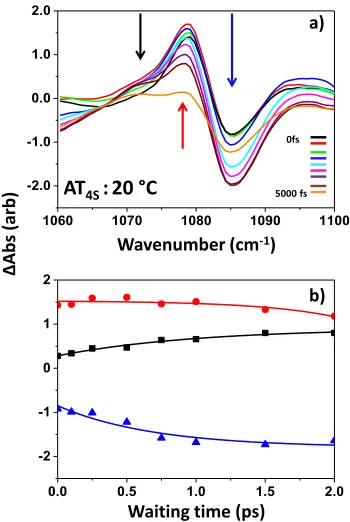
In the case of the off-diagonal peaks linking to the P2 mode, more complex peak dynamics were observed. In par-ticular, the shape of the features was observed to evolve with waiting time. This is shown in Fig.5(a) via a series of slices through the peak linking P2 with AT4S that are representative of all of the off-diagonal peaks associated with the P2 mode in the ds-DNA sample. The negative feature (blue arrow) was observed to follow similar dynamics to those of the L2 peaks described, with a 700 ± 150 fs rise time observed in the major-ity of cases. The positive feature however showed two com-ponents. At early waiting times, a narrow feature shifted by ~5 cm-1 to lower probe frequency dominated the lineshape (red arrow). At longer waiting times this feature decayed and a broader feature centered some 12-15 cm-1 to lower probe frequency was observed to grow into the spectrum (black). This process is shown most clearly by comparing the black (waiting time: 0 fs), purple (1500 fs) and orange traces in Fig 5(a), but is also seen in the 2D-IR spectrum (labelled i) in Fig. 4) and in fits to the data (ESI Fig S6). Fig.5(b) shows the ear-ly-time dynamics of the three features. Fitting revealed two timescales: The negative (blue arrow) and broad positive (black) features typically shared a 700 ± 150 fs rise time, while the narrow positive feature (red arrow) was observed to in-crease slightly but with a timescale that lay well within the experimental pulse duration; meaning it is possible only to state that it is clearly present from early waiting times. All peaks show a similar long (~10 ps) decay time to the L2 peaks.
1100 1080 1060 1040 1700
1650
1600
1100 1080 1060
1040 1040 1060 1080 1100 1040 1060 1080 1100
Probe frequency (cm-1)
Pump
fr
equ
en
cy
(
cm
-1)
a) 100 fs b) 250 fs c) 500 fs d) 1000 fs
20 ˚C - dsDNA
Though partially obscured by the P2 peaks, a positive fea-ture can be seen in the 2D-IR data at probe frequencies of ~1090 cm-1 (labelled (ii) in Fig.4), which was observed to reach a peak amplitude at waiting times of around 500 fs and decay rapidly, disappearing by 1500 fs.
Single-stranded DNA: Increasing the temperature to 80 °C and inducing melting of the helix (Fig.1(e)) led to several changes in the spectra, suggesting a fundamental alteration in the nature of the base-backbone interaction. Off-diagonal peaks linking each of the base vibrational modes to the L2 mode are still observable. However, all off-diagonal peaks linking base modes to the P2 mode are lost, with the excep-tion of that between the P2 and T2S modes. This results in the features linking the T4S, TR and AR1 modes to the L1 mode becoming clearer (Fig.1(e)). These changes can also be seen in cross-sections through the data at excitation frequencies corresponding to the AT2S and AT4S modes (Fig.3(c,d) where the shift in the highest frequency negative feature from a position corresponding to the P2 mode (Fig.3(c)) to one matching the L1 (Fig.3(d)) is observable.
Examples of the dynamics of the peaks observed for the ss-DNA sample (80 °C) are shown in Fig.6. For ss-ss-DNA, all of the off-diagonal peaks visible in the backbone 2D-IR spec-trum were again observed to be present at the earliest wait-ing times (Fig.6(a)). For off-diagonal peaks linkwait-ing base modes to the L2 mode (labelled (i) in Fig.6), similar dynamics were observed to those of the ds-DNA sample: a ~650 fs rise followed by a ~10 ps decay.
[image:5.612.80.255.399.660.2]The single off-diagonal peak associated with the P2 mode (labelled (ii) in Fig.6) showed markedly different dynamics in the ss-DNA sample from those in the ds-DNA sample:
Figure 5: a) Slices through two-color 2D-IR spectra as a function
of waiting time showing the peak shape evolution of the off-diagonal peaks to the P2 mode. b) shows the early-time dynamics of the three components identified by arrows in a). Data in a) has been smoothed as in Fig.3.
The peak shape evolution of the positive features was not observed (Fig.3(c)), instead this feature demonstrated similar rise and decay dynamics to the L2 peaks, though with a slightly faster rising timescale of 350 fs recovered. The effects of peak overlap prevented reliable extraction of the L1 dy-namics. In addition to these peaks, the positive feature near 1090 cm-1 is still clearly visible for the ss-DNA sample (Fig.6, labelled iii)) and shows similar dynamics at both tempera-tures studied.
Discussion
The results highlight three main areas of interest: i) the as-signment of the conformationally-sensitive off-diagonal fea-tures in the backbone 2D-IR spectra ii) comparisons of the vibrational dynamics between ss- and ds-DNA conformations and iii) the marked differences in the observed behavior of off-diagonal peaks to the P2 mode between ss- and ds-DNA forms.
Off-diagonal peak assignments - coupling: There are three possible assignments for 2D-IR off-diagonal peaks: vibrational coupling of the modes; energy transfer during the elapsed waiting time or chemical exchange. 38 Chemical ex-change is not applicable in this case, suggesting that the off-diagonal peaks observed in the two-color 2D-IR datasets must arise either from direct coupling of base modes with the phosphate backbone modes and/or energy transfer. In the event that they arise from vibrational coupling, the off-diagonal features would be expected to appear at the ear-liest waiting times and the frequency separation of the posi-tive and negaposi-tive components of the lineshape would be de-fined by the off-diagonal anharmonicity of the coupled modes (Δij; the shift in energy of the combination band rela-tive to the sum of the energies of the one-quantum excita-tions). 39 For weak couplings, this is manifest as a reduction in overall amplitude of the off-diagonal feature as the two components of the lineshape overlap. In straightforward cases, these features would be expected to decay with the lifetime of the excited mode. In the case of energy transfer, the off-diagonal peak separation reflects the diagonal an-harmonicity of the receiving mode, while the amplitude typi-cally follows a rise and decay profile associated with energy transfer and subsequent relaxation dynamics. 40
The off-diagonal peaks observed in the backbone 2D-IR spectra (Figs.1,4,6) are present from the earliest waiting times. This invites an assignment to coupling. However, the peaks show an amplitude of <5% of that of the corresponding diagonal peaks, despite similar transition dipole strengths, suggesting that this effect is likely to be very weak (Δij ≤ 1 cm -1). In addition, the decay dynamics observed are considerably longer than those of the excited base modes (~750 fs). Vibra-tional coupling reduces sharply with distance and mode fre-quency separation and thus direct coupling of the bases to the phosphate modes without a large delocalized vibrational mode structure or close proximity of these features would seem unlikely.40 It is also plausible that the fast relaxation of the bases and 300 fs pulse duration employed could combine to give rise to a small signal from energy transfer at very short waiting times, without coupling.
An assignment of the majority of the off-diagonal peaks, in particular those pertaining to the L1 and L2 modes, at short waiting times to direct vibrational coupling, while possible, is
1060 1070 1080 1090 1100 -2.0
-1.0 0.0 1.0 2.0
AT
4S: 20 °C
Wavenumber (cm-1)
Δ
Abs
(arb
)
Waiting time (ps) a)
b)
0.0 0.5 1.0 1.5 2.0 -2
-1 0 1 2
0fs
Figure 6: Two-color 2D-IR spectra as a function of waiting time obtained for the ss-DNA sample under ZZYY polarization conditions. The wait-ing time is quoted in the individual figure legends. Labels in a,d and f) show i) the position of the L2 features that display energy transfer dynamics, ii) the only off-diagonal peak to the P2 mode that remains in the ss-DNA configuration and iii) the v=1-2 transition of the 1105 cm-1 deoxyribose mode as referred to in the text.
not conclusively proven by the data. It may be considered that the double helix might give rise to the long-range effects that could enable coupling, as seen between carbonyl vibra-tions in an α-helix for example, 41 however, the persistence of these features at elevated temperature (ss-DNA) is not con-sistent with this hypothesis. In contrast, some clear changes in the off-diagonal peak patterns upon formation of ds-DNA occur that are specific to the P2 mode in our dataset. These indicate that the ordered helical structure does in fact influ-ence the coupling of the bases to certain backbone modes and we will return to this in detail below.
Off-diagonal peak assignments – energy transfer: Under both double and single strand conditions, the majori-ty of the off-diagonal features, with the exception of the nar-row positive feature uniquely associated with the P2 modes in ds-DNA, rise to a maximum within 1-2 ps and then decay. This suggests that an energy transfer mechanism dominates the off-diagonal peak behavior. The close agreement of the timescales of the rising dynamics (~650 fs in most cases) with base mode T1 times could indicate a direct energy transfer pathway, but the peak separations observed for the off-diagonal peak pairs, while similar, are not identical to the diagonal anharmonicities reported from one-color 2D-IR spectroscopy of the phosphate region (See Table S1, ESI).29 This observation is not consistent with direct energy transfer and such a process would normally require significant vibra-tional coupling or proximity of the modes as well as a mech-anism for energy conservation given the large (~600 cm-1) frequency separation of the base and backbone modes.40 The vibrational lifetimes of the P2, L1 and L2 modes were recently reported to be in the region of 1200-2500 fs, which are also inconsistent with the long relaxation dynamics observed for the off-diagonal features. 29
An alternative mechanism to explain the temporal behav-ior of the off-diagonal peaks could involve relaxation of the
base vibrations leading to population transfer to an interme-diary mode or modes that are coupled to the backbone modes, giving rise to off-diagonal peaks. Such a situation has been reported in large molecular systems using relaxation-assisted 2D-IR spectroscopy. 40,42,43 This mechanism would explain the correlation between the rise time of the off-diagonal peaks and T1 of the base diagonal peaks without direct energy transfer in the first instance. In this case, the off-diagonal peak separation reflects the coupling of the in-termediary and backbone modes, which would be expected to differ from the diagonal anharmonicity of the backbone modes. The indication is that population transfer to the backbone modes then follows. This is consistent with the slow decay time of the off-diagonal peaks because multiple energy transfer pathways through the DNA molecule will stretch the timescales for energy flow into backbone modes, with only the fastest being clearly resolved in the peak dy-namics. It would be expected that temporal evolution of the lineshape be observed as population transfer to the backbone modes ensued but if diagonal and off-diagonal anharmonici-ties are similar, or multiple intermediary modes are involved then this may be obscured.
A schematic of the mode patterns for DNA is shown in Fig.7. Whilst many candidates for these intermediary modes exist and would be consistent with evidence from the dy-namic data, we suggest no single definitive route is opera-tional. The prospect of structural inhomogeneity along the 15 base strand may also influence the observed dynamics.37 Specific candidate modes include lower frequency modes of the bases and modes of the deoxyribose moiety. In particular, from experiments, lower frequency base modes are known to couple to excited higher frequency modes19 and coupling of base and sugar ring modes has also been proposed in model systems.31,32 It is noteworthy that the sugar moiety has modes with frequencies of around 800-900 cm-1, and these are
de-1100 1080 1060 1040 1100
1080 1060
1040 1040 1060 1080 1100
1700
1650
1600
e) 750 fs f) 1000 fs
Probe frequency (cm-1)
Pump
fr
eq
ue
n
cy
(cm
-1)
a) 0 fs b) 100 fs c) 250 fs d) 500 fs
g) 1500 fs h) 2000 fs
80 ˚C - ssDNA
ii)
iii)
i)
i)
ii)
iii) ii)
i)
1700
1650
1600
scribed as being coupled to the phophodiester moiety. 37 The overtone (v=0-2) transition of the latter modes would match the frequency of the base modes well and could provide an efficient route for relaxation. That they are likely to be cou-pled to the phosphate group also makes these good candi-dates for the intermediary modes.
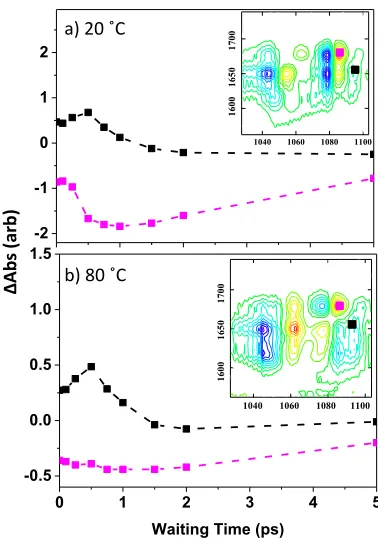
Here it is instructive to note the positive feature with fast rise and decay components that is located to the low fre-quency side of the 1105 cm-1 mode assigned to a deoxyribose vibration (Fig 4, labeled (iii) and Fig 6, labeled (ii)). A com-parison of the dynamics of this and peaks to the negative P2 feature is shown in Fig.8. This feature is located where one would expect an anharmonically-shifted v=1-2 transition of the 1105 cm-1 mode and the fact that it peaks at earlier waiting times than the P2 and L2 energy-transfer features and decays faster is entirely consistent with energy transfer from base to sugar prior to onward energy transfer to the backbone. It is noteworthy that the off-diagonal peaks to this feature appear to be dominated by excitation of the lower frequency base modes, involving ring vibrations of A and T, which would be expected to couple more efficiently to sugar modes due to proximity and a slightly narrower energy gap.31,32 As such, this experimentally-observed feature supports the proposed mechanism of relaxation from base modes through deoxyri-bose modes to the phosphate backbone.
[image:7.612.333.522.247.516.2]An energy cascade model, portrayed in Fig 7 that involves energy transfer from base to sugar is also consistent with IR pump-anti-Stokes Raman probe studies reported on AT sys-tems at 0% relative humidity, which showed that N-H stretching modes relax by populating other base vibrational modes in the 1660-1490 cm-1 region of the spectrum within 1 ps and lower frequency modes near 1330 cm-1 on 1-2 ps time-scales, which subsequently decayed over timescales greater than 5 ps. 27 The latter mode was not assigned but could be a low frequency base mode or a mode partially located on the sugar moiety and would be a candidate accepting mode in our model. 37
Figure 7: Schematic diagram showing relative positions of DNA vi-brational modes. Assignments as per Ref 37. Solid arrows show results from this work, dashed arrows show results from prior publications.
Conformation-dependence of Relaxation dynamics: The clear conclusion from the dynamic data is that the relax-ation processes of the peaks observed show very little
varia-tion with DNA conformavaria-tion; that of ss-DNA is very similar to ds-DNA.
The fact that the dynamics of peaks to the L2 mode and some components of the P2 mode peaks (the negative and broad positive features shown by the blue and black arrows in Fig.5(a)) are largely invariant with DNA configuration suggests that the dominant energy relaxation mechanism is common to both ds- and ss-DNA and rules out direct in-volvement of configuration-dependent routes involving sol-vent modes. On this basis we conclude that the increased solvent access to the bases, in particular the amino and car-bonyl units, is not a rate determining step in the overall re-laxation mechanism. Overall, our findings are in agreement with the “downhill” transfer of energy towards the backbone in solvated DNA,29 supporting the hypothesis that the fast energy dissipation mechanism acts to prevent damage in electronically excited ss- and ds-DNA.
Figure 8: a) Shows relative dynamics of P2 off-diagonal feature (ma-genta) and peak assigned to v=1-2 transition of deoxyribose vibrational mode located at 1105 cm-1 (black) at 20 ˚C (ds-DNA). The peak posi-tions are marked on the 2D-IR spectra in the insets. Note the faster rise and decay of the black trace relative to the magenta. b) As a) but at 80 ˚C (ss-DNA).
P2 mode dynamics: We now discuss further the structure-dependent behavior of the off-diagonal peaks linking to the P2 mode. That is; at elevated temperatures (ss-DNA), only a single off-diagonal peak is seen linking P2 to the AT2S base mode (Fig.1(e)), whilst at low temperatures (ds-DNA) off-diagonal peaks are observed linking all four base modes to the P2 transition (Fig.1(c)). The latter features are unique to the ds-DNA sample and show a complex peak-shape evolu-tion with waiting time (Fig.5(a)). Specifically, a narrow com-ponent observed at short waiting times is joined by a broad-er, red-shifted peak at later times. This behavior is consistent
-2 -1 0 1 2
1100 1080 1060 1040 a) 20 ˚C
0 1 2 3 4 5
-0.5 0.0 0.5 1.0 1.5
Waiting Time (ps) b) 80 ˚C
1040 1060 1080 1100
16
00
1
65
0
17
00
16
00
16
50
1
70
0
Δ
Ab
s
(ar
b
[image:7.612.73.289.465.637.2]with evolution from off-diagonal (i.e. coupled) character to diagonal (i.e. energy transfer) character. 39,40
The broad feature (Fig.5(a) black arrow)) behaves consistent-ly with this model in that it shows very similar dynamics to L2 mode peaks, suggesting that it is also attributable to the common energy transfer process from base to backbone. Whilst we assign this broad peak to the v=1-2 transition of the P2 band,29 the complexity of this spectral region is fur-ther highlighted by studies of the H2PO4- ion, which identify a Fermi resonance with the OPO bending vibration in the same spectral region.44
By contrast to the broad feature, the narrow ‘off-diagonal’ component of the P2 lineshape ((Fig.5(a), red arrow)) is very different to these energy-transfer features and strongly sug-gests a coupling interaction. The narrow peak is clearly pre-sent from the earliest waiting times and the smaller anhar-monic shift is consistent with a new coupling interaction arising from the formation of the double helix that gives way to the energy transfer features with increased waiting time. This suggests that the base modes are coupled to the phos-phate group by the creation of the W-C modes that accom-pany ds-DNA formation. The implication is that the new delocalized modes formed by the W-C interaction, which extend over a greater spatial range than the more isolated base modes, lead to further delocalized interactions within the helix that include the deoxyribose units and the phos-phate backbone. This agrees with, but significantly extends, predictions of interactions between base and deoxyribose ring vibrations,18,24 and leads to the possibility of delocalized helix-specific modes.
The P2 mode in IR absorption experiments undergoes a significant decrease in intensity upon duplex melting (Fig.1(a)) that cannot be attributed to broadening at in-creased temperature. One interpretation based on the 2D-IR results is that the loss of intensity stems from changes in the excitonic vibrational coupling of transition dipole moments as found for the α-helix in peptide units.38 In predictions of the IR spectroscopy of B-form AT sequences, it has been shown that significant coupling between T4S andAR1 modes leads to spatially delocalized exciton states in double helical strands.15 This is consistent with the peaks observed in the base 2D-IR spectra (Fig.1(d)). In contrast to the α-helix, the carbonyl modes of the W-C base pair align perpendicular to the axis of the helix. As the P2 transition dipole moments will align approximately parallel to the base pair axis (ESI Fig.S7), this would seem to favor an interaction with base pair modes that would extend the coupling to the backbone. In support of this, the off-diagonal peak observed between the AT4S mode (which is involved in base pairing) and the P2 mode is more intense than that from the AT2S mode (not involved in base pairing) under ZZZZ (parallel) polarization conditions; but this is reversed for ZZYY (perpendicular) polarization, indicating an alignment of base W-C modes and phosphate modes in ds-DNA.
Overall, the indication of these observations is that a new set of couplings occurs in ds-DNA, which link the base modes and the P2 mode of the phosphate group. This opens up a new energy transfer pathway that did not exist in the ss-DNA sample, with the exception of the T2S mode and so augments the energy transfer process observed, particularly for the L2 mode that is present in both ds- and ss-DNA. The differing structural arrangement of the bases, sugars and
backbone in the double helix thus opens up additional, though not apparently faster, routes for energy relaxation. This would correlate with the loss of other degrees of free-dom associated with formation of the helix structure, but implies that the rate determining step is still the transfer of energy from the base modes to other, lower frequency base modes and the deoxyribose unit.
In considering the unusual behavior of the T2S mode, which retains an energy transfer interaction with the bases in ss-DNA (Fig.6, labelled ii), it is perhaps of relevance that this carbonyl does not engage in W-C H-bonding and, in the ds-DNA configuration, is protected from solvated water by pro-jecting into the hydrophobic minor groove. This leads to a closer approach between the T2 carbonyl and the phosphate backbone in the ds-DNA sample and the fact that the energy transfer process remains upon melting of the helix implies that there may be some element of this interaction, perhaps linked to persistent hydrophobic effects, that remains in the ss-DNA sample independent of the helix formation. Crucial-ly, the aspect of the P2 off-diagonal peaks assigned to helix-specific coupling is not seen in the ss-DNA sample.
Conclusions
2D-IR spectroscopy has revealed for the first time, the ex-istence of ultrafast energy transfer processes linking vibra-tional modes of the bases with those of the phosphodiester backbone in both ss- and ds-DNA.
Our results show that vibrational energy dissipation from the bases proceeds via relaxation to populate lower frequency modes, some of which are located on the deoxyribose groups, which are coupled to the phosphate backbone. This is an intermediate step to vibrational population transfer to the backbone modes. It is determined that the dynamics of this mechanism are largely invariant upon melting of ds-DNA, consistent with the hypothesis that the phosphate groups are the primary energetic link between DNA and the solvent. 25,29
Formation of ds-DNA leads to new mode coupling pat-terns between base and backbone, specifically linking base vibrations to symmetric stretch of the phosphate group, sug-gesting that the delocalization of vibrational modes occur-ring in W-C H-bonding is extended in the double helix. The indication of interactions spanning base and backbone raises questions of whether these are base or sequence specific and so could relate to long-range dynamic processes that play a role in recognition or excited state energy dissipation. It is to be hoped that these data will stimulate further theoretical or computational simulation of this important molecule.
Author Information
Corresponding Author[email protected] Tel: +44 (0)141 5483763
Acknowledgment
The authors wish to acknowledge funding from the STFC (ST/M000125/1 and NTH Programme Access funding), BBSRC
(BB/L014335/1) and EPSRC, (University of Strathclyde
Doc-toral training grant), which supported this work.
Associated Content
Additional electronic content shows supplementary support-ing FT-IR, UV-vis and pump-probe spectroscopy data along with additional figures showing data fitting results. This in-formation is available free of charge via the internet at
http://pubs.acs.org
References
(1) Watson, J. D.; Crick, F. H. C. Molecular Structure of Nucleic Acids - A Structure for Deoxyribose Nucleic Acid, Nature1953,
171, 737-738.
(2) Krieg, A. M.; Yi, A. K.; Matson, S.; Waldschmidt, T. J.; Bishop, G. A.; Teasdale, R.; Koretzky, G. A.; Klinman, D. M. CpG Motifs in Bacterial-DNA Trigger Direct B-cell Activation,
Nature1995, 374, 546-549.
(3) Kuimova, M. K.; Cowan, A. J.; Matousek, P.; Parker, A. W.; Sun, X. Z.; Towrie, M.; George, M. W. Monitoring the Direct and Indirect Damage of DNA Bases and Polynucleotides by using Time-resolved Infrared Spectroscopy, Proc Nat Acad Sci2006,
103, 2150-2153.
(4) Kuimova, M. K.; Dyer, J.; George, M. W.; Grills, D. C.; Kelly, J. M.; Matousek, P.; Parker, A. W.; Sun, X. Z.; Towrie, M.; Whelan, A. M. Monitoring the Effect of Ultrafast Deactivation of the Electronic Excited States of DNA Bases and Polynucleotides following 267 nm Laser Excitation using Picosecond Time-resolved Infrared Spectroscopy, Chemical Communications2005, 1182-1184.
(5) Towrie, M.; Doorley, G. W.; George, M. W.; Parker, A. W.; Quinn, S. J.; Kelly, J. M. ps-TRIR covers all the Bases - Recent Advances in the use of Transient IR for the Detection of Short-lived Species in Nucleic Acids, Analyst2009, 134, 1265. (6) Middleton, C. T.; de La Harpe, K.; Su, C.; Law, Y. K.; Crespo-Hernandez, C. E.; Kohler, B. In Ann Rev Phys Chem
2009; Vol. 60, p 217-239.
(7) Schreier, W. J.; Schrader, T. E.; Koller, F. O.; Gilch, P.; Crespo-Hernandez, C. E.; Swaminathan, V. N.; Carell, T.; Zinth, W.; Kohler, B. Thymine Dimerization in DNA is an Ultrafast Photoreaction, Science2007, 315, 625-629.
(8) Perun, S.; Sobolewski, A. L.; Domcke, W. Ab initio Studies on the Radiationless Decay Mechanisms of the Lowest Excited Singlet States of 9H-adenine, J Am Chem Soc2005, 127, 6257-6265.
(9) Kang, H.; Lee, K. T.; Jung, B.; Ko, Y. J.; Kim, S. K. Intrinsic Lifetimes of the Excited State of DNA and RNA Bases, J Am Chem Soc2002, 124, 12958-12959.
(10) Pecourt, J. M. L.; Peon, J.; Kohler, B. DNA Excited-state Dynamics: Ultrafast Internal Conversion and Vibrational Cooling in a Series of Nucleosides, J Am Chem Soc2001, 123, 10370-10378.
(11) Pecourt, J. M. L.; Peon, J.; Kohler, B. Ultrafast Internal Conversion of Electronically Excited RNA and DNA Nucleosides in Water, J Am Chem Soc2000, 122, 9348-9349.
(12) Doorley, G. W.; Wojdyla, M.; Watson, G. W.; Towrie, M.; Parker, A. W.; Kelly, J. M.; Quinn, S. J. Tracking DNA Excited States by Picosecond-Time-Resolved Infrared Spectroscopy: Signature Band for a Charge-Transfer Excited State in Stacked Adenine-Thymine Systems, Journal of Physical Chemistry Letters
2013, 4, 2739-2744.
(13) Krummel, A. T.; Zanni, M. T. DNA Vibrational Coupling Revealed with Two-dimensional Infrared Spectroscopy: Insight into why Vibrational Spectroscopy is Sensitive to DNA Structure,
J Phys Chem B2006, 110, 13991-14000.
(14) Krummel, A. T.; Mukherjee, P.; Zanni, M. T. Inter and Intrastrand Vibrational Coupling in DNA Studied with Heterodyned 2D-IR Spectroscopy, J Phys Chem B2003, 107, 9165-9169.
(15) Lee, C.; Cho, M. Vibrational Dynamics of DNA : IV. Vibrational Spectroscopic Characteristics of A-, B-, and Z-form DNAs, J Chem Phys2007, 126, 145102.
(16) Lee, C.; Park, K.-H.; Kim, J.-A.; Hahn, S.; Cho, M. Vibrational Dynamics of DNA. III. Molecular Dynamics Simulations of DNA in Water and Theoretical Calculations of the Two-dimensional Vibrational Spectra, J Chem Phys2006, 125, 114510.
(17) Lee, C.; Park, K.-H.; Cho, M. Vibrational Dynamics of DNA. I. Vibrational Basis Modes and Couplings, J Chem Phys
2006, 125, 114508.
(18) Lee, C.; Cho, M. Vibrational Dynamics of DNA. II. Deuterium Exchange Effects and Simulated IR Absorption Spectra, J Chem Phys2006, 125, 114509.
(19) Peng, C. S.; Jones, K. C.; Tokmakoff, A. Anharmonic Vibrational Modes of Nucleic Acid Bases Revealed by 2D IR Spectroscopy, J Am Chem Soc2011, 133, 15650-15660. (20) Greve, C.; Preketes, N. K.; Fidder, H.; Costard, R.; Koeppe, B.; Heisler, I. A.; Mukamel, S.; Temps, F.; Nibbering, E. T. J.; Elsaesser, T. N-H Stretching Excitations in Adenosine-Thymidine Base Pairs in Solution: Pair Geometries, Infrared Line Shapes, and Ultrafast Vibrational Dynamics, J Phys Chem A2013, 117, 594-606.
(21) Szyc, L.; Yang, M.; Nibbering, E. T. J.; Elsaesser, T. Ultrafast Vibrational Dynamics and Local Interactions of Hydrated DNA, Angew Chemie Int Ed2010, 49, 3598-3610. (22) Greve, C.; Preketes, N. K.; Costard, R.; Koeppe, B.; Fidder, H.; Nibbering, E. T. J.; Temps, F.; Mukamel, S.; Elsaesser, T. N-H Stretching Modes of Adenosine Monomer in Solution Studied by Ultrafast Nonlinear Infrared Spectroscopy and Ab Initio Calculations, J Phys Chem A2012, 116, 7636-7644. (23) Yang, M.; Szyc, L.; Elsaesser, T. Femtosecond Two-Dimensional Infrared Spectroscopy of Adenine-Thymine Base Pairs in DNA Oligomers, J Phys Chem B2011, 115, 1262-1267. (24) Yang, M.; Szyc, L.; Elsaesser, T. Decelerated Water Dynamics and Vibrational Couplings of Hydrated DNA Mapped by Two-Dimensional Infrared Spectroscopy, J Phys Chem B
2011, 115, 13093-13100.
(25) Szyc, L.; Yang, M.; Elsaesser, T. Ultrafast Energy Exchange via Water-Phosphate Interactions in Hydrated DNA, J Phys Chem B2010, 114, 7951-7957.
(26) Szyc, L.; Dwyer, J. R.; Nibbering, E. T. J.; Elsaesser, T. Ultrafast dynamics of N-H and O-H stretching excitations in hydrated DNA oligomers, Chem Phys2009, 357, 36-44. (27) Kozich, V.; Szyc, L.; Nibbering, E. T. J.; Werncke, W.; Elsaesser, T. Ultrafast Redistribution of Vibrational Energy after Excitation of NH Stretching Modes in DNA Oligomers, Chem Phys Lett2009, 473, 171-175.
(28) Dwyer, J. R.; Szyc, L.; Nibbering, E. T. J.; Elsaesser, T. Ultrafast Vibrational Dynamics of Adenine-thymine Base Pairs in DNA Oligomers, J Phys Chem B2008, 112, 11194-11197. (29) Siebert, T.; Guchhait, B.; Liu, Y.; Costard, R.; Elsaesser, T. Anharmonic Backbone Vibrations in Ultrafast Processes at the DNA-Water Interface, J Phys Chem B2015, 119, 9670-9677. (30) Guchhait, B.; Liu, Y.; Siebert, T.; Elsaesser, T. Ultrafast Vibrational Dynamics of the DNA Backbone at Different Hydration Levels Mapped by Two-dimensional Infrared Spectroscopy, Struct dyn2016, 3, 043202-043202. (31) Pelmenschikov, A.; Hovorun, D. M.; Shishkin, O. V.; Leszczynski, J. A Density Functional Theory Study of Vibrational Coupling between Ribose and Base Rings of Nucleic Acids with Ribosyl Guanosine as a Model System, J Chem Phys2000, 113, 5986-5990.
(33) Deflores, L. P.; Nicodemus, R. A.; Tokmakoff, A. Two Dimensonal Fourier Transform Spectroscopy in the Pump-probe Geometry, Opt Lett2007, 32, 2966-2968.
(34) Shim, S. H.; Strasfeld, D. B.; Ling, Y. L.; Zanni, M. T. Automated 2D IR Spectroscopy using a Mid-IR Pulse Shaper and Application of this Technology to the Human Islet Amyloid Polypeptide, Proc Nat Acad Sci2007, 104, 14197-14202. (35) Donaldson, P. M.; Greetham, G. M.; Shaw, D. J.; Parker, A. W.; Towrie, M. A 100 kHz Pulse Shaping 2D-IR Spectrometer based on Yb:KGW Amplifiers, Opt Lett2016, submitted. (36) Greetham, G. M.; Donaldson, P. M.; Nation, C.; Sazanovich, I. V.; Clark, I. P.; Shaw, D. J.; Parker, A. W.; Towrie, M. A 100 kHz Time-Resolved Multiple-Probe Femtosecond to Second IR Absorption Spectrometer., Appl Spectrosc2016, doi:
10.1177/0003702816631302.
(37) Banyay, M.; Sarkar, M.; Graslund, A. A Library of IR Bands of Nucleic Acids in Solution, Biophysical Chemistry2003, 104, 477-488.
(38) Hamm, P.; Zanni, M. T. Concepts and Method of 2D Infrared Spectroscopy; Cambridge University Press: Cambridge, 2011.
(39) Rubtsov, I. V.; Hochstrasser, R. M. Vibrational Dynamics, Mode Coupling, and Structural Constraints for Acetylproline-NH2, J Phys Chem B2002, 106, 9165-9171.
(40) Rubtsova, N. I.; Rubtsov, I. V. In Annual Review of Physical Chemistry, Vol 66; Johnson, M. A., Martinez, T. J., Eds. 2015; Vol. 66, p 717-738.
(41) Fang, C.; Wang, J.; Kim, Y. S.; Charnley, A. K.; Barber-Armstrong, W.; Smith, A. B.; Decatur, S. M.; Hochstrasser, R. M. Two-dimensional Infrared Spectroscopy of Isotopomers of an Alanine Rich Alpha-helix, J Phys Chem B2004, 108, 10415-10427.
(42) Naraharisetty, S. R. G.; Kasyanenko, V. M.; Rubtsov, I. V. Bond Connectivity Measured via Relaxation-assisted Two-dimensional Infrared Spectroscopy J Chem Phys2008, 128, 104502.
(43) Kurochkin, D. V.; Naraharisetty, S. R. G.; Rubtsov, I. V. A Relaxation-assisted 2D IR Spectroscopy Method, Proc Nat Acad Sci2007, 104, 14209-14214.