City, University of London Institutional Repository
Citation
:
Burton, R., Smith, N. D. and Crabb, D. P. (2014). Eye movements and reading in
glaucoma: observations on patients with advanced visual field loss. Graefe's Archive for
Clinical and Experimental Ophthalmology, 252(10), doi: 10.1007/s00417-014-2752-x
This is the published version of the paper.
This version of the publication may differ from the final published
version.
Permanent repository link:
http://openaccess.city.ac.uk/8392/
Link to published version
:
http://dx.doi.org/10.1007/s00417-014-2752-x
Copyright and reuse:
City Research Online aims to make research
outputs of City, University of London available to a wider audience.
Copyright and Moral Rights remain with the author(s) and/or copyright
holders. URLs from City Research Online may be freely distributed and
linked to.
City Research Online:
http://openaccess.city.ac.uk/
[email protected]
1 23
Graefe's Archive for Clinical and
Experimental Ophthalmology
Incorporating German Journal of
Ophthalmology
ISSN 0721-832X
Graefes Arch Clin Exp Ophthalmol
DOI 10.1007/s00417-014-2752-x
Eye movements and reading in glaucoma:
observations on patients with advanced
visual field loss
1 23
GLAUCOMA
Eye movements and reading in glaucoma: observations
on patients with advanced visual field loss
Robyn Burton&Nicholas D. Smith&David P. Crabb
Received: 14 November 2013 / Revised: 2 June 2014 / Accepted: 14 July 2014
#Springer-Verlag Berlin Heidelberg 2014
Abstract
PurposeTo investigate the relationship between reading speed and eye movements in patients with advanced glaucomatous visual field (VF) defects and age-similar visually healthy people.
Methods Eighteen patients with advanced bilateral VF defects (mean age: 71, standard deviation [SD]: 7 years) and 39 controls (mean age: 67, SD: 8 years) had reading speed measured using short passages of text on a computer set-up incorporating eye tracking. Scanpaths were plotted and analysed from these experiments to derive measures of‘ per-ceptual span’ (total number of letters read per number of saccades) and‘text saturation’(the distance between the first and last fixation on lines of text). Another eye movement measure, termed‘saccadic frequency’(total number of sac-cades made to read a single word), was derived from a separate lexical decision task, where words were presented in isolation.
ResultsSignificant linear association was demonstrated between perceptual span and reading speed in patients (R2= 0.42) and controls (R2= 0.56). Linear association between saccadic frequency during the LDT and reading speed was also found in patients (R2= 0.42), but not in controls (R2=0.02). Patients also exhibited greater average text saturationthan controls (P=0.004).
Conclusion Some, but not all, patients with advanced VF defects read slower than controls using short text passages. Differences in eye movement behaviour may partly account for this variability in patients. These patients were shown to saturatelines of text more during reading, which may explain previously-reported difficulties with sustained reading.
Keywords Glaucoma . Reading . Eye movements . Visual fields . Perimetry
Introduction
Difficulty with reading is a common complaint made by patients with glaucoma [1–5]. Studies measuring actual reading performance have revealed impaired reading speed in patients when reading small print [6] or pas-sages of text presented at low contrast [7]. Other studies measuring reading performance indicate that patients are likely to read more slowly than normally sighted peers if they have visual field (VF) defects located within the central 3° of vision [8], or if they have advanced bilateral VF loss [9, 10]. Recent work has revealed that differences in average reading speeds between glaucoma patients and normally sighted peers are particularly pro-nounced during periods of sustained silent reading [11]. A common feature of these studies is that reading performance (reading speed) is subject to much between-person variability.
Eye movements are inherently linked to the process of reading [12]. So, one potential explanation why some, but not all, glaucoma patients experience difficulties with reading, may relate to differences in eye movement behaviour. There-fore, this study focuses on observations on eye movement measures in glaucoma patients who have advanced VF defects in both eyes whilst performing reading tasks. As an example, the size of the window of characters in a word that are attended to at each fixation, known as the perceptual span [13], is associated with reading speed. People with a reduced percep-tual span saccade more frequently [14] have smaller forward saccade amplitudes and show slower reading speeds [15]. One indirect measure of the size of the perceptual span is the number of letters read divided by the number of forward
R. Burton
:
N. D. Smith:
D. P. Crabb (*)Department of Optometry and Visual Science, City University London, Northampton Square, London EC1V 0HB, UK e-mail: [email protected]
Graefes Arch Clin Exp Ophthalmol DOI 10.1007/s00417-014-2752-x
saccades made to read these letters in a short passage of text [16]. The perceptual span as a mechanism for slower reading in glaucoma patients has not yet been explored; for example, advanced central VF defects may limit the patient’s ability to assimilate information during any given fixation.
This study primarily aimed to explore associations between perceptual span and reading speed in patients with advanced glaucoma and in age-similar visually healthy controls. We also examine the relationship between reading speed and the number of saccades made during the presentation of a single word in a lexical decision task (LDT). Put simply, this is the number of saccades made to read a set of words presented in isolation. We assume that the occurrence of multiple eye movements indicates that a word cannot be read during a single fixation; a feature that may reflect the restricting presence of scotoma, especially those found in patients with advanced VF loss. We hypothesise that larger numbers of saccades made during the LDT may be related to slower reading speeds in patients. We also investigate a third eye movement and reading measure, that we name text saturation: defined as the distance covered by the point of regard between the first and final fixation on a line of text. It is expressed simply as the percentage of a line covered; thus, 100 % would be a fixation from the beginning of the very first letter of a line of text to the end of the final letter on that line. We hypothesise that patients with advanced VF defects need to‘cover’a greater amount of text on a line and, therefore, may exhibit moretext saturationthan their normally sighted peers.
Methods
Participants, inclusion criteria, and vision testing
Patients were recruited from Moorfields Eye Hospital NHS Foundation Trust, London, UK. All patients were recruited to have a clinical diagnosis of glaucoma and be between 50 and 80 years of age. All patients had advanced glaucomatous VF defects as defined by the Hodapp, Parrish, and Anderson classification [17] in both eyes using the Humphrey Field Analyzer (HFA; Carl Zeiss Meditec, Dublin, CA, USA). In short, to be classified as having an‘advanced’VF defect, an eye has to either have a HFA Mean Deviation (MD) of worse than−12 dB, or have more than 50 % of their VF test point sensitivity values depressed below the 5 % normative level, or have more than 20 points depressed below the 1 % normative level on the HFA pattern deviation plot, or have at least one point in the central 5° with a sensitivity of 0 dB. Participants were not recruited if they had any ocular disease other than glaucoma (except for an uncomplicated lens replacement cata-ract surgery). Patients had slit-lamp biomicroscopy performed
by an ophthalmologist to exclude ocular disease, especially any concomitant macular pathology. Patients were not recruited if they had ocular surface disease or any significant problems with dry eye. Visually healthy controls, of a similar age to the patients, were recruited from the City University London Optometry Clinic, which is located close to the hospital. Therefore, cases and controls were drawn from an identical geodemographic area.
Recruitment, for patients and controls, was restricted to those with corrected binocular visual acuity (BVA) of at least 0.18 logMAR (Snellen equivalent of 6/9) as measured using an Early Treatment Diabetic Retinopathy Study (ETDRS) chart. We chose to restrict the study to patients with preserved VA to allow for the contribution of VF loss on reading to be better isolated, since previous research has suggested that differences in reading speed in patients with glaucoma may be mediated through the loss of VA and not VF defects [9]. Astigmatic error was less than ±2.5 Dioptres in all those recruited, and no eyes were amblyopic. All participants had English as a first language, or had spoken it for 15 years or more (one patient and two controls), and were not recruited if they reported reading difficulty such as dyslexia. Participants were not enrolled if they were on any significant medication other than that for their glaucoma; ‘significant medication’ included anti-depressants, or treatment for diabetes, or signif-icant use ofβ-blocker medication.
All participants underwent vision testing on the day of the study. Contrast sensitivity was measured in log units with a Pelli–Robson chart (PRlogCS). VFs were measured using the HFA 24–2 SITA standard and 10–2 SITA standard algorithms in both eyes. The latter were then used to compute a central binocular measure of the VF known as the Integrated Visual Field (IVF). The IVF is a method of quantifying the binocular VF by merging results from monocular fields, whereby each individual’s best point-by-point monocular sensitivity is used [18,19]. In this study, IVF and IVF MD was calculated for each patient’s 10–2 SITA standard VF using purpose-written software (freely available from the authors). To confirm that control participants had no VF defects which would compro-mise their role as a control in the study, 24–2 SITA fast VFs were conducted in both eyes satisfying Glaucoma Hemifield Test classification‘within normal limits’. To eliminate signif-icant media opacity (cataract) and other lens type artefacts as confounding ocular conditions, all participants were required to be within‘normal limits’for abnormal light scattering in the eye media using the Oculus C-Quant straylight meter (Oculus GmbH, Wetzlar, Germany).
The study was approved by a UK National Health Service, National Research Ethics Service committee. The study conformed to the Declaration of Helsinki, and all participants gave their informed written consent prior to participation. All data from the study, with patient identifiers removed, were transferred to a secure computer at the University.
Graefes Arch Clin Exp Ophthalmol
Experimental procedures
Reading experiment
The reading material consisted of eight paragraphs of text (68–79 words per text), adapted from an English fiction book. The texts were presented at 100 % contrast on a 560 mm CRT computer monitor displaying at a resolution of 1,600×1,200, with a refresh rate of 100Hz (Iiyama Vision Master PRO 514; Iiyama Corporation, Iiyama, Japan). All texts were fixed and non-scrolling, and matched for readability according to the Flesch–Kincaid measure [20]. Text was displayed in Arial font size 48 subtending 34 pixels on the screen and equating to 0.84° (height) for the largest character. This size approxi-mately corresponds to a medium/large size newspaper head-ing, and was chosen at the outset to improve the accuracy of the eye movement data. Line length subtended 20° width. All participants wore standard trial frames with a refractive cor-rection suitable for the viewing distance of 60 cm. Testing was performed in a dark room, and a table-mounted chin rest was used to maintain this viewing distance. The letters of the text were‘black on white’, with a background screen luminance of 33.4 cd/m2. The mean luminance of the screen was 0.05 cd/ m2. Participants viewed one passage at a time in random order. Participants were given the same verbal instructions: to“read the text silently, as quickly and accurately as possible”and to
“…confirm when they had reached the end of the passage”. Participants were also asked questions about the content of the text to check for reading comprehension.
Eye movements and reading duration (number of words read per minute [WPM]) were measured using an EyeLink 1,000 (SR Research Ltd., Mississauga, ON, Canada). The EyeLink samples pupil position monocularly at 500 Hz, with an average accuracy of better than 0.5°, and uses velocity and acceleration thresholds of 30°/s and 8,000°/s2respectively to identify saccades. The EyeLink proprietary algorithm was used to calibrate and verify the subject’s point of regard in relation to the correct location on the display. A specified calibration accuracy of at least a“good”level was a prerequi-site before each trial. Between each trial, a drift correction was performed and in the case where a large drift was detected, the system was recalibrated as necessary.
Lexical decision task
This computer-based test was performed on the same exper-imental setup as previously described. Participants were re-quired to fixate on a centrally located target that was then replaced with a stimulus. This stimulus was either a real word such as‘spoon’or a false word such as‘sploon’. Participants identified the target word as either real or false by verbally expressing ‘true’ and ‘false’ respectively (forced choice). Words were presented at 100 % contrast in Times New Roman
with a font size of 14, subtending a height of 1.14°. The width of the words presented ranged from 1.10 to 3.20°. All stimuli remained on screen until a response was given. A practice session of five stimuli words was used before a total of 30 stimuli words (15 real words and 15 false words) were pre-sented to participants in a random order. All words were matched for frequency in the English language, and false words were matched to the real words with regard to word length.
Non-vision measures
Participants also completed two non-vision tasks. The Middlesex Elderly Assessment of Mental State (MEAMS, Pearson, London, UK) is a psychometric screening test designed to detect impairment of cognitive skills in an elderly population [21, 22]. Participants also completed a modified form of the Burt Word Reading Test, a standardised reading test designed to measure reading abilities [23]. Partic-ipants read the words out loud in a quiet, brightly lit room, starting at the top of a list and reading down to progressively more difficult words. The Burt test score was the number of words read incorrectly.
Eye movements and analysis
Scanpaths of eye movements were plotted for each and every passage of text (trial). The reading speed in words per minute (wpm) for each trial was calculated by simply dividing the number of words read by the patients’reading duration. The median value from the eight trials was used as an estimate of each participant’s overall average reading speed. The percep-tual span was computed as the number of letters read, divided by the number of forward saccades (from left to right) [16]. The median value from the eight trials was used to estimate a participant’s average perceptual span.
Scanpaths of eye movements were plotted for every LDT trial. A measure ofsaccadic frequencywas calculated as the total number (sum) of saccades made during the first 1,000 ms of the LDT across each of all 30 trials. This measure differs from the measure of perceptual span in that it is based on the eye movements made during the presentation of a single word, rather than a paragraph of text. Any saccade exceeding the length of the word presented was assumed to be noise and was excluded.
Text saturationwas calculated as the average percentage of a line of text covered by the point of regard during reading of the passages of text. As with the other analyses, this was done by retrospectively considering every plotted scanpath for each trial, identifying the fixations on a line and computing the distance covered in the horizontal values as recorded by the eye tracker. The difference in horizontal distance between the first and last fixation, calculated as a percentage of the
Graefes Arch Clin Exp Ophthalmol
horizontal distance between the first and last letter in each line of the text, was computed for each trial. The median of the different values from each line of text (excluding the first and last lines) was used as an estimate of the participant’s text saturation per trial, and the median of these was used to estimate averagetext saturationper person.
Average differences between the patient and control group for reading speed, size of perceptual span,saccadic frequency, and other experimental variables were calculated and com-pared using two-samplet-tests. Univariate correlation coeffi-cients for perceptual span and saccadic frequency against reading speed (wpm) were calculated for patients and the controls separately. Additional variables considered as poten-tial correlates of reading speed in patients were the IVF 10–2 MD, PRlogCS, and LogMAR BVA.‘Statistical significance’ was represented by a value of at least 1 % (alpha=0.01), in order to accommodate modest multiple testing of univariate
correlations. Average difference intext saturationbetween the patient and control group was compared using a Mann–Whitney test. Scanpaths were analysed throughout using the EyeLink Data Viewer software (SR Research Ltd., Mississauga, ON, Canada) and also plotted using IGOR Pro (Wavemetrics, Lake Oswego, OR, USA). All statistical analysis was conducted using SPSS 18 (IBM Corporation, Somers, NY, USA).
Results
Participant characteristics
[image:7.595.50.546.71.235.2]Eighteen patients with glaucoma and 40 visually healthy controls took part in this study. One control was removed from the analysis due to problems with lost data. Fifty-eight
Table 1 measured characteristic of participants
Patientsn=18: mean (standard deviation)
Controlsn=39: mean (standard deviation)
Pvalue for between-group difference
Age 71 (7) 67 (8) 0.07
Percentage female 54 67 0.36 logMAR BVA 0.05 (0.08) −0.05 (0.09) <0.001 PRlogCS 1.79 (0.20) 1.95 (0.00) <0.001 Left eye 24–2 VF MD (dB) −11.0 (5.9) – – Right eye 24–2 VF MD (dB) −13.9 (8.1) – – Average reading speed (wpm) 273 (51) 293 (63) 0.30 MEAMS score* 34.1 (1.9) 34.4 (1.8) 0.49 Burt test score** 0.9 (0.7) 1.3 (1.6) 0.36 Lexical decision task (LDT) score*** 0.8 (1.0) 0.8 (0.8) 0.91 * scored out of 35, ** number of words read incorrectly, *** number of incorrectly identified words
Fig. 1 The relationship between perceptual span and reading speed (wpm) across (a) the control subjects and (b) the patients with glaucoma. Each data point refers to a single tested individual. Thegreen data pointsare participants who made two or more errors in the Burt Test
Graefes Arch Clin Exp Ophthalmol
[image:7.595.84.510.494.691.2]trials out of the total 456 reading trials (8 %) were exclud-ed due to calibration issues with the eye tracker (no person had more than 50 % of trials removed). The average number of excluded trials was 1.0 (standard deviation [SD]: 0.8) and 1.0 (SD: 1.1) for the patient and control group respectively. Measured characteristics of the study groups are shown in Table1.
In summary, average values from the patients were statis-tically significant from controls on measures of visual func-tion, but not on age, sex, MEAMS, the number of errors in the Burt Word Reading Test, the number of incorrectly identified words in the LDT. No statistically significant difference in average reading speed (wpm) between patients and controls was found (P=0.30).
Perceptual span and reading speed
The correlation between perceptual span and reading speed was moderate and statistically significant for control subjects (R2=0.56, P<0.001) and for patients (R2=0.42, P=0.004) (Fig.1). No statistically significant difference in the average size of the perceptual span between control subjects (mean=8, SD=2.2 characters) and patients with glaucoma (mean = 7, SD=1.9 characters) was observed (P=0.34).
Saccadic frequency and reading speed
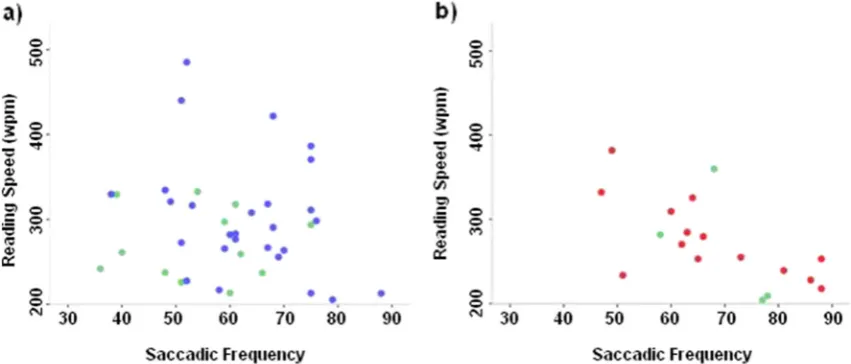
Correlation betweensaccadic frequency from the LDT and reading speed was moderate and statistically significant for patients (R2= 0.42, P= 0.004). In contrast, there was no evidence of correlation between saccadic frequency from the LDT and reading speed in the controls (R2=0.02, P=0.50) (Fig.2). Control subjects made fewer total number of saccades (mean=60.5, SD=12.3) during the LDT than
patients (mean=68, SD=12.9), and this difference was statistically significant (P=0.04).
Visual function and reading speed
No statistically significant correlation was found between logMAR BVA and reading speed (R2= 0.03, P= 0.46) or PRlogCS and reading speed (R2=0.11,P=0.11) in the patient group. Moreover, there was no statistically significant corre-lation between IVF 10–2 MD and reading speed (R2=0.10, P=0.20) in the patient group.
No statistically significant correlation between the mea-sures of non-vision function (MEAMS, errors on Burt Word Reading Test, and LDT score) and reading speed was found in either the patient or control group (allP>0.05).
Fig. 2 The relationship between saccadic frequency in the LDT and reading speed (wpm) across (a) control subjects and (b) patients with glaucoma. Each data point refers to a single tested individual. Thegreen data pointsare participants who made two or more errors in the Burt Test
Fig. 3 The relationship between 10–2 IVF MD (dB) and reading speed (wpm) in the patient group. Each data point refers to a single tested individual. The data points indicated byclosed symbolsare discussed in Figs.4and5
Graefes Arch Clin Exp Ophthalmol
[image:8.595.306.544.53.243.2] [image:8.595.84.510.509.691.2]Observations of eye movement patterns in patient cases
The patient labelled in the upper left region of the plot shown in Fig. 3 had a proficient average reading speed of 382 wpm despite having an advanced binocular cen-tral VF defect (IVF MD =−21.5 dB). Scanpaths superimposed on one of the reading trials, and some of the LDT words for this patient (Fig. 4), illustrate how this patient exhibits an idiosyncratic tendency to fixate diagonally to the upper right of a presented word, or the line of text. When considering the status of this patient’s central VF, it is tempting to observe that this patient is adjusting their point of regard in such a way to efficiently bring the text of interest into their area of preserved vision.
Another patient with an advanced central binocular defect (IVF MD=−9.9 dB), shown towards the bottom of the graph (Fig.3), had an average reading speed of 253 wpm. Scanpaths superimposed on one of the reading trials, and some of the LDT words for this patient, are shown in Fig.5.
Text saturation
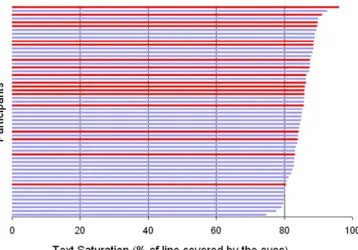
[image:9.595.173.541.267.708.2]Control subjects had a median text saturation of 84.1 % (interquartile range: 81.1–86.3 %), and this was significantly less than patients who had mediantext saturationof 86.7 % (interquartile range: 85.6–89.3) (Mann–Whitney test;P=0.004). The tendency for patients to saturate more of a line of text is illustrated in Fig. 6.
Fig. 4 aHFA Grayscales of patient VFs.bThe scanpath of the eye movements made during the presentation of some of the words during the LDT within the 1,000-ms censored time window. Each
dotshows the fixation and thered
connecting linesrefer to the
saccades made between these fixations.cThe scanpath of this patient during one trial of the reading experiment. Eachwhite
circlecorresponds to a fixation
location. Thesize of the circleis related to the fixation duration.
Thewhite linesrepresent the left
to right saccades, and thered lines
indicate regressive saccades (right to left). Saccades made between lines have been removed for visual clarity. The patient’s logMAR BVA was 0.18, and the number of errors made on the Burt test was 1. This patient is identified by theclosed symbol in
the upper left of the plotshown in
Fig.3
Graefes Arch Clin Exp Ophthalmol
Discussion
Patients with glaucoma commonly report problems with read-ing [1–5], and studies of actual reading performance have confirmed that glaucoma, especially when in an advanced stage, impacts on reading performance [9–11]. The patients in our study had advanced VF defects and were, therefore, similar to those previously characterized to have poorer read-ing performance when compared to age-similar controls [9]. Whilst perimetry can obviously identify patients with ad-vanced VF loss, it seems from our results to offer little value in further separating that patient group into those that have more or less efficient reading speeds (Fig.3). The results from our study have principally shown that eye movement
behaviour could explain some of the variability in reading speed in those patients with advanced glaucomatous VF loss. This study adds new knowledge because it is the first to consider eye movements in patients with glaucoma during a reading task. For example, a significant association between size of perceptual span and reading speed was observed. This was unsurprising, because measurements of the perceptual span impacting on reading have been well-documented [16,
[image:10.595.110.543.46.523.2]24], but it has not been demonstrated in patients with glauco-ma before. No significant group difference in the average size of the perceptual span was observed between patients and controls. However, the patient group made more saccades during the LDT than the controls. Moreover, a statistically significant association was also observed in the patient group
Fig. 5 aGrayscales of patient VFs.bThe scanpath of the eye movements made during the presentation of some of the words during the LDT during the 1,000-ms censored time window. Each
dotshows the fixation and the
green connecting linesrefer to the
saccades made between these fixations.cThe scanpath of this patient during the reading experiment. Eachwhite circle
corresponds to a fixation location. Thesize of the circleis related to the fixation duration. Thewhite linesrepresent the left to right saccades, and thered lines
indicate regressive saccades (right to left). Saccades made between lines have been removed for visual clarity. The patient’s logMAR BVA was 0.18, and the number of errors made on the Burt test was 1. This patient is identified by theclosed symbol towards the bottom of the plot
shown in Fig.3
Graefes Arch Clin Exp Ophthalmol
between this‘saccadic frequency’and reading speed, but not in controls. It is tempting to explain these results by suggest-ing that the patients, with their restricted VFs, exhibit addi-tional or compensatory saccades that impair reading speed, especially since this association was not seen in the control group during this task. The LDT required participants to read a single word as opposed to a string of sentences: syntactic (processes by which sentences are constructed) and semantic cues exist during the reading of sentences which do not exist during the presentation of an isolated word. These cues can be used to infer the meaning of the text at any given fixation, even when only part of a sentence is in view. Research has shown there are differences in the processing of words which are presented in context and in isolation [25,26], and context aids word recognition. These contextual cues in the reading experiment may aid reading comprehension and reduce the effect of the visual function differences between groups, hence why no measured difference in perceptual span made during the passages of text was observed. Conversely, during the presentation of a single word, as in the LDT, these linguistic factors cannot aid comprehension. Therefore, patients may have to make additional eye movements to process a word, explaining the average difference insaccadic frequency be-tween patients and controls. Postulating the significance of this result should be moderated by noting the limitations associated with our LDT experiment. It is possible that the reported relationship betweensaccadic frequencyand reading speed observed in the patient group could arise if the measure ofsaccadic frequencyis simply a surrogate measure for reac-tion time. Nevertheless, a 1,000 ms window was adopted to minimise the effect of slow processors. Furthermore, if this
relationship was due to processing time, it should have also been observed in the control group, and it was not.
A new eye movement measure, termedtext saturation, was considered to investigate if patient’s reading difficulties were due to an increased requirement to fixate on all the words in a line of text. There was a small but statistically significant average difference between patients and controls with this measure in our experiment. On average, patients needed to saturate each line of the text more than controls when reading the passages of text. The effect would certainly not be notice-able when reading short passages of large text as in our experiment. Still, an experiment monitoring eye movements during sustained reading over a longer period of time might illuminate this effect. Certainly, recent research efforts have demonstrated an increased fatigue and difficulty with sustained silent reading [11, 27], and in this instance our measure of text saturation may provide a plausible mecha-nism as to why some, but not all, patients with glaucoma exhibit slower reading speeds.
Our sample of patients did not have statistically significant slower average reading speed when compared to the age-similar control group. This might be regarded as an unexpect-ed finding, bearing in mind the nature of the advancunexpect-ed VF loss in the patient group, and previous research findings. Yet, one reason for this observation is that the reading tasks employed were of a short duration and text was presented on a computer screen, whereas previous studies used sustained periods of reading from a booklet [9,11]. Another explanation is that the text size used in the present study was quite large, in order to facilitate more precise eye movement measurement. More-over, all our glaucoma patients were deliberately chosen to
Fig. 6 A plot showing text saturation (expressed as the median percentage of a line covered) across controls and patients ranked in ascending order.Blue linesindicate controls,
andred linesindicate patients
Graefes Arch Clin Exp Ophthalmol
[image:11.595.183.542.50.300.2]have corrected binocular visual acuity of at least 0.18 logMAR (Snellen equivalent of 6/9) as measured using an ETDRS chart. These factors may have enabled patients and controls to read at comparable average rates. The rates are likely to diverge during the reading of smaller-sized text. Critically, our patient sample was small, and this study was not powered to detect differences in actual reading speed between groups.
There are several limitations associated with our study. First, it is difficult to be certain that visual and not cognitive factors are responsible for some of the results. Patients and controls did, however, perform similarly and well on the non-vision measures, with minimal between-person variability; noteworthy departures did not, for example, seem to impact on the associations as indicated on Figs.1and2. But MEAMS and the Burt Word Reading Test may not have been suffi-ciently sensitive to measure subtle cognitive and reading level differences. After all, the former is really only a screening test to detect gross cognitive impairment, and the Burt Word Reading Test is only a simple gauge of reading ability. Future studies assessing reading in glaucoma ought to more carefully match cases and controls by cognitive ability. Perhaps the study would also have benefited from a more formal assess-ment of comprehension, in order to reduce some of the vari-ability in our observed silent reading speeds [27]. Moreover, our sample of patients is unlikely to be representative of all patients with advanced VF loss in both eyes, since they have volunteered for a study where they knew reading performance would be assessed: poor readers may have been less likely to participate. This limitation to the study design might offer an explanation for the better or exceptional reading performance of some of the patients that took part. It is also worth noting that our univariable analyses did not adjust for level of edu-cation. Also, IVF measures, as used in this study, are disposed to bias in the absence of further binocular assessment; they can only be assumed to capture visual loss when looking straight ahead at a certain focal distance. Finally, we excluded patients with any ocular surface disease, but future studies ought to consider the influence of potential dry eye that might be induced by some glaucoma medi-cation on reading performance.
Plots of eye movement scanpaths made during these ex-periments were revealing (Figs.4and5). These examples hint at a possible mechanism whereby some patients with ad-vanced glaucomatous VF defects read as efficiently as nor-mally sighted peers. For example, eye tracking revealed idio-syncratic fixation behaviour in the patient depicted in Fig.4, who had fast reading speeds despite advanced VF loss. Sim-ilar observations are well-reported in patients with macular disease [28,29], where some patients develop a new preferred retinal locus over time, an eccentric retinal location which behaves as a pseudo fovea. The observation that some patients with advanced glaucomatous VF defects exhibit this adaptive
shift has not been reported previously. For now this remains an observation, but it illustrates the utility of eye tracking in studies of reading in glaucoma, and hints at the design of future studies.
Only a handful of studies have directly measured reading performance in glaucoma, and the present study represents a contribution to the understanding in this important area. This study has revealed a relationship between eye movement measures and reading speed in a group of patients with ad-vanced VF defects in both eyes. Evidence is presented that differences in eye movements might explain some of the large variability in reading rates exhibited by these patients, and may help provide a plausible mechanism as to why some, but not all, glaucoma patients have difficulties with reading. This study also adds to emerging evidence of eye movements being a useful way of understanding the functional consequence of glaucoma [30–33].
Acknowledgements The authors thank the following: Ryo Asaoka for help with patient recruitment and ophthalmic examinations, Fiona Glen for testing participants and data collection, David Garway-Heath for comments on aspects of the experimental design, and Iván Marín-Franch for plotting scanpaths and some discussion about the manuscript.
Support This study was conducted as part of a programme of work funded by the Investigator-Initiated Studies Programme of Merck Sharp & Dohme Ltd.
Conflict of interest DPC has previously received unrestricted research funding from Allergan, Pfizer, Merck, and honoraria for lecturing from Allergan and Merck.
References
1. Viswanathan AC, McNaught AI, Poinoosawmy D, Fontana L, Crabb DP, Fitzke FW, Hitchings RA (1999) Severity and stability of glau-coma: patient perception compared with objective measurement. Arch Ophthalmol 117:450–454
2. Aspinall PA, Johnson ZK, Azuara-Blanco A, Montarzino A, Brice R, Vickers A (2008) Evaluation of quality of life and priorities of patients with glaucoma. Invest Ophthalmol Vis Sci 49:1907–1915 3. Freeman EE, Muñoz B, West SK, Jampel HD, Friedman DS
(2008) Glaucoma and quality of life: the Salisbury Eye evalua-tion. Ophthalmology 115:233–238
4. Ramulu P (2009) Glaucoma and disability: which tasks are affected, and at what stage of disease? Curr Opin Ophthalmol 20:92–98 5. Crabb DP, Smith ND, Glen FC, Burton R, Garway-Heath DF (2013)
How does glaucoma look?: patient perception of visual field loss. Ophthalmology 120:1120–1126
6. Altangerel U, Spaeth GL, Steinmann WC (2006) Assessment of function related to vision (AFREV). Ophthalmic Epidemiol 13:67–80 7. Burton R, Crabb DP, Smith ND, Glen FC, Garway-Heath DF (2012) Glaucoma and reading: exploring the effects of contrast lowering of text. Optom Vis Sci 89:1282–1287
8. Fujita K, Yasuda N, Oda K, Yuzawa M (2006) Reading performance in patients with central visual field disturbance due to glaucoma. Nippon Ganka Gakkai Zasshi 110:914–918
Graefes Arch Clin Exp Ophthalmol
9. Ramulu PY, West SK, Munoz B, Jampel HD, Friedman DS (2009) Glaucoma and reading speed: the Salisbury Eye evaluation project. Arch Ophthalmol 127:82–87
10. Ishii M, Seki M, Harigai R, Abe H, Fukuchi T (2013) Reading performance in patients with glaucoma evaluated using the MNREAD charts. Jpn J Ophthalmol 57:471–474
11. Ramulu PY, Swenor BK, Jefferys JL, Friedman DS, Rubin GS (2013) Difficulty with out-loud and silent reading in glaucoma. Invest Ophthalmol Vis Sci 54:666–672
12. Rayner K (1998) Eye movements in reading and information pro-cessing: 20 years of research. Psychol Bull 124:372–422
13. McConkie GW, Rayner K (1975) The span of the effective stimulus during a fixation in reading. Percept Psychophys 17:578–586 14. Rubin GS, Turano K (1994) Low vision reading with sequential word
presentation. Vis Res 34:1723–1733
15. Crossland MD, Rubin GS (2006) Eye movements and reading in macular disease: further support for the shrinking perceptual span hypothesis. Vis Res 46:590–597
16. Bullimore MA, Bailey IL (1995) Reading and eye movements in age-related maculopathy. Optom Vis Sci Off Publ Am Acad Optom 72: 125–138
17. Susanna R Jr, Vessani RM (2009) Staging glaucoma patient: why and how? Open Ophthalmol J 3:59–64
18. Crabb DP, Viswanathan AC (2005) Integrated visual fields: a new approach to measuring the binocular field of view and visual disabil-ity. Graefes Arch Clin Exp Ophthalmol 243:210–216
19. Asaoka R, Crabb DP, Yamashita T, Russell RA, Wang YX, Garway-Heath DF (2011) Patients have two eyes!: binocular versus better eye visual field indices. Invest Ophthalmol Vis Sci 52:7007–7011 20. Flesch R (1948) A new readability yardstick. J Appl Psychol 32:
221–233
21. Husband HJ, Tarbuck AF (1994) Cognitive rating scales: a compar-ison of the mini-mental state examination and the Middlesex elderly assessment of mental state. Int J Geriatr Psychiatry 9:797–802
22. Kutlay S, Kuçukdeveci AA, Elhan AH, Yavuzer G, Tennant A (2007) Validation of the Middlesex elderly assessment of mental state (MEAMS) as a cognitive screening test in patients with acquired brain injury in Turkey. Disabil Rehabil 29:315–321
23. Thorpe WG (1976) The Burt word reading test. The Scottish Council for Research in Education, Edinburgh
24. Pollatsek A, Rayner K, Balota DA (1986) Inferences about eye movement control from the perceptual span in reading. Percept Psychophys 40:123–130
25. Nicholson T (1991) Do children read words better in context or in lists? a classic study revisited. J Educ Psychol 83:444–450 26. Martin-Chang S, Levesque K (2013) Taken out of context:
differen-tial processing in contextual and isolated word reading. J Res Read 36:330–349
27. Ramulu PY, Swenor BK, Jefferys JL, Rubin GS (2013) Description and validation of a test to evaluate sustained silent reading. Invest Ophthalmol Vis Sci 54:673–680
28. White JM, Bedell HE (1990) The oculomotor reference in humans with bilateral macular disease. Invest Ophthalmol Vis Sci 31: 1149–1161
29. Crossland MD, Culham LE, Kabanarou SA, Rubin GS (2005) Preferred retinal locus development in patients with macular disease. Ophthalmology 112:1579–1585
30. Smith ND, Crabb DP, Glen FC, Burton R, Garway-Heath DF (2012) Eye movements in patients with glaucoma when viewing images of everyday scenes. Seeing Perceiving 25:471–492
31. Smith ND, Glen FC, Crabb DP (2012) Eye movements during visual search in patients with glaucoma. BMC Ophthalmol 12:45 32. Glen FC, Smith ND, Crabb DP (2013) Saccadic eye movements and
face recognition performance in patients with central glaucomatous visual field defects. Vis Res 82:42–51
33. Lamirel C, Milea D, Cochereau I, Duong M-H, Lorenceau J (2012) Impaired saccadic Eye movement in primary open-angle glaucoma. J Glaucoma 23(1):23–32. doi:10.1097/IJG.0b013e31825c10dc
Graefes Arch Clin Exp Ophthalmol