Project no.:
608540
Project acronym:
GARPUR
Project full title:Generally Accepted Reliability Principle with
Uncertainty modelling and through probabilistic Risk assessment
Collaborative project
FP7-ENERGY-2013-1
Start date of project: 2013-09-01
Duration: 4 years
D4.1
Functional analysis of System Development process
Due delivery date: 2015-02-28
Actual delivery date: 2015-01-29
Organisation name of lead beneficiary for this deliverable:
Energinet.dk
Project co-funded by the European Commission within the Seventh Framework Programme (2007-2013) Dissemination Level
PU Public x
PP Restricted to other programme participants (including the Commission Services)
RE Restricted to a group specified by the consortium (including the Commission Services)
Deliverable number: D4.1
Deliverable short title: Functional analysis of system development
Deliverable title: A functional analysis of the System Development decision making process
Work package: WP4 System development
Lead participant: Energinet.dk
Revision Control
Date Revision Author(s) Comments
Quality Assurance, status of deliverable
Action Performed by Date
Verified (WP leader) Cindy Bastiaensen (ELIA) 2015-01-29
Approved (EB) EB members by e-mail 2015-02-20
Approved (Coordinator) Oddbjørn Gjerde (SINTEF) 2015-03-02
Submitted
Author(s) Name Organisation E-mail
Geir Brønmo Energinet.dk [email protected]
Arnaud Vergnol Elia [email protected]
Nenko Gamov ESO [email protected]
Waqquas Bukhsh Strathclyde [email protected]
Keith Bell Strathclyde [email protected]
Andrey Andreev ESO [email protected]
Venzislav Zahov ESO [email protected]
Table of Contents
Page
EXECUTIVE SUMMARY ... 7
1 INTRODUCTION ... 9
1.1 WP4 of GARPUR and its relationship with the rest of GARPUR ... 9
1.2 The Context of System Development ... 11
1.3 Scope of task 4.1 ... 12
1.4 Questionnaire ... 13
2 TERMS AND DEFINITIONS ... 15
3 OVERVIEW OF THE SYSTEM DEVELOPMENT DECISION MAKING PROCESS ... 18
3.1 Cross-TSO coordination ... 21
4 CONTINUOUSLY UPDATING DATA AND ASSUMPTIONS ... 22
4.1 Grid data update ... 22
4.2 Scenario building ... 22
4.2.1 External information ... 24
4.3 Historical data ... 24
4.4 Data sets ... 25
4.4.1 Grid model ... 25
4.4.2 Market modelling data ... 26
4.4.3 Interface between market modelling and grid modelling ... 27
4.4.4 Reliability data ... 27
5 INITIAL ASSESSMENT AND PRIORITISATION... 28
6 ASSESSMENT AND PROJECT PORTFOLIO MANAGEMENT ... 31
6.1 Market analysis ... 32
6.1.1 Economic indicators ... 32
6.2 Technical candidates... 33
6.3 Network analysis ... 33
6.3.1 Network model ... 35
6.3.2 Set of network planned outages ... 35
6.3.3 Steady State Analysis ... 35
6.3.4 Stability assessment ... 36
6.3.5 Design remedy ... 37
6.4 Electrical indicators ... 37
6.4.1 Improved Reliability (security) of supply ... 37
6.4.2 RES integration ... 38
6.4.3 Variation in losses ... 38
6.4.4 Variation in CO2 emissions ... 39
6.4.5 Technical resilience/system safety ... 39
6.5 Other assessments ... 39
6.5.2 Robustness/flexibility ... 39
6.5.3 Environmental and Social impacts ... 40
6.6 Project portfolio management ... 40
7 THE POTENTIAL BENEFITS OF PROBABILISTIC METHODS IN SYSTEM DEVELOPMENT PLANNING ... 41
7.1 Benefits in terms of more precise assessment of improved reliability of the system ... 41
7.2 Economic benefits of probabilistic reliability management ... 42
7.3 Expected impacts of GARPUR WP4 on system development process ... 43
7.4 Concluding remarks ... 45
8 REFERENCES ... 46
APPENDIX 1: QUESTIONNAIRE ... 47
APPENDIX 2: PRINCIPLES AFFECTING SYSTEM DEVELOPMENT ... 56
[image:6.595.38.517.89.312.2]Innovation - research questions ... 58
Table of Figures
Page Figure 1-1: WP4’s relationship with other WPs in GARPUR ... 10Figure 1-2: Activities of a TSO in different time-scales and their relationship... 11
Figure 1-3: The context of System Development ... 12
Figure 1-4: Answers to Q1: “Which of the following activities does your organisation address?” ... 14
Figure 3-1: Answers to Q53 concerning the main type of system development investments ... 18
Figure 3-2: Top level diagram of the long term decision making process ... 20
Figure 3-3: Answers to Q55 concerning the role of the regulator ... 21
Figure 4-1: A workflow diagram of the continuously updating data and assumptions process ... 22
Figure 4-2: Answers to Q59 about how renewables are taken into account ... 24
Figure 5-1: A workflow diagram of the Assessment and Prioritisation process ... 29
Figure 6-1: A workflow diagram of the Assessment and project portfolio management process ... 31
Figure 6-2: Answers to Q57 and Q58 about the type of analyses performed in order to support investments by TSO’s ... 32
Figure 6-3: A workflow diagram of the Network Analysis process ... 34
Figure 6-4: Answers to Q68 about the preventive and corrective actions taken into account for long term investment planning ... 36
[image:6.595.50.510.406.642.2]EXECUTIVE SUMMARY
This report gives a functional analysis of the current system development process among European TSOs. System development deals with taking decisions that change transmission capacities either within a TSO’s own system or towards other TSOs systems. Inputs to this report have been gathered from workshops in the GARPUR project and a questionnaire to 10 TSOs that are either part of GARPUR consortium or a member of GARPUR reference group. Despite the limited number of respondents to the questionnaire, the responses are quite representative for European practice since the respondents represent different system sizes, characteristics and control zones within Europe.
It is observed in the questionnaire that all the TSOs build, upgrade or replace new high voltage links and control devices. Further, eight out of ten TSOs work with re-configuration of their grids in terms of building sub-stations or tee points. Seven of the TSOs consider installing power flow control devices, while three TSOs see enhancing system controls as a system development task. Chapter 3 of this report gives an overview of how such investments are made through the system development process.
Data and assumptions are crucial to the system development process. Accurate data and realistic assumptions/expectations are a key to optimal decision-making. Chapter 4 of this report is dedicated to describing how to obtain data sets that could be used by a system development planner for further analysis.
An important element of the system development process is to identify and maintain ideas for future investment projects. This set of candidate projects is based on replacement needs, earlier project ideas and identified future needs. Chapter 5 of this report describes how these future needs are identified in an initial assessment process. The output of this process is a set of prioritized projects that are likely to be built in the future. Detailed assessment and decision making is analysed in Chapter 6.
1
INTRODUCTION
This document is a report from the work in GARPUR task 4.1: Functional workflow of the system development decision-making process. Inputs have been gathered from workshops in the GARPUR project and a questionnaire to 10 TSOS that are either a part of the GARPUR consortium or a member of the GARPUR reference group.
Since this report is a first deliverable by GARPUR WP4, in this chapter we shall briefly describe the context and scope of WP4 within the GARPUR project and also its relationship with other work packages. This report is divided into seven chapters. The first chapter sets the scene by introducing role of WP4 in the GARPUR project and defining the context of system development. In the second chapter we give basic vocabulary and definitions of the terms, while we give an overview of system development decision-making process in the third chapter. Chapter 4 gives the essential data and scenarios that are required for system development studies, Chapter 5 and 6 discuss the process of assessment, prioritization and arbitration. Chapter 7 concludes the report and gives some insights into how to improve the reliability management in the system development process, and gives an overview of what is missing in the current process for the TSOs to be prepared for probabilistic reliability management in the future.
1.1
WP4 of GARPUR and its relationship with the rest of GARPUR
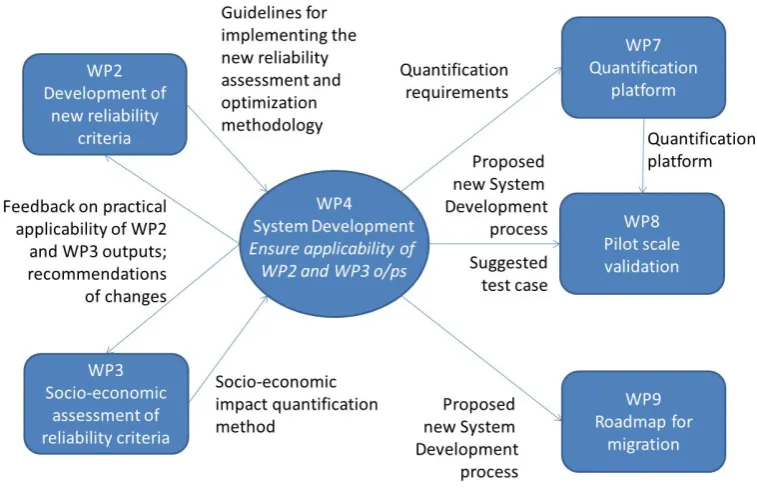
WP4 of GARPUR deals with the process of system development. Figure 1-1 gives an overview of the relationships of WP4 with WP2, WP3, WP7, WP8 and WP9. WP4 takes the reliability criteria, problem frameworks and optimization approaches proposed by WP2 and the socio-economic metrics and quantification approach proposed by WP3 into the context of the system development, and ensures the applicability of their outcomes. Main research focus of WP4 is system development and it takes input from WP2 and WP3 in terms of reliability criterion and socio-economic criteria. These inputs will be used in WP4 as part of the modelling and assessment in system development context. In addition, it develops additional specific methods required by the system development planner and feeds the findings back to WP2 and WP3.
Figure 1-1: WP4’s relationship with other WPs in GARPUR
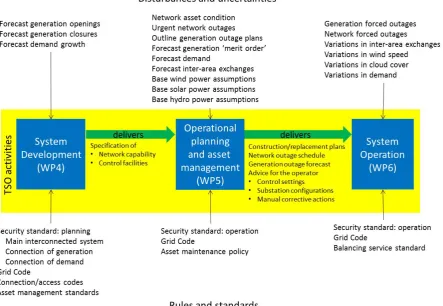
Figure 1-2: Activities of a TSO in different time-scales and their relationship
1.2
The Context of System Development
The general role of the system development planner is to ensure that sufficient facilities are installed on the system to enable it to be operated in accordance with relevant operating standards. In particular, the system development planner should ensure that the system’s capability to transfer power from producer to consumer is sufficient. Because any insufficiency may require investment in the network’s facilities and such investment takes time – relevant equipment and its location should be identified, the functional requirements specified, and the equipment procured, installed and commissioned – the system development process is commonly identified with timescales of a year or more ahead of real-time operation. Thus, the process of system development is often described as ‘long-term planning’. However, it may be possible for some equipment identified by the system development planner to be specified, approved and installed in less than a year. In addition, as noted by CIGRE Working Group C1.17, “The [system development] planner [is] responsible not only for providing network capacity but also for providing a system operator with the means of managing the consequences of N-1 violations or combinations of outage events.”
In respect of facilitating system operation in accordance with operating standards, two drivers may be noted:
1. Provision of power transfer capability such that the demand for electricity in a given area can be met with a given, minimum level of reliability, i.e. ‘reliability driven’ capability;
2. Provision of power transfer capability such that demand for electricity on the system can be met, over the medium to long term, in an economically efficient manner, i.e. ‘economics driven’ capability.
concerned with facilitation of competition. To the extent that a price can be put on an inability to utilize low carbon generation due to power transfer limitations, it can also be seen as concerned with carbon reduction.
For the avoidance of doubt, the second of the above drivers is regarded as being a legitimate, indeed fundamental, concern of system development planning and is within the scope of WP4.
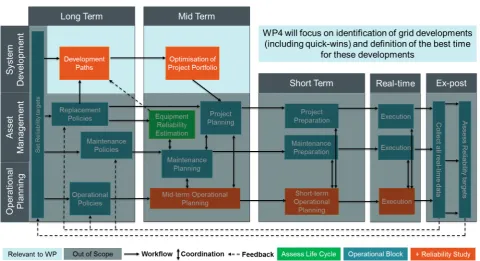
[image:12.595.51.495.314.620.2]The context of the System Development activity in relation to Asset Management and System Operation activities and how they are addressed in the GARPUR project may be viewed as shown in Figure 1-3. In practice, however, as will be discussed later in this document, although the process or task of System Development can be defined quite generally, individual companies’ particular organizational structures might dictate that some aspects of ensuring that adequate facilities are installed on the system are carried out by groups other than that with the name of ‘system development’, ‘system planning’, ‘long-term planning’ or ‘investment planning’.
Figure 1-3: The context of System Development
1.3
Scope of task 4.1
The GARPUR Description of Work (DOW) notes the following in respect of Task 4.1 and its output as Deliverable 4.1:
received from WP1. This workflow identifies the different data sets used, as well as the different types of decisions to be taken in the long-term. It explicitly shows the relations between the system development decisions taken in the long-term and those taken in the context of asset management (WP5) and system operation (WP6). It also highlights the possibilities and/or needs for horizontal coordination of system development decision-making in a multi-area/multi-TSO setting in view of the future practical integration of new reliability management approaches.
The result of T4.1 is delivered to WP7 to validate the functional specification of the quantification platform.
The main focus of the overview delivered by Task 4.1 should be to show how the future function of the power system is assured by TSOs today: Which decisions are made in respect of the provision of new network assets to enhance system power transfer capability? How are these decisions taken and how is the reliability taken into account? In addition, because the system development planner should also take account of economics, how is the cost-effectiveness of proposed investments identified?
Typically, TSOs use a quite detailed model of their own grid, and a certain set of situations (Generation, demand and import/export) to get a picture of how a particular investment option would influence the reliability of their grid or the facilitation of the electricity market. In order to generate realistic market scenarios for the future, the TSOs need to make some assumptions and forecasts for the future, such as generation mix and demand growth, as well as the spatial and geographical distribution of the demand. Another interesting topic in this setting is how the renewable generation patterns are modelled and generated.
The responses to the questionnaire submitted to TSOs in WP1 serve as a basis for the establishment of a functional workflow of system development activities. A need for a new questionnaire has nonetheless been identified during the WP4-5-6 kick-off meeting to gather more precise and specific information on the current practices of the TSOs.
1.4
Questionnaire
The main source of input to this report is discussions within the GARPUR WP4, 5 and 6 and a questionnaire to the TSO partners and members of the reference group of GARPUR. This questionnaire is a common questionnaire between WP4, 5 and 6 so only a subset of the questions is relevant for this report. This paragraph gives a short introduction to the questionnaire, and the answers to various questions will be reported and used where relevant in the following chapters. The questionnaire can be found in Appendix 1.
Figure 1-4: Answers to Q1: “Which of the following activities does your organisation address?”
The answers to this first question underlines that all the TSOs deal with transmission investment, construction, maintenance, outage planning ad operation. 3 out of 10 are involved with generation planning. Among other activities, control area balancing, tradable capacity allocation and photovoltaic prediction are mentioned.
In the questionnaire the TSOs were asked to which degree their grid is connected with other TSOs’ grids measured as transmission capacity relative to peak demand (Q2). The answer shows that TSOs normally have 10-30% transmission capacity with other TSOs, while some TSO answers were in the range of 0 and 150%. This large amount of variation depends how an individual transmission system has evolved over the past, but nonetheless study of connections between TSO is in the scope of the system development process. Furthermore, the TSOs were asked about the share of renewable in their systems (Q3). Also here the spread is large. When all types of renewable are included the share of renewable vs peak load varies from 1 to 100%, and for wind and solar only the span is from 0 to 70%.
2
TERMS AND DEFINITIONS
The majority of the definitions below are taken from GARPUR D2.1 [7]. The other terms were not defined in D2.1; definitions are proposed below. The exceptions are “long-term planning”, “mid-term planning” and “short-term planning” which were defined in D2.1 but are re-defined below.
Assessment: To determine whether a power system in its normal state is able to operate normally under a given criteria of assessment.
Asset management: Systematic and coordinated activities and practices through which an organization optimally manages its physical assets and their associated performance, risks and expenditures over their lifecycles for the purpose of achieving its organizational strategic plan.
Automatic system protection scheme: Automatic procedures used to protect the system; e.g. planned automatic under-frequency or under-voltage load shedding and HVDC link emergency power control.
Candidate decision: An alternative that can be selected by means of reliability management in a given context.
Corrective operation: In the real-time context, corrective operation concerns the application of post-contingency actions, in the aftermath of specific contingencies.
Common cause failure: A common cause failure is defined as a failure in which two or more component fault states exist simultaneously, or within a short time interval, and are a direct result of a shared cause.
Contingency: A contingency is the unexpected failure or outage of a system component, such as a generator, transmission line, circuit breaker, switch, or other electrical element. A contingency may also include multiple components, which are related by situations leading to simultaneous component outages.
Connection Point: A connection point is the interface point at which the power generating module, demand facility, distribution network or HVDC System is connected to a transmission network, offshore network, distribution network, or HVDC System.
Control area: For the purposes of power system reliability management the pan-European electric power system is divided into several parts, denoted as control areas. Within each control area, reliability management is the responsibility of the respective TSO. A control area can be formally defined as a coherent part of an interconnected system, controlled by a single TSO.
Criticality: Criticality refers to the extent of the consequences to the users of the infrastructure when a system does not carry out its intended function. The criticality describes how severe the consequences are for users who are dependent on the system.
Long-term planning: Long-term planning covers activities in the long-term time horizon, i.e. from a year ahead to 10 years or more ahead of real-time. Activities covered in that horizon include system development, planning of asset replacement and setting of asset policy, e.g. maintenance policy and standard equipment specifications. Asset replacement planning and maintenance policy may be regarded as aspects of asset management. It is recalled that WP4 of GARPUR is concerned with system development and WP5 is concerned with asset management. Furthermore, it may be noted that, in respect of many TSOs’ business processes, the activities of system development and asset management interact, e.g. where the particular option adopted for enhancement of system capability is informed by the need to replace certain assets.
new facilities with relatively short specification, procurement, construction and commissioning timescales, i.e. system development; and operational planning.
Operational planning: Operational planning is the group of reliability management activities linked to system optimization occurring ahead of real-time operation, within the short-term and mid-term horizons.
Post-contingency action: A real-time operation reliability management action that is identified (and scheduled) in advance, to be applied following the realization of a specific contingency.
Power system adequacy: The ability of the system to supply the aggregate electric power and energy requirements of the customers at all times, taking into account scheduled and unscheduled outages of the system components.
Power system planning: the identification and implementation of actions to enable future operation of the system in accordance with appropriate system operation rules or conventions.
Power system reliability: is the probability that an electric power system can perform a required function under given conditions for a given time interval. Reliability quantifies the ability of an electric power system to supply adequate electric service on a nearly continuous basis with few interruptions over an extended period of time. Power system reliability can be sub-divided into security and adequacy.
Power system security: Security of a power system refers to the degree of risk in its ability to survive imminent disturbances (contingencies) without interruption of customer service. It relates to robustness of the system to imminent disturbances and, hence, depends on the system operating condition as well as the contingent probability of disturbances. Security is the ability of the power system to withstand sudden disturbances such as short circuits or un-anticipated loss of system components. Another aspect of security is system integrity, which is the ability to maintain interconnected operations. Integrity relates to the preservation of interconnected system operation, or the avoidance of uncontrolled separation, in the presence of specified severe disturbances.
Pre-contingency action: A real-time operation reliability management action that is applied before the realization of a contingency.
Preventive operation: In the real-time context, preventive operation concerns the potential application of pre-contingency actions to achieve security and improve the ability to withstand the possible effects of potential contingencies.
Real-time operation: Real-time operation is exercised within recurring time intervals, beginning with a regular update on the system operating conditions. The duration of these intervals (typically in the range of 15–60 minutes) is such that the system operating conditions can be assumed to be relatively predictable, unless a contingency happens. Real-time operation includes preventive, corrective and emergency operation.
Reliability criterion: A reliability criterion is a principle imposing a standard to determine whether or not the reliability level of a power system is acceptable.
Reliability indicator: A reliability indicator is an observable or computable quantity that provides insight into the level of reliability of a system in a particular context. It can be used, ex-ante, to formulate a
reliability criterion used for reliability management or alternatively to assess, ex-post, the reliability level of a system. Note 1: a reliability indicator is a measure of reliability. Note 2: a reliability indicator is a value, for example the number of interruptions.
Scenario analysis: a process of analysing possible future events, like demand and generation changes. The process of system development starts with the scenario building process and the outcome of the models are highly dependent on such scenarios.
Set of candidate decisions : A set of candidate decisions is an exhaustive set of all distinctive alternatives that can be selected in a given context. Alternatives within this set correspond to the application of available actions as well as to the application of no action.
Short-term horizon: The short-term horizon is considered to start from several months ahead of-real time and last throughout the real-time moment of system operation. It includes operational planning and some aspects of asset management.
System development: the enhancement, through provision of new facilities on the system, of the system’s power transfer capability.
System operating condition: A system operating condition is a particular realization of generation and demand levels, as well as flows between interconnected control areas and network configuration.
Technical Candidate: A technical candidate is a candidate decision in the system development context. It is a feasible solution that is assumed to satisfy economic and reliability constraints to enhancing the power system transmission capacity.
Vulnerability: Vulnerability is an internal characteristic of the system and it relates to the inability of a system to perform a required function due to the realization of a threat. More specifically, a system that is likely to fail to carry out its intended function, has problems recovering to normal function or its capacity is significantly reduced upon realization of a threat is vulnerable to the said threat.
3
OVERVIEW OF THE SYSTEM DEVELOPMENT DECISION MAKING PROCESS
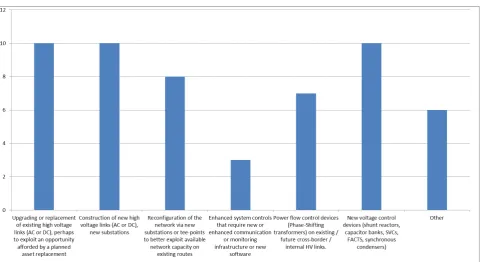
System development deals with taking decisions that change transmission capacities either within a TSO’s own system or towards other TSOs systems1. Figure 3-1 shows an overview of the type of system
development decisions that are made at the TSO respondents. From the figure it can be seen that all the TSOs build, upgrade or replace new high voltage links and control devices. Further, eight out of ten TSOs work with re-configuration of their grids in terms of building sub-stations or tee points and seven consider installing power flow control devices, while three TSOs see enhancing system controls as a system development task.
[image:18.595.44.525.325.587.2]Other system development activities mentioned by the TSOs are typically making or contributing to studies that analyses the future needs of the system (their own or a more regional system) rather than analysing single investment projects. One well known example of such a study is the Ten Year Network Development Plan study of ENTSO-e. Other examples can be internal grid development plans or maintenance and replacement strategies. Outcomes of such studies will typically be a number of candidate investment projects to be more carefully studied in the future.
Figure 3-1: Answers to Q53 concerning the main type of system development investments
The TSOs were asked to give an explanation of their system development planning process (Q54). As this was an open question, naturally the answers differed quite much. The TSOs more or less divided themselves into two groups. In the one group each TSO focused on the process of supporting the decision of one single transmission investment project, spanning from idea via market-, grid- and investment cost assessment to the decision and approval at the executive board or regulator and transfer to building stage. The other group of TSOs focused more on the total needs for grid development in the future of, say, 10 years ahead and analysing what the total need for investments would be with some concrete
1 It should be noted that in some countries, other bodies than the TSOs make investments in the transmission grid.
project proposals as the output of the process. The two groups do not necessarily differ in their overall system development process; they have chosen different parts of the process to describe here. In this report, both views of the overall system development process will be represented.
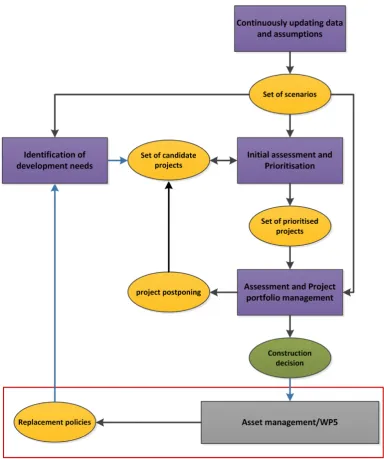
Figure 3-2 shows a diagram of the overall system development process. The diagram is based on discussions with GARPUR WP4, 5 and 6 at a workshop in Reykjavik in September 2014, inputs from the questionnaire and discussions in the task 4.1 working group. The result is reviewed by the TSO partners of the GARPUR project. The figure highlights the most important processes in system development at the TSOs.
At the top of the figure we have the “continuously updating data and assumptions” process, which is an essential part of system development. Detailed modelling of the system is a key to realistic assessment and optimal decision making. This process takes both internal and external information as input synthesising historical patterns and making assumptions for future development into one single or a set of scenarios against which candidate projects will be evaluated.
“Identification of development needs” is not necessarily a formalized process at the TSOs, but nonetheless it is quite important, since this is the place where ideas for future investment projects are generated. This can be based upon needs observed in earlier rounds of the general or specific assessment processes described below, but also triggered by re-investment needs or technology development in the industry opening new windows of opportunity. The output of this process is a continuously updated set of investment candidates ready for further assessments.
In the ”initial assessment and prioritisation phase”, a general appraisal of possible future network problems and needs for modifications of power transfer capabilities is carried out, starting with a set of candidate investment projects to be assessed. The output of the process is an updated set of candidate projects including new project candidates identified in the process. The set of candidates will now be a priority ordered list of projects to be assessed in more detail in the next stage of the system development process. Some TSOs have a formalized process for this, making a future grid development plan. The output of this process is a set of projects that are likely to be built in the future.
The prioritised projects are not really decided yet. This final decision requires more detailed studies that take one or a small group of projects and the set of scenarios as an input and make assessment of them upon the set of scenarios in the “assessment and project portfolio management” process. The assessment performed here is different in the sense that a more detailed design and hence costing of the technical solutions, synergies with asset replacement needs and more detailed analyses of risks and crucial assumptions can be made. If the projects perform well in this assessment process, and the indicators satisfy the investment criteria, the construction decision is made (by the board or the regulator) and the projects are transferred to the building stage. If not, the projects are retained, but might still be prioritised and decided at a later stage.
Figure 3-2: Top level diagram of the long term decision making process
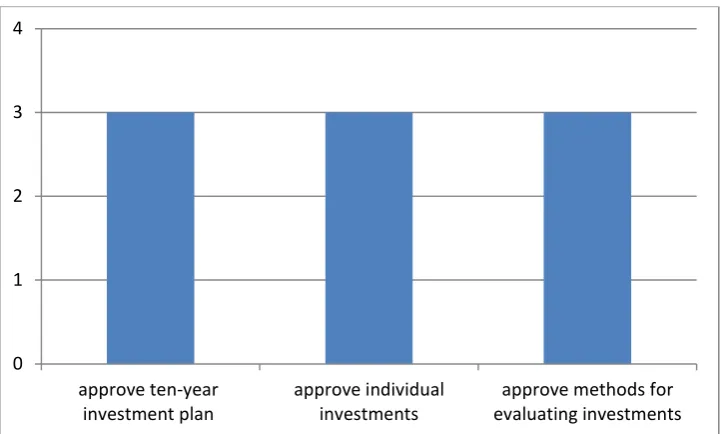
Figure 3-3: Answers to Q55 concerning the role of the regulator
3.1
Cross-TSO coordination
There is an obvious need for TSOs to communicate and cooperate with each other during the system development decision making process, especially for transmission lines that cross the boundary between two TSOs, where both TSOs need to accept a potential investment project before it can be commenced. For such projects many of the steps shown in Figure 3-2 must be performed in common between the concerned TSOs in order to reach an agreement.
Additionally there is a need for coordination in the data and assumptions process between neighbouring TSOs, since this can be crucial for the accuracy of assessments and portfolio management process. Further, the TSOs in Europe cooperate in making the ENTSO-E TYNDP [5], which can be seen as an early version of the initial assessment and prioritisation process for the whole group of European TSOs.
0 1 2 3 4
approve ten-year
4
CONTINUOUSLY UPDATING DATA AND ASSUMPTIONS
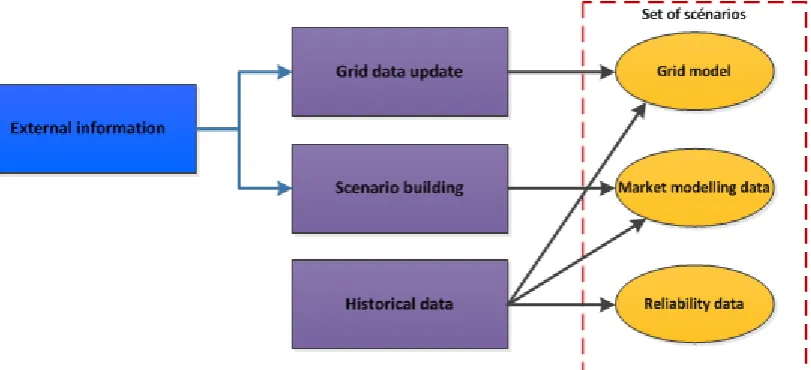
[image:22.595.53.459.197.382.2]Data and assumptions are crucial to the system development process. Data sets based on historical patterns and assumptions for the future are necessary elements in all assessments of investment projects. This chapter deals with the processes that creates new and continuously updates data sets used for system development decision making. Figure 4-1 shows a workflow diagram of the process.
Figure 4-1: A workflow diagram of the continuously updating data and assumptions process
The figure shows the process of maintaining three types of data that enables TSOs to perform system development investments: Grid models, market modelling data and reliability data. TSOs maintain these data sets and assumptions about the anticipated future for their own transmission grid. A grid data update is performed when new construction decisions are made and new candidate investment projects are found. Data are also updated when new information about external factors such as neighbouring grids, generators or distribution grids is available. The scenario building deals with information about generators and the economical surroundings of the power system to synthesise market modelling data and load and generator data to the grid model. Finally, historical data are used to synthesize load and generation patterns and probabilistic data. These processes are dealt with in detail in the subsections that follow.
4.1
Grid data update
The “Grid data update” process is central to any TSO. The grid model contains details of the power transmission grid that a TSO owns and operates. It contains information about the current grid and information and assumptions for future grids. At any time the construction of a new piece of transmission equipment is decided, the grid data has to be updated. And from time to time new assumptions for the future grid are established, and the future grid model needs to be updated. For details on the grid model see section 4.4.1.
4.2
Scenario building
of their analyses (Q70). All TSOs stated that they do analyses of the system 10 to 20 years into the future, and five of the TSOs even state that they do shorter term analyses around 5 years ahead in time
The grid data is not enough. The TSO also needs detailed information about the generators and loads that are connected to their system as well as information and assumptions for neighbouring grids. For the future it is needed to answer questions like: “How will the load develop?”, “How will the economy for the generators be?” and as a consequence “what type of generation will there be in our system in the future?” Finding answers to these questions is called scenario building and aims at giving concrete images of the future power system in one “best guess” and/or acknowledging the uncertainties of the future in a set of scenarios. Together with the scenarios for its own system, similar information about neighbouring systems and assumptions about transmission capacities between the systems can be used in market models to predict the future prices and flows in the power market. Data about generators and load forecasts are needed both in the market modelling data and the grid model. A well-known example of actual scenarios is the four ENTSO-E visions of the future [6].
To build scenarios the TSO needs to collect external information from a number of sources. The most important sources are:
- Renewable energy ambitions and actual and future policies. Makes the TSO able to forecast the renewables share in the future, which is one of the main drivers for grid development.
- Economic growth and energy savings forecasts. This is very important inputs to making a reasonable forecast for the load growth, which is one of the main drivers for grid development - Local demand and generation forecasts. DSOs have more information about the particular
developments in their areas. This is valuable information for TSOs when distributing demand and small scale generation assumptions between the nodes of the transmission system in their grid model.
- Investment in or decommissioning of generation capacity. After the deregulation of the power sector in many European countries, this has become an external factor to the TSO’s.
- Fuel prices and CO2 emission prices. Together with generation and demand forecasts this is important input into making dispatch scenarios and price forecasts for the future.
- Development of neighbouring power systems, including grid, generation and load assumptions.
Depending of the degree of interconnection with neighbouring systems this might be crucial input to making realistic dispatch scenarios. Here there is a need for cross-TSO coordination to agree on common images of the future power system.
Due to the many uncertain external factors and general uncertainty of the future, it is a good idea to have several scenarios of the future when you do analyses of long-term investments. Each scenario is a set of assumptions for the future containing specific values for uncertain parameters. From one scenario to another all the uncertain parameters change values. This way an even small number of scenarios span a potentially large part of the future space of uncertain parameters. An alternative way of handling uncertainty is by using sensitivity analysis, where typically one or a small set of uncertain parameters are changed while the rest of the parameters are fixed.
4.2.1 External information
In order to investigate the level of coordination between the TSOs answering the questionnaire, they were asked about the geographical scope of their analyses (Q71), and they were asked to separate between multi-TSO investments and internal investments as well as the type of analysis being performed. The answers show that nine out of ten TSOs take several TSOs areas into account when performing between-TSO market analyses. A few TSOs model the whole of Europe while the others have a reduced number of countries included in their data sets. The geographical scope is reduced when analysing internal investments and even further when performing load-flow and dynamic analyses.
4.3
Historical data
Historical data is needed to predict future patterns of demand and wind and solar power generation as well as the distribution of load between load points. Finally another kind of historical data is needed to estimate probabilistic data for potential faults in the power system.
[image:24.595.47.524.378.599.2]The TSOs were asked how renewables are taken into account in the various types of assessments that they make in the system development process. Further, they were asked to separate between investments that increase the transmission capacity between market areas and intra-area investments. The answers are summarized in Figure 4-2.
Figure 4-2: Answers to Q59 about how renewables are taken into account
4.4
Data sets
The final set of scenarios include up to three types of data sets. The Grid data are used for network analyses and reliability analyses, while the market modelling data are used for both market and network analyses. Some of the TSOs perform probabilistic reliability analyses, and they need a set of reliability data for that.
4.4.1 Grid model
The grid model contains the information necessary to perform static and dynamic grid studies. A detailed description can be found in [1]. As a minimum, the grid model typically contains the following information:
• Positive phase sequence impedances, shunt susceptances and continuous thermal ratings of each network branch.
• Information regarding the nodal connections of each branch.
• Transformer tap ranges and whether taps positions are determined by automatic voltage control or manual setting.
• The nodal location and maximum active power capability and maximum and minimum reactive power capability for each generating unit.
• The nodal location and susceptance of capacitor banks.
• The nodal location and susceptance of shunt reactors.
• The locations and characteristics of phase shifting transformers and any FACTS devices.
• The nodal location and the magnitude of active and reactive power demands, at least at time of system peak demand.
• Configuration and specifics of DC links.
In addition, if stability assessments are to be carried out, the following are required:
• Generating unit dynamic electrical parameters.
• Generating unit governor, excitation system, AVR and PSS characteristics.
• Prime mover models appropriate for use in power system stability assessments.
• Wind turbine main electrical dynamic characteristics and controls.
• Voltage and frequency dependency of loads.
• Special protection schemes and coordinated control schemes.
The following information is required if busbar reconfiguration is commonly carried out:
• The layout of substations such that node/branch connectivity can be revised appropriately to represent running arrangements under different conditions.
The following is required if short circuit level assessments are to be carried out:
• Negative and zero phase sequence network characteristics.
• Any assumptions regarding X/R ratios for decay of the DC component of switching transients.
• Circuit breaker ratings.
If operational situations other than the system peak demand are to be assessed, time series of nodal demand data should be provided along seasonal and diurnal dependencies of available generation, in particular in respect of renewables. Rules should be provided allowing the synthesis of credible patterns of planned outages in off-peak cases.
Finally a representation of neighbouring grids may be crucial to the correctness of analyses upon the TSO’s own grid. This representation could take many forms, from simple equivalents to full representations with many of the aspects mentioned above included.
4.4.2 Market modelling data
The following is required if credible dispatches of generation are to be synthesised and the likely market behaviour assessed:
• Relative prices of generating units.
• Rules and data that allow credible situations to be synthesised regarding the availability of power from wind, solar and hydro power.
• Spinning reserve requirements.
• The availability, size and location of demand response.
At present, system development planners in many countries do not typically postulate generation dispatches in such a way as to take into account limits to operation of generators such as start-up times, min on and off times, ramp rates, ramp profile on start up. However, if they are to do that, such information should be made available.
If emissions are to be quantified, generator emissions characteristics should be provided.
The following further generation information should be provided:
• Bidding zone.
• Fuel type.
• Efficiency.
• For instance for Hydro: Special characteristics such as inflow and reservoir limits.
• Must run profiles.
• CHP generation profiles. Loads
• Load per bidding zone/price areas.
• Load patterns (load per hour of the year).
In the market modelling data there is a substantial need for representing neighbouring systems. Typically all the aspects mentioned above are needed for external systems as well; however more aggregate data than for the TSOs own system can be acceptable.
Finally there are some market modelling data that are (typically) not price area specific:
Transmission lines:
• Only between bidding zones/price areas.
• GTC (Grid Transfer Capacity).
4.4.3 Interface between market modelling and grid modelling
With market modelling the TSO can forecast future market dispatch, more specifically generating prices, flows and dispatch for a large number of situations, typically covering one year of hour-by-hour simulation. This generates a big span of market situations that are likely to occur during normal circumstances. The power grid should be able to cope with all these situations under the given reliability management scheme, which is currently the deterministic N-1 criterion, see [2]. The TSOs were asked whether they use market modelling results, worst case dispatch scenarios (pre-defined snapshots) or something in between for their grid studies (Q63). The results can be summarised as follows:
Market situation for grid studies:
Inter-area investments.
Two TSO’s use a full range of situations from market model runs.
One TSO uses both approaches depending on the analysis at hand.
The rest use snapshots.
Some use pre-defined snapshots.
Others use some screening method to select scenarios from a market model run.
DC load flow for screening.
AC load flow upon snapshots.
Intra-area investments.
All TSOs except one use snapshots, typically based on market modelling runs.
These results indicate that the TSOs are and have already been developing their tools and methods, so that many different scenarios are considered instead of worst case analyses. This can be interpreted as a small step towards using more probabilistic approaches, or at least acknowledging the potential excess cost of analysing worst case scenarios only.
4.4.4 Reliability data
5
INITIAL ASSESSMENT AND PRIORITISATION
A fundamental question for a TSO in terms of system development is “What are the future needs of my power system?” This is a question the TSO can start answering when the scenarios for the future are built and the data sets are updated. This question can be answered in many ways, but it in order to get good answers, performing analyses is necessary.
The TYNDP of ENTSO-e [5] can be interpreted as an attempt to answer this question from a European perspective. In the TYNDP there are both pan-European and regional market and grid studies leading to a non-binding overview of beneficial transmission investment projects from a European and regional point of view. If nothing else was done, this process could serve as an initial assessment for a TSOs system development processes.
In the questionnaire, the TSOs were asked what influence the ENTSO-e TYNDP has on their system development decisions (Q56), and, since it is non-binding, only two out of ten TSOs claim that it has a direct influence on their process. For the majority of the other TSOs it has an impact, either as a basis for their own analyses, or as a second opinion upon analyses they have already done themselves or bilaterally with other TSOs. Two of the TSOs claim that the TYNDP has either little or no influence upon their system development decisions.
It is neither precisely nor completely covered by the questionnaire, but however, four of the TSOs describe that they regularly make their own grid development plan that shall be approved either by the regulator or the government. Making such a plan serves as an initial assessment for the further system development process.
Figure 5-1: A workflow diagram of the Assessment and Prioritisation process
In the grid assessment part of the process, technical methods and criteria are used when assessing the planning scenarios, in order to identify future problems and determine the required development of the transmission grid. These needs are determined by comparing the results of the steady state analysis, fault level assessment and stability assessment with the criteria for assessing consequences. This means that new projects might also be conceived during this phase, if the set of candidate projects cannot satisfy the future needs of the power system.
6
ASSESSMENT AND PROJECT PORTFOLIO MANAGEMENT
[image:31.595.82.549.181.671.2]The “Assessment and Project portfolio management” process is described by the detailed work flow diagram below in Figure 6-1. The goal of this process is to assess the impact of prioritised projects in terms of added value for society, in terms of costs and to check whether technical criteria are met.
Figure 6-1: A workflow diagram of the Assessment and project portfolio management process
Figure 6-2 shows the type of analyses performed by TSO’s in the system development context.
Figure 6-2: Answers to Q57 and Q58 about the type of analyses performed in order to support investments by TSO’s
The individual boxes of the workflow diagram are discussed in more detail in the following paragraphs.
6.1
Market analysis
Market modelling takes one or more future scenarios as input while the output is the forecast of future market dispatch, more specifically generating prices, flows between market areas and generation dispatch for a large number of situations, typically covering one year of hour-by-hour simulation. Market analysis is typically used for estimating the economic impact of projects increasing the transmission capacity between two market areas.
Prices, dispatch and flows are estimated for the case with and without the investment at stake, and from these the economic indicators for the investment project can be calculated. In the questionnaire, the TSOs were asked about how the result of market analysis is included in investment decisions (Q60). The answer shows that for investment between market areas, the result of market analysis is used by most of the TSOs. Some of the TSOs use national trade benefits while others look at regional benefits. At the national level, several TSOs indicate that congestion costs are used for investment decisions.
6.1.1 Economic indicators
Socio-economic welfare (SEW) from market integration is characterised by the ability of a power system to reduce congestion and thus provide an adequate transmission capacity so that electricity markets can trade power in an economically efficient manner.
The new transmission capacity reduces the total cost of electricity supply, since it allows generators in the lower-priced area to export more power to the higher-priced (import) area.
In general, two different approaches can be used for calculating the increased benefit from socio- economic welfare:
• The total surplus approach, which compares the producer and consumer surpluses for each bidding area, as well as the congestion rent between them, with and without the technical candidates. This is needed to calculate the distribution of the socio economic welfare between market areas and the different segments of each market area.
6.2
Technical candidates
A transmission system investment project comes out of a future need for increased transmission capacity within a certain area or between two areas. This can be solved in several ways by different technical candidates. A technical candidate is a concrete solution to a given project enhancing the power system transmission capacity of the grid. In link with Figure 3-1, this is the list of elements that may be part of technical candidates:
• New circuits, circuit uprating, reactive compensation, new controls (Results for Steady state analysis).
• Replace over-stressed equipment, add series reactor or reconfigure network (go back to planned outages) (Results from Fault level assessment).
• Reduce system impedance, modify generator controls, install SPS or re-dispatch generation (Results from Stability assessment).
• If the standards described previously are not met, then reinforcement of the grid is planned. These measures can include the following ([3] or [4]):
o Reinforcement of overhead circuits to increase their capacity (e.g. increased distance to ground, replacing of circuits,).
o Replacement of network equipment or reinforcement of substations (e.g. based on short-circuit rating).
o Extension of substations and construction of new ones.
o Installation of reactive-power compensation equipment (e.g. capacitor banks).
o Adding of network equipment to control the active power flow (e.g. phase shifter, series compensation devices).
o Additional transformer capacities.
o Construction of new circuits (overhead and cable).
o Prioritization criteria are used to decide between different solutions that solve the same problem.
Additionally, TSOs follow research and development of new technologies closely, and should always consider whether or not new solutions should be included in the design of technical candidates.
6.3
Network analysis
Figure 6-3: A workflow diagram of the Network Analysis process
The main aim of network analysis is to verify that the technical candidates meet the technical criteria, such as the N-1 criterion. In [2] it is shown that the N-1 criterion is the current reliability management scheme among the TSOs and that it is used in all time horizons. Hence, by imposing the N-1 criterion in the network analyses part of the system development process, the TSOs make sure that the reliability management scheme is coherent across time horizons and that their grids can be operated in the future.
Another purpose is to quantify the different projects with electrical indicators. The various elements of Figure 6-3 will be explained in the following subsections.
6.3.1 Network model
The network model depends of:
• Geographical scope,
• Type of situations,
• Parameters of committed network,
• Generation initial condition,
• Demand conditions,
• Neighbouring system initial condition.
This information was discussed in “Continuously updating data and assumptions” (Chapter 4)
6.3.2 Set of network planned outages
In the current System Development context, planned outages are generally not directly taken into account (Q65). One exceptional TSO states that it uses an N-1-1 criterion that makes the grid ready for maintenance of any major component at any time. Another TSO states that it makes an N-2 assessment in the highest voltage level, but for off-peak periods of the year, to check if maintenance is possible.
In planning, the N-1 criterion is systematically applied without prioritizing between electrical contingencies with different probabilities or consequences. In particular cases, the N-1 criterion is extended to N-2 criterion. Following the TSO’s, the N-2 can be considered as:
• Two similar elements: Example: Line-/line to simulate a tower failure2 or;
• Electrical element and a generator in the area to simulate the planned outage of generator.
6.3.3 Steady State Analysis
The Steady State Analysis is generally composed of three studies:
• Load flow analysis (AC or DC),
• Short circuit analysis.
• Voltage study.
The load flow analysis examines the situation in N and normal contingencies (N-1) and rare contingencies (N-2, tower failure…). During the contingencies studies, protection schemes have to be taken into account when defining which elements are to be disconnected during each contingency.
In the system development context, preventive or corrective actions can be taken into account in load flow analysis. The Figure 6-4 lists the different types of actions. Nevertheless, the analysis of the different remarks or comments of TSO’s on the Q68 reveal that only major actions are taken into account in load flow analysis and while minor actions are evaluated for specific outages. Further, the TSOs were asked how they take reserves into account in the load flow calculation (Q64), but this is clearly not a big issue among the TSOs. Only three out of ten TSOs state that they take reserves into consideration.
2 In Britain, a single event leading to both circuits of a double circuit going out of service is referred to as an ‘N-D’
Figure 6-4: Answers to Q68 about the preventive and corrective actions taken into account for long term investment planning
The short circuit analysis evaluates the maximum and minimum symmetrical and single-phase short circuit currents in every node of the grid.
In a voltage study, it is checked whether the voltage on all busbars of the system remain inside the acceptable zone in N and N-1, taking into account the available resources to adjust the Mvar production / consumption level and the possibilities of regulating transformers.
The steady state analysis in the base case allows defining the needs of the network in terms of overload, over or under voltages and too high short circuit level. The base case is an expected case using the assumptions that TSO deems most likely to occur, without the technical candidate. Assessments on the technical candidate are then used for comparison and hence to measure the performance of the technical candidate. The steady state analysis on the technical candidate allows verifying whether or not the technical candidate fulfils the criteria for assessing consequences.
The criteria are ([3] or [4]):
• Cascade tripping: A single normal contingency must not result in any cascade tripping that may lead to a serious interruption,
• Maximum permissible thermal load: No case must result in an excess of the permitted rating of the network equipment, taking into account duration.
• Maximum and minimum voltage levels: No voltage collapse must be observed. Furthermore, the minimum and maximum voltage levels must respect the limits defined by equipment ratings and national regulation, taking into account duration.
• Maximum loss of load or generation should not exceed the power available in primary regulation reserve for each synchronous region.
• Short circuit criteria: The initial symmetrical and single-phase short-circuit current shall not exceed the limits defined by equipment ratings and national regulation.
• Voltage collapse criteria: The reactive power output of generators and compensation equipment should not exceed their rating and transformer taps should not have reached their limits in attempting to maintain voltages.
6.3.4 Stability assessment
According to Q67 of the questionnaire, in the system development context, the stability assessment is generally applied when seen as necessary.
The specific cases are:
• HVDC connections,
• important new 400 kV line,
• Loss of synchronism in case of tower contingency.
The stability assessment is based on three different types of analyses; the rotor angle stability, frequency stability and voltage stability and on three criteria ([3] or [4]).
• Transient stability: Any 3-phase short circuits successfully cleared by the primary protection system in service (or forecasted) shall not result in the loss of rotor angle stability and the disconnection of the generating unit (unless the protection scheme requires the disconnection of a generation unit from the grid).
• Small Disturbance Angle Stability: Possible phase swinging and power oscillations (e.g. triggered by switching operation) in the transmission grid shall not result in poorly damped or even undamped power oscillations.
• Voltage security: Normal contingencies (incl. loss of reactive power infeed) must not lead to violation of the admissible voltage range that is specified by the respective TSO.
6.3.5 Design remedy
If a project does not meet one of the criteria described previously, minor adjustments are required. In overload case, the solutions are:
• New circuits,
• Circuit uprating,
• Topological change.
In over or under voltage cases:
• Reactive compensation,
• New controls.
In case of exceeding limits of short circuit power:
• Add series reactor,
• Reconfigure network.
In instability case:
• Reduce system impedance,
• Modify generator controls,
• Install Special Protection Schemes.
If the adjustments on the project modify the grid transfer capability (GTC), a new market analysis is necessary.
6.4
Electrical indicators
6.4.1 Improved Reliability (security) of supply
measures the improvement to the reliability of supply (generation or network adequacy) brought about by a technical candidate. It is calculated as the difference between the cases with and without the technical candidate, with the defined indicator being either Expected Energy Not Supplied (EENS) or the Loss of Load Expectancy (LOLE). Nevertheless, in the questionnaire, the TSOs were asked about how reliability is taken account in long-term investments (Q61) and many TSOs indicate that the reliability of supply is not monetized and assessed.
• Methodology: For network studies, performance assessment is based on the technical criteria defined in 6.3.3 and 6.3.4. Analysis of representative cases may, for example, identify risk of loss of load for ordinary contingencies. The EENS indicator will then show whether the inclusion of the technical candidate triggers a significant improvement of reliability of supply.
6.4.2 RES integration
Support to RES integration is defined as theability of the system to allow the connection of new RES plants and unlock existing and future “green” generation, while minimising curtailments.
The integration of both existing and planned RES is facilitated by: 1. Connection of RES generation to the main system,
2. Increasing the Grid Transfer Capability (GTC) between an area with excess RES generation and other areas, in order to facilitate higher level of RES penetration.
This indicator intends to provide a standalone value associated with additional RES available for the system. It measures the reduction of renewable generation curtailment in MWh (avoided spillage) and the additional amount of RES generation that is connected by a technical candidate.
• Methodology: Although both types of technical candidates can lead to the same indicator scores, they are calculated on the basis of different measurement units. Direct connection (1) is expressed in MWRES-connected (without regard to actual avoided spillage), whereas the GTC-based
indicator (2) is expressed as the avoided curtailment (in MWh) due to (a reduction of) congestion in the main system. Connected RES is derived from network studies, and only calculated for specific RES integration technical candidates. Both kinds of indicators may be used for the technical candidate assessment, provided that the method used is reported. In both cases, the basis of calculation is the amount of RES foreseen in the scenario.
6.4.3 Variation in losses
Variation in losses in the transmission grid is the characterisation of the evolution of thermal losses in the power system. It is an indicator ofenergy efficiency and is correlated with the socio-economic welfare. The energy efficiency benefit of a technical candidate is measured through the reduction of thermal losses in the system. At constant transit levels, network development generally decreases losses, thus increasing energy efficiency. Specific projects may also lead to a better load flow pattern when they decrease the distance between production and consumption. Increasing the voltage level and the use of more efficient conductors also reduce losses. It must be noted, however, that the main driver for transmission projects is currently the higher need for transit over long distances, which increases losses. In the questionnaire, the TSOs were asked about how the transmission losses are taken account in long-term planning (Q66). The answer shows that transmission losses are monetized during the market analysis. The amount of transmission losses for market analysis are estimated by load flow computation or based on historical data. Furthermore, the transmission losses are integrated in ENTSO-E’s CBA methodology for the regional projects.
At regional level, the result of market analysis is a part of ENTSO-E’s CBA methodology. For the national level, several TSO indicate that congestion costs are used for investment decisions.
technical candidate, while taking into account the change of dispatch that may occur by means of market simulation. The variation in losses is then calculated as the difference between both values. The TSOs typically only consider losses in their own systems.
6.4.4 Variation in CO2 emissions
Variation in CO2 emissions is the characterisation of the evolution of CO2 emissions in the power system.
It is mainly a consequence of RES integration (unlock of generation with lower carbon content). By relieving congestion, reinforcements may enable low-carbon generation to generate more electricity, thus replacing conventional plants with higher carbon emissions. Considering the specific emissions of CO2 for each power plant and the annual production of each plant, the annual emissions at power plant level and perimeter level can be calculated and the standard emission rate established.
• Methodology: Generation dispatch and unit commitment used for calculation of socio-economic welfare benefit with and without the project is used to calculate the CO2 impact, taking into
account standard emission rates.
6.4.5 Technical resilience/system safety
Technical resilience/system safety is the ability of the system to withstand increasingly extreme system conditions (exceptional contingencies). Making provision for resilience while planning transmission systems, contributes to system security during contingencies and extreme scenarios. This improves a project’s ability to deal with the uncertainties in relation to the final development and operation of future transmission systems. Factoring resilience into projects will impact positively on future efficiencies and on ensuring security of supply in the European Union.
• Methodology: A quantitative summation of the technical resilience and system safety margins of a technical candidate is performed by scoring a number of key performance indicators (KPI) and aggregating these to provide the total score of the project.
6.5
Other assessments
6.5.1 Cost of different technical candidates
For each project, costs have to be estimated. The following items should be taken into account:
• Expected cost for materials and assembly costs;
• Expected costs for temporary solutions which are necessary to realise a project;
• Costs mitigated or compensated under existing legal provisions;
• Cost of planning procedures;
• Expected costs for devices that have to be replaced within the given period;
• Dismantling costs at the end of life of the equipment;
• Maintenance costs and costs of the technical life cycle.
The time horizon accounted for in transmission projects is generally shorter than the technical life of the assets, thus, an appropriate residual value will therefore be included in the end year, using the standard economic depreciation formula used by each TSO.
6.5.2 Robustness/flexibility
related to development and transmission needs on a regional basis are dealt with adequately. Moreover, special emphasis is given to the ability to facilitate the sharing of balancing services, as we suppose that there will be a growing need for this in the coming years.
6.5.3 Environmental and Social impacts
The environmental and social impacts allow the quantification of the local impact of the project on biodiversity and population. To characterise these impacts, preliminary studies are necessary for each project.
The mains aspects are:
• For biodiversity, the land protected or with national park,
• For population, the density and the land that is near to schools.
These aspects are generally defined by international or national legislation.
6.6
Project portfolio management
Project Portfolio Management (PPM) is the centralized management used by project managers to analyse and collectively manage current or proposed projects based on numerous characteristics. The objectives of PPM are to determine the optimal resource to achieve operational and financial goals.
The main constraints to take into account are:
• Annual budget of investment ,
• Finite development resources in a specified time (Obligation to align the new investment projects with the strategic plan),
• Constraints imposed by customers or commitment with regard to customers,
• Make sure that projects are in relation to the strategic objectives and priorities of the TSO’s.