City, University of London Institutional Repository
Citation
:
Gowreesunker, B. L., Stankovic, S. B., Tassou, S. A. and Kyriacou, P. A. (2013). Experimental and numerical investigations of the optical and thermal aspects of a PCM-glazed unit. Energy and Buildings, 61, pp. 239-249. doi: 10.1016/j.enbuild.2013.02.032This is the unspecified version of the paper.
This version of the publication may differ from the final published
version.
Permanent repository link:
http://openaccess.city.ac.uk/2215/Link to published version
:
http://dx.doi.org/10.1016/j.enbuild.2013.02.032Copyright and reuse:
City Research Online aims to make research
outputs of City, University of London available to a wider audience.
Copyright and Moral Rights remain with the author(s) and/or copyright
holders. URLs from City Research Online may be freely distributed and
linked to.
Experimental and numerical investigations of the optical and thermal
aspects of a PCM-Glazed unit
B.L. Gowreesunker
a, S.B. Stankovic
b, S.A. Tassou
a, P.A. Kyriacou
ba
Mechanical Engineering Department, School of Engineering and Design, Brunel University,
Uxbridge, Middlesex, UB8 3PH, UK
b
School of Engineering and Mathematical Sciences, City University London, Northampton
Square, London EC1V 0HB, UK
Corresponding authors:
a
Email:
lesh_g@yahoo.com
(B.L. Gowreesunker); Tel: +44 (0) 1895 277220
b
Email:
stankovic.stanislava.1@city.ac.uk
(S.B. Stankovic); Tel: +44 (0) 20 7040 3878
Abstract
This paper reports on the experimental and numerical analysis of the optical and thermal aspects of
PCM (Phase Change Material) RT27 when subjected to an irradiation source of energy. The analysis
is separated into the thermal and optical characterisation of the PCM using the T-history method
and spectrophotometry principles, respectively, and the experimental and numerical performance
evaluation of a PCM-Glazed unit. Various relationships describing the variations in the extinction,
scattering and absorption coefficients with respect to the liquid fraction/ temperature within the
phase change region were developed from the experimental setup, and were validated in a
numerical CFD model. The results show that: i) during rapid phase changes, the transmittance
spectra from the PCM are unstable, while under stable conditions a visible transmittance value of
90% and 40% are obtained for the liquid and phases, respectively; ii) the radiation scattering effects
are more prominent in the solid phase of the PCM, while radiation absorption dominates in the
liquid phase; iii) the optical/ radiation performance of PCM can be successfully modelled using the
liquid fraction term as the main variable, in a similar way that the enthalpy porosity method is
employed for phase change processes; iv) relative to a standard double glazed unit, the addition of
applications, the risk of overheating after the PCM has melted may be a significant factor; v)
although the day-lighting aspects of PCM-glazed units are favourable, the change in opacity and
heterogeneity in visual aesthetics as the PCM changes phase may be a limiting factor in PCM-glazed
units.
Keywords:
Phase change materials (PCM); Thermal properties; Optical properties; Phase changeand radiation modelling; PCM-glass unit
Nomenclatures:
τ Radiation transmittance
α Radiation absorptance
ρ Radiation reflectance
ε Radiation emittance
n Refractive index
G Transmitted irradiation (W/m2)
d Optical thickness
s Physical thickness (m)
σa Scattering coefficient (m-1)
σs Scattering coefficient (m-1)
σε Extinction coefficient (m-1)
δ Overall fractional change in transmittance
β Liquid Fraction
T Temperature (°C)
cp Specific heat capacity (kJ/kg⋅K)
λ Thermal conductivity (W/m⋅K)
Sm Governing momentum equation source term
Subscripts
:gl Glass unit
gl-PCM Glass and PCM unit
PCM Phase change material only
sol Solidus state
1.0 Introduction
The low thermal mass or capacitance of building envelopes is progressively becoming a growing
issue due to the trend of architects to increasingly design buildings with maximum exposure to the
outdoor environment [1]. The effectiveness of thermal mass is based on its ability to absorb and
store heat, and dampen the temperature fluctuations within a space. In the UK, it is widely accepted
that thermal mass is beneficial to buildings with respect to increasing thermal comfort and reducing
energy consumption [2].
In most buildings with large glazed areas, the thermal mass of the building envelope is much lower
than conventional building walls such as a brick or timber frame wall. It can be distinguished that
although the U-value (2.8 W/m2K) of a standard double glazed wall (4mm glass - 16mm air cavity -
4mm glass), for example, is comparable to a solid brick wall (1.41 W/m2K) or a timber frame wall
(1.14 W/m2K) [3], their respective thermal masses are significantly different: the decrement delay of
a double glazed window is 0.03h, compared to 8.0h or 4.9h for a solid brick wall or a timber frame
wall, respectively, calculated from the Chartered Institute of Building Services Engineering (CIBSE)
admittance method [3]. As a result, employing a double glazed envelope in a building increases the
heat transfer across the building envelope, and stores very little heat in the process, relative to a
timber-frame or brick wall.
An approach to increase the thermal mass of buildings with large glazed areas is to incorporate
Phase Change Materials (PCM) in the cavity of the glazing. PCMs refer to materials with enhanced
heat storage capabilities in a specific temperature range through the utilisation of their latent heat
capacity. The latent energy is obtained due to changes in the molecular structure of the material as
it changes phase. In the case of solid-liquid PCM, the melting process is endothermic, while freezing
is exothermic. This ‘extra’ energy that can be stored or released by the material during phase change
can improve the energy storage potential of the overall glazing structure, and therefore enhance
It can be inferred from the literatures that PCMs have received most attention in relation to their
application to plasterboards, wallboards or concrete [4], as well as active systems such as PCM-heat
exchangers [5]. These systems have already been shown to be effective for different building spaces,
and resulted in various commercial products such as Dupont Energain®, Monodraught Cool-Phase®
or Ebb PCM-Clay® boards. Most commercial/experimental systems are opaque, and therefore the
understanding and consideration of the radiation aspect of PCM have been largely neglected in past
research studies.
However more recently, new commercially available types of glazing such as Delta®-Cool 28, INGLAS
PCM® or GlassX®, which all incorporate PCM, have been developed, which indicates increasing
market potential for more thermally massive glazing. For the GlassX® unit, the manufacturer claims a
reduction of 5.5°C in the peak temperature swing for a passive building. The main design issue
associated with such systems has been found to be the change in transparency of the PCM as it
changes phase. For the case of organic PCM, the material is found to be translucent in the solid
phase, while fully transparent to visible light in the liquid phase [6].
Thus, in order to understand and improve the performance of PCM in a glazed structure, knowledge
of the radiation (optical) heat transfer properties as well as the visual aspects during phase change is
required. Furthermore, in order to justify the performance of PCM systems to a wider variety of
conditions, modelling approaches are commonly employed [7, 8, 9]. Consequently, a modelling
approach will also be developed to allow the prediction of phase change and radiation performance
of PCM-glazed systems, which is currently limited in the literatures.
This study is oriented towards the evaluation of the radiation heat transfer properties and
performance of PCM-glazed systems. The main aims are to: characterise the radiation and thermal
properties of the PCM during phase change; investigate the behaviour of the PCM in a double glazed
of such systems; and compare the thermal performance of a PCM-glazed unit to a standard double
glazed unit.
2.0 PCM characterisation
2.1 Thermal Characterisation
The investigated material was RT27 organic paraffin, produced by RUBITHERM® GmbH. According to
the manufacturer’s specification, RT27 has the melting/congealing range between 25 °C and 28 °C
with a typical phase change temperature of 27 °C, which are similar to the PCM used in Delta®-Cool
28. The heat storage capacity of this PCM is 184 kJ/kg [10]. Thermal testing of RT27 was performed
using the T-history method which was specifically designed for the investigation of PCM [11]. The
application of the T-history method requires the use of a reference material. Distilled water was
used in this study due to its well-known thermal properties. The height of the test tubes was 30 cm
with the internal diameter of 1.2 cm in order to keep the Biot’s number below 0.1 and apply the
lumped capacitance model for the T-history setup [24]. Accordingly, the mass of the investigated
RT27 was limited by the tubes’ geometry to 17 g. An environmental chamber (BINDER KMF 115
BINDER GmbH [12]) was used as the temperature controlled facility. It ensures precise thermal
control in the range from -10 °C to 100 °C. The PCM and reference samples were subjected to the
step temperature changes between 14 and 37 °C. Firstly, the samples were heated to the
temperature a few degrees above the PCM melting point. When both samples reached equilibrium,
they were then exposed to a temperature a few degrees below the melting point. Temperature
history throughout the process was recorded so the T-history curves could be used to evaluate the
thermal properties of the PCM, in terms of the melting/congealing range and the heat storage
capacity. Continuous temperature measurements of the samples and the chamber temperature
were measured using thermistors (Newark MA100GG103A model [13]). Thermistors were selected
for the temperature measurements due to their high sensitivity and responsiveness to the
nonlinear temperature-resistance response [15]. Therefore, an appropriate instrumentation system
for thermistor linearisation, signal amplification and filtering had to be used. The relevant
linearisation and calibration procedures are explained in detail in a recent publication [16]. The
obtained temperature uncertainty was ±0.3 °C. A total of 20 cooling and heating cycles were
recorded to investigate the repeatability of the experiments and to reduce measurement errors.
Finally, the heat storage capacity was evaluated as suggested by Marin et al. [17] and the results
presented as heat released/stored in a given temperature interval as explained in the paper
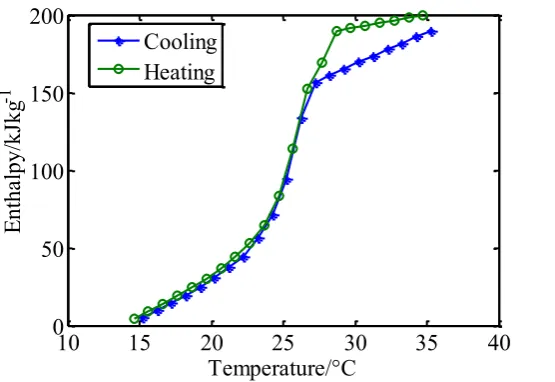
reported by Mehling et al. [18] (see Fig. 1). In addition, the enthalpy temperature dependency was
[image:7.595.161.417.331.521.2]also estimated and given in Fig. 2.
Fig. 1. Heat released-stored in given temperature intervals for RT27 PCM; HR – Heat released; HS – Heat stored.
13 15 17 19 21 23 25 27 29 31 33 35 0 10 20 30 40 H ea t r el ea se d-st or ed/ kJ kg -1
Fig. 2. Enthalpy – temperature dependency for RT27 PCM in case of cooling and heating measurements.
The melting/congealing range (see Fig. 1) was wider than the 25 to 28 °C range as mentioned by the
manufacturer [10], but in agreement with published data [19]. The peak value for energy density
reported in ref. [19] for RT27 was higher than what is presented here (see Fig. 1), and this is due to
the temperature precision of the reported data. In this case, the temperature precision of the energy
density was 1 °C in order to ensure better readability of the results. In addition, the heat storage
capacities were evaluated between 15 and 30 °C and were found to be 170 and 191 kJ/kg for the
cooling and heating cycles, respectively. This is within the ±10 % uncertainty range of the 184 kJ/kg
given by the manufacturer.
2.2 Optical Characterisation
One of the main drives of this study is to investigate the solar heating applicability of RT27. Thermal
tests were performed in order to investigate the heat storage capacity of the PCM which proved to
be relatively high for organic material. Another aspect which had to be taken into account was the
optical performance of the investigated material. Therefore, the transmittance spectrum, in a wide
wavelength range of 200 and 1600 nm (spanning the UV, VIS and part of the NIR of the
electromagnetic spectrum), was measured using the high performance PerkinElmer LAMBDA 1050
spectrophotometer [20].
10 15 20 25 30 35 40
0 50 100 150 200
Temperature/°C
E
nt
ha
lpy/
kJ
kg
-1
The transmittance of the PCM was required at different temperatures in order to investigate the
PCM applicability for solar glazing in three cases: PCM in its liquid form, PCM in its solid form and
PCM going through the phase change i.e. the mushy form. This task was limited to a certain extent
due to the non-existent temperature control facility within the spectrophotometer. An experimental
protocol was therefore developed in order to obtain information regarding the RT27 optical
behavior for different phases. Before the transmittance measurements, the PCM sample was
maintained inside the environmental chamber for long enough time periods so as to reach thermal
equilibrium at the specified initial temperature. The sample was then placed inside the
spectrophotometer and continuous transmittance scans were run until a stable spectrum (i.e. similar
spectral data between the consecutive scans) was obtained. Each scan, in the previously indicated
wavelength range, lasted for about 6 min. Due to the lack of temperature control mechanism within
the spectrophotometer; the PCM temperature could not be controlled. However, the final
temperature was measured after every test so that the results could be correctly interpreted. The
recorded optical behavior of RT27 under different phases is shown in Fig. 3.
The first test was for the PCM at an initial temperature of 26 °C, obtained inside the chamber. Upon
visual inspection of the sample, the PCM started to change its phase from liquid to solid. The sample
was then placed inside the spectrometer with an air temperature of 25 ±1 °C. Three transmittance
scans were performed and they all resulted in very similar spectral data which were averaged and
displayed in Fig. 3 as curve 26. Considering the experimental conditions for this test, curve 26 in Fig.
3 corresponds to the mushy region of the investigated material. For the second test, the fully liquid
material with the initial temperature of 30 °C was placed inside the spectrometer at a temperature
of 27 ± 1 °C and five consecutive scans were performed. All of them resulted in similar transmittance
values. These scan data were slightly more scattered than the scan data in the previous test, but still
the average value of these five scans, given in curve 30, represents the transmittance values
correctly. This curve corresponds to the transparency of the liquid PCM sample. The third test was
spectrophotometer, with the inside air temperature of 23 ±1 °C. Initial scans resulted in very
unstable spectral data so, in total, fourteen scans were performed until a stable spectrum was
obtained. For better visibility, only the 1st, 4th, 7th and 14th scan data are shown in Fig. 3 in curves 40
1 , 40 4, 40 7, and 40 14, respectively. The curve 40 14 in Fig. 3 corresponds to the stable
transmittance spectrum in the third test when, upon visual inspection, the sample was in solid
phase. From all measurements, it was observed that the spectral data were very unstable during
transitional processes inside the investigated material i.e. when the large differences between the
initial and the final PCM temperature were present. Also, it was estimated that in the visible region,
the transparency of the liquid RT27 is around 90 %, certainly higher than 60 % and 40 %
corresponding to the mushy and solid states, respectively. However, the resulting transparency
[image:10.595.160.435.377.577.2]enables the utilization of RT27 for the PCM glazing in carefully designed solar heating systems.
Fig. 3. Transmittance – wavelength dependency for RT27 for different initial temperatures of the PCM; 26 – initial PCM temperature at 26 °C; 30 – initial PCM temperature at 30 °C; 40 1 – initial PCM temperature at 40 °C, 1st scan; 40 4 – initial PCM temperature at 40 °C, 4th scan; 40 7 – initial PCM temperature at 40 °C, 7th scan; 40 14 – initial PCM temperature at 40 °C, 14th scan. (The measurement uncertainty is ±2% for the liquid samples and ±10% for the solid samples)
The results obtained for the solid and liquid phases, shown in Fig. 3, correspond to data provided by
Weinläder et al. [6] for RT25. Furthermore, we can also observe that as the PCM changes phase
under stable conditions, the transmittance values change but the spectral distribution over the
entire spectrum is relatively constant. That is, the shape of the spectrum is maintained, while the
transmittance values change.
3.0
Experimental setup
Spectrophotometers can be used to obtain detailed spectral information on the optical properties of
the PCM, however as mentioned in section 2.2, it is very difficult to maintain specific temperatures
of the PCM within the photometer chamber. Thus, the spectral distribution for the transmittance
can only be accurately related to the PCM phase for the cases where the PCM is solid or liquid, and
at 25 ± 1 °C.
The experimental setup shown in Fig. 4 was therefore devised in order to aid in the understanding of
the radiation effect within the mushy phase of the PCM. The aims of this setup are: to firstly quantify
the variation in radiation effects within the mushy phase, which is unavailable from the
spectrophotometer; and secondly, to portray the PCM radiation behaviour in a ‘real’ PCM-glazed
system.
Fig. 4(a). Schematic of Experimental setup
Reflector Casing
Pyranometer
[image:11.595.171.415.426.616.2]Fig. 4(b). Actual Experimental setup inside Environmental Chamber
This entire setup was placed inside an environmental chamber where the air temperature was
controlled as shown in Fig. 4(b). A Kipp & Zonen CMA-6® pyranometer was used to measure the
radiation heat flux (W/m2) transmitted through the glazed surface test specimens. The light source
employed was a 150 W metal halide (Iodide discharge) lamp producing a diffuse light of neutral
white colour, with a spectrum ranging mainly from 350 nm to 850 nm. The intensity of the
irradiation was varied by adjusting the distance between the lamp and the glazed surface. The
reflector casing (see Fig. 4a) was built in order to minimise the loss of transmitted radiation intensity
reaching the pyranometer. Thus, the interior surface of the reflector casing was lined with a
reflective aluminium coating to maximise reflection by the surface. The pyranometer was placed at
the centre of the reflector casing exit and would therefore measure the area-average and gray
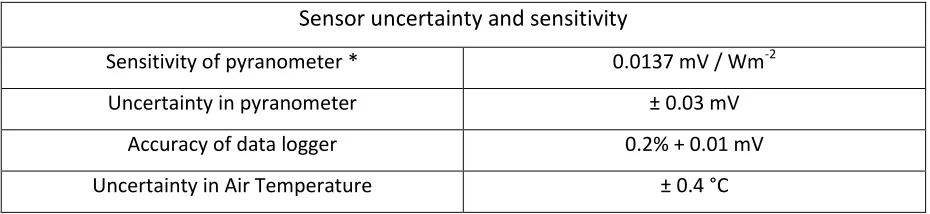
intensity of the transmitted radiation. A PICO TC-08® data logger was used to record the voltage of
the pyranometer at every 20 s intervals, which was converted into heat flux with the appropriate
conversion parameter (see Table 1). Three different surfaces were considered: ‘no-glass’; an
ordinary/standard double glazing; and a PCM filled double glazing (see Fig. 11). The ordinary double
glazing was 20×20 cm, with an overall thickness of 24mm consisting successively of 4 mm glass, 16
mm air cavity and 4 mm glass. For the case of the PCM filled glazing, the air in the cavity was
The main objective was to measure the gray radiation transmittance for the different glazed surfaces
separately at various temperatures within the phase change region of the PCM. This would then
allow the gray optical thicknesses of the PCM to be determined at different temperatures, as
described in section 3.1. The temperature of the PCM was obtained by ensuring that the chamber air
temperature in which the PCM was located was maintained for a minimum of 24 hours prior to the
test. This was done in order to prevent the use of intrusive sensors, such as thermocouples, which
would influence the nucleation properties of the PCM. The chamber air temperature was maintained
constant at the initial temperature over the course of the experiment.
Sensor uncertainty and sensitivity
Sensitivity of pyranometer * 0.0137 mV / Wm-2
Uncertainty in pyranometer ± 0.03 mV
Accuracy of data logger 0.2% + 0.01 mV
[image:13.595.66.531.296.403.2]Uncertainty in Air Temperature ± 0.4 °C
Table 1 – Sensor uncertainties and sensitivities (*Obtained from Manufacturer)
3.1 Mathematical Optical Expressions
The experiments described in section 3.0 were performed by measuring the transmitted radiation
intensity for non-glazed/empty specimen (G), double glazed (Gτ-gl) and PCM-glazed (Gτ-gl-PCM)
surfaces, under different controlled temperatures in an environmental chamber. The gray
transmittance (τ) of the glazed units was then obtained from Eq. (1) and Eq. (2).
- Eq. 1
- Eq. 2
- Eq. 3
In order to obtain the gray transmittance associated only with the PCM, Eq. (3) was used. This was
combination of the attenuations of the ordinary double glazing and the PCM, for the same
irradiation intensity. τPCMwas therefore used to evaluate the optical properties of the PCM only. It
should be noted that the value of τgl-PCM used to evaluate τPCM is the lowest value obtained at the
beginning of each experiment, when the temperature of the PCM was uniformly equal to the air
temperature. Thus, the calculated value of τPCMcorresponds to the initial PCM/Air temperature for
each case.
In the case of the standard glazing or PCM-glazed systems, where the refractive indices of all the
materials are relatively small (<1.5), it was inferred that the effects of internal reflections, within the
glazed systems, are of minimal consequence [21]. Hence, to simplify the analysis, the transmittance
observed in the experiments was solely attributed to the overall radiation attenuation effects of the
media and the constant overall reflection at the primary air/glass boundary for the two systems. The
differences in emission from the respective glazing systems are also assumed negligible because of
the similar temperatures of the surrounding surfaces in the experiments and the relatively low
emissivity (≈0.3) of the glazing units. These assumptions are justified in sections 4 and 5.
The attenuation effect described in the previous paragraph is commonly characterised by the optical
thickness (d) of a material, which can be further sub-divided into a scattering (σs) and absorption (σa)
coefficients. These are related by Eq. (4) [22], where ‘s’ is the physical thickness of the test specimen,
or 16mm for the PCM case.
d = (σa + σs)⋅ s -Eq. 4
The absorption effect of radiation energy produces an increase in the internal energy of the
material, while the scattering effect refers to a redirecting of the incoming radiation, either back
towards the source (contributing to reflection) or within the material itself. In this study, the
scattering effect is considered isotropic. The transmittance of the PCM can be related to the optical
Log10 (τPCM) = -d -Eq. 5
Eq. (5) shows that as the transmittance of the PCM increases, the optical thickness decreases, and
correspondingly so will (σa+σs). The concern however is to be able to separate the optical thickness
into the respective ‘σa’ and ‘σs’ coefficients in order to understand the thermal aspect of the process.
A previous study by Weinläder et al. [6] stated that organic PCM are non-scattering, clear and
transparent in the liquid phase, and that the increase in opacity as the PCM changes to solid is
largely associated to the scattering process. This could also be observed in the experiments of this
study. This observation was subsequently adopted to dissect the optical thickness into the scattering
and absorption coefficients, by assuming that the scattering process dominates during the solid
phase and that the liquid phase is non-scattering. This is explored as follows.
A new parameter δ is defined by Eq. (6), which represents the fractional change in PCM
transmittance as the PCM changes between the fully liquid and fully solid phases.
- Eq. 6
The liquid fraction (β), which refers to the amount of liquid present in the mushy phase, is then
employed to separate and vary the influence of the scattering and absorption processes in the phase
change region, as shown by Eqs. (7) and (8). The term (d/s) is equal to the extinction coefficient (σε).
( ) [ ( )] -Eq. 7
( ) -Eq. 8
The absorption coefficient (σa) starts from a value of (1-δ)⋅(d/s) in the solid phase, and gradually
varies with the liquid fraction, until a value of (d/s) in the liquid phase, where σs = 0. The term (1-δ) is
used to ensure a minimum amount of radiation absorption when the PCM is in the fully solid phase.
only due to the scattering effect. The scattering coefficient (σs) is then obtained from the difference
between the extinction and absorption coefficients, described in Eqs. (4) and (8).
Eqs. (5–8) can thus be used to experimentally evaluate the extinction, scattering and absorption
coefficients at different temperatures, by simply measuring the transmittance values. The outcomes
from this process are difficult to obtain from an ordinary spectrophotometer due to limitations in
controlling and monitoring the temperature of the PCM. However, the results from this
experimental setup only refer to mean gray evaluations for the PCM.
3.2 Results
3.2.1 Radiation Extinction Coefficient (σε)
The experiments were carried out with irradiation intensities of 950 W/m2, 550 W/m2 and 260
W/m2, and temperatures ranging from 13 °C to 29 °C, in order to span the entire phase change range
of the PCM. The experimental results showed that the value of τgl was in the range of 0.53-0.56 for
all the different combinations of irradiation and temperatures investigated.
The uncertainties in the transmittance values are calculated from the accuracies of the instruments,
given in Table 1, and were found to vary from 0.13 in the solid state to 0.07 in the liquid state.
Applying these uncertainties to the calculation of the extinction coefficients (σε) for different
Fig.5. Extinction coefficient variations of PCM with different irradiation intensities and temperatures, and liquid fraction (β)
Fig. 5 shows that the optical thickness of the PCM decreases with increasing temperature, as the
PCM becomes more liquid. This is expected as the scattering effect of the PCM is reduced and more
light passes through. In the fully liquid state, the extinction coefficient decreases to a minimum of 4
m-1 where the incoming radiation is only absorbed by the PCM and the scattering effect is negligible
due to the homogenous transparent nature of the liquid PCM. The irradiation intensity scarcely
affects the extinction coefficients, and the overall trends are similar in all cases.
Fig. 5 also depicts that the rate of change in extinction coefficient increases as the PCM becomes
more liquid in a similar manner to the variation of liquid fraction with temperature. Following this
observation, it was hypothesised that the relationship between the liquid fraction and the extinction
coefficient is inversely proportional. From this assumption, the following relationship (Eq. (9)) was
developed.
σε = (β⋅σε,liq) + (1-β)⋅(σε,sol) - Eq. 9
The advantage of a relationship such as Eq. (9) is that the variation in extinction coefficient can be
the solid and liquid extinction coefficients. For instance, in this study, the relationship β(T) between
the liquid fraction and the temperature of the PCM is defined by Eq. (10), for the range of 15-27.8 °C.
β = (4.39×10⁻⁵⋅T4) – (2.92×10⁻³⋅T3) + (7.38×10⁻²⋅T2) – (8.25×10⁻¹⋅T) + 3.42 (R2= 0.991) - Eq. (10)
The curve for β is obtained by fitting Eq. (10) to the curvature of the mean experimental enthalpy
from Fig. 2, using the method described in ref. [24]. Eq. (10) produced a R2regression coefficient of
[image:18.595.113.487.266.524.2]0.991, with a standard deviation of ± 5 % in the liquid fraction.
Fig.6. Mean experimental extinction coefficients and extinction coefficients using the relationship from Eqs. (9) and (10)
Applying the relationship from Eq. (10) to Eq. (9) leads to a much smoother correlation for the
extinction coefficient, with values within the error limits of the experimental values as shown in Fig.
6. Therefore, confirming the hypothesis defined by Eq. (9). This deduction is also logically coherent
with the fact that the radiation properties essentially vary with the amount of solid/liquid phase in
the PCM, i.e. more solid phase implies more radiation attenuation [6].
3.2.2 Absorption (σa) and Scattering (σs) Coefficients
The σa and σs coefficients are important for validation and numerical studies, as well as to
radiant energy converted to internal energy and hence increasing the temperature, as well as
provide a sense of the radiant energy path within the material. The separation of the σa and σs
coefficients from the extinction coefficient is done using Eqs. (7) and (8), and the results are shown
[image:19.595.133.467.178.392.2]in Fig. 7 for RT27.
Fig. 7. Absorption, scattering and extinction coefficients of PCM RT27 for different temperatures
As anticipated, the scattering coefficient is more prominent in the solid phase, while absorption
dominates in the liquid phase. Within the mushy phase, the scattering effect is higher for the major
part, until a temperature 24.5 °C, after which, absorption dominates until phase change is complete.
This analysis is limited only to the phase change region of the material, with all coefficients assumed
constant for the fully liquid and solid phases. The validity of this method is described in section 4.2.4.
4.0
Validatio
nThe validation of the relations developed (Eq. 7-9) in this study was done empirically using the
spectral data obtained from the spectrophotometer tests, and numerically using a finite volume
model. Section 4.1 deals mainly with the validation of Eq. (9), while section 4.2 validates Eqs. (7 & 8).
Due to a lack of temperature control in the spectrophotometer, it was only possible to accurately
associate a temperature to a spectral distribution for the cases of fully solid, fully liquid and a
temperature of 25 °C, as explained in section 2.2. The other spectra in Fig. 3 can be used to depict
the changes in transmittance of the PCM as it changes phase under stable conditions.
For the experimentally investigated wavelength range of 350-850 nm, the extinction coefficients
obtained from the spectrophotometer were found to be: 30.1-52.3 m-1 for the solid phase; 20.0-24.4
m-1 for a temperature of 25 ± 1 °C; and 3.6-5.5 m-1 for the liquid phase. Correspondingly, the
relationship from Eq. (9), using the β(T) function from Eq. (10) provided values of 29.4 m-1 for the
solid phase, 17.8-20.5 m-1 for a temperature of 25 °C, and 3.71 m-1 for the liquid phase.
It can therefore be observed that Eq. (9) provides adequate data for the liquid phase and at a
temperature of 25 °C, where the values are found to be within the error margin of the
spectrophotometer. Concerning the solid phase, the value predicted from the experiment and Eq.
(9) is very narrowly outside the error margin of the spectrophotometer data. Nonetheless, based on
the relatively high uncertainty margin for the transmittance value obtained from the
spectrophotometer for solid PCM, this small error was considered acceptable in this case.
4.2 Numerical Validation
This section reports on the relevance of the thermal and optical properties characterised in the
previous sections. The double PCM glazed unit is simulated in the CFD finite volume package ANSYS
FLUENT® in order to validate the characterisation techniques and relationships employed. The
simulation involves both the phase change process and the transport of radiation within the PCM.
4.2.1 Phase Change Model
As mentioned in section 1.0, phase change can be numerically modelled as an extra energy stored or
released by the material, making it a predominantly thermal problem. FLUENT® possesses a default
change. This method assumes a linear β(T) function and varies the enthalpy by iteratively using the
product of β⋅L, where L is the total latent enthalpy of the material [24]. This method however does
not always produce accurate results due to the linear assumption of the β(T) function, which is rarely
the case [24, 25].
In contrast, this study uses the effective-heat capacity method, as proposed by Poirier and Salcudean
[26] to simulate phase change. This refers to the application of a variable specific heat capacity to
mimic the extra energy stored/released by the material, which is applied to the governing
Navier-Stokes energy equation. This method is employed because of the relative ease to incorporate the
variation of specific heat capacity with a temperature profile in FLUENT, and to account for the
effect of natural convection. The variation in cp during phase change (15-27.8 °C) is obtained from
the derivative of the mean enthalpy curves described in Fig. 3.
For Tsol ≤ T < 26 °C;
cp(T) = 0.012 T4 - 0.911 T3 + 25.835 T2 - 323.96 T + 1519.21 (kJ/kg⋅K) (R2 = 0.994) -Eq. 11
For 26 °C ≤ T ≤ Tliq;
cp(T)=-7.341 T2 + 376.55 T - 4786.72 (kJ/kg⋅K) (R2=1.000) -Eq. 12
In the fully solid phase, cp = 4.81 kJ/kg⋅K while cp = 3.11 kJ/kg⋅K in the liquid phase. The thermal
conductivity is constant at 0.2 W/m⋅K.
In addition to the energy aspect of phase change, the physical aspects of density and viscosity in the
PCM also need to be considered as they directly influence convection in the material. The density
within the phase change region was varied with the liquid fraction term as shown in Table 2. The
viscosity in the liquid phase is obtained following the approach employed by Reid et al. [27], which
suggests a form of exp (A + (B/T)) for the viscosity variation of liquid PCM. This has been adjusted in
this case based on data provided by the manufacturer. Within the phase change region, the viscosity
sink, as described in ref. [22], to account for the porosity effect during phase change. The
momentum sink Sm defined by Eq. (13), is applied to the governing Navier-Stokes momentum
equations in a similar way to the default enthalpy porosity method used in FLUENT [22], except that
the liquid fraction (β) is defined by Eq. (10).
( )
- Eq. 13
Sm accounts for the phase change process by retarding the flow in the material domain based on the
liquid fraction; the sink value is largest in the solid phase and zero in the liquid phase.
Temperature range Viscosity (Pa⋅s) Density (kg/m3)
T < Tsol
- 880
Tsol ≤ T ≤ Tliq
0.031 880 – (120⋅β)
T > Tliq (
) ref. [27]
[image:22.595.77.520.296.416.2]
[ ( )] ref. [28]
Table 2. Variation of viscosity and density during the phase change process
The implementation of the variation of both of these physical properties allows the consideration of
natural convection within the glazing during phase change.
4.2.2 Radiation Model
The Discrete Ordinates (DO) model is employed in this study to simulate the effects of radiation. This
has been specifically chosen because it is the most detailed model in FLUENT, allowing for the
simulation of radiation scattering and absorption effects, and is applicable for a wide range of optical
thicknesses. The DO model solves the radiation heat transfer equation for a finite number of discrete
solid angles by transforming it into a transport equation for radiation intensity [22]. Hence, due to
the extra equations to be solved, the simulation speed is reduced, but accuracy is improved. The
The angular discretisation for radiation transport was separated into 3×3 divisions and 2×2 pixels,
and the irradiation is diffuse and gray. The two glass layers in the double glazed window was
modelled as thin walls, with thermal conductivity of 1.3 W/m⋅K, density of 140 kg/m3, specific heat
capacity of 840 J/kg⋅K, σa of 19 m-1, non-scattering properties and a constant refractive index of 1.5.
The equations of the absorption and scattering coefficients for the PCM are implemented as
User-Defined Functions (UDF), varying with the temperature of the cells. The refractive index of the PCM
was obtained from ref. [29] which describes the refractive index of organic paraffin (i.e. alkanes) to
vary between 1.3 – 1.4. For this validation study, a constant value of 1.3 was employed for all phases
of the PCM [6].
4.2.3 Numerical considerations
The Finite Volume model was designed using the ANSYS Design modeller and consists of 10,000
structured hexahedral cells, as shown in Fig. 8. Only the PCM was meshed, while the glazing was
modelled as thin walls. The front and back faces were defined as semi-transparent walls, with
convective thermal boundary conditions to the ambient environmental chamber air. A heat transfer
coefficient of 5.1 W/m2K was applied to the front face, while 1.1 W/m2K was used for the back one.
These coefficients were obtained from a separate simulation between the experimental setup and
the environment chamber. The sides of the glazed units are adiabatic and reflective. A time-step of
10s was employed, and the simulations were run for 3.5h on a single-core, 3GHz and 8MB RAM
Fig. 8. PCM finite volume model
Validation was done for the case of an irradiation level of 950 W/m2and an air/initial PCM
temperature of 13 °C, where the PCM undergoes complete phase change from fully solid to fully
liquid. The irradiation intensity was uniformly applied to the glazing as diffuse and perpendicular to
the front face, and the overall transmittance was obtained by the ratio of radiation flux between the
front and back faces.
4.2.4 Validation of Results
This section describes the transient results obtained over a simulation period of 3.33 h (12,000s),
after which the PCM was fully liquid and the radiation effects reached steady state. Fig. 9(a) shows
the progression of the transmittance (τgl-PCM) of the PCM filled glazed unit, and portrays a
comparison with the experimental results. Fig. 9(b) shows the volume weighted temperature of the
Fig. 9(a) Transmittance (with error curves) of the PCM filled glazing under 950 W/m2 irradiation and 13 °C
Fig. 9(b) Numerical progression of PCM Temperature
Fig. 9(a) shows that the transmittance values obtained from the simulation are within the errors of
the experimental results, and that the trends are also similar. As the numerical results match the
experimental data within the error limits, the model is considered to be valid. Fig. 9(a) also shows
that at the beginning of the experiment, the transmittance value of the PCM glazing is lowest due to
the opacity associated with the solid PCM. In the solid state, the scattering effect dominates as
described in Fig. 7, and thus most irradiation is reflected. The relatively small absorption effect
described by the term (1-δ)⋅(d/s) in Eq. (7), corresponding to ≈6m-1 allows the temperature to
gradually increase until the phase change onset temperature of 15°C (at around 750s), as shown in
[image:25.595.140.459.69.276.2] [image:25.595.137.463.303.507.2]phase change, the absorption effects are constant, while the change in the scattering coefficient is
relatively more pronounced. Therefore, in the early stage of phase change, the change in
transmittance can be mainly associated to scattering.
Subsequently, upon reaching a temperature of ≈20 °C (at ≈2000s) the rate of increase in
transmittance decreases due to a lower rate of temperature increase, whereby the phase change
effect of the PCM becomes more evident. In this temperature range, although the optical thickness
has a high rate of change (see Fig. 7), the variation in effective heat capacity of the PCM dominates
the overall change in transmittance. In the final portion of phase change (between 25-28 °C), where
the effective heat capacity of the PCM is at its maximum, the rate of increase of both the
temperature and the transmittance decreases further.
5.0
Discussion
This section is divided into three sub-sections examining: the validity of the results; the relevance of
representing the radiative aspect of the PCM with the liquid fraction; and the design implications
with PCM-glazed systems. It is important to note that the relationships developed in this paper apply
only to PCMs that are non-scattering in the liquid phase.
5.1 Validity of Results
The experimental setup described in section 3 allows the determination of the gray transmittance of
the PCM-glazing within the irradiation spectral range of 350 nm to 850 nm, which constitutes mainly
the visible part of the electromagnetic spectrum. The metal-halide lamp was chosen on size and
considerations as the utilisation of a more realistic 1000 W Compact Source Iodide (CSI) lamp to
simulate solar irradiation [30] would have been impractical in the employed environmental
chamber.
As observed from Fig. 3, within the spectral range of 350 nm to 850 nm, the transmittance values of
reinforcing the assumption of gray radiation used in the experimental study. Furthermore, the
optical thicknesses for the fully liquid and solid states obtained from the experiment match the
spectrophotometer results, as explained in section 4.1. The experimental results for the mushy
phase can also be justified due to the uniformity in the temperature/ liquid fraction of the
PCM-glazing when the data were collected. The latter observation is further confirmed in section 4.2.4,
where the numerical results obtained from the experimental inputs are valid over the entire phase
change process of the PCM.
It can also be observed from Fig. 3 that as the PCM changes between the fully solid and liquid states,
the intensity of the transmitted light changes, but the distribution or shape of the spectral
transmittance stays the same. Therefore, the relative changes in optical thickness observed for the
visible region can also be applied for the more complete spectrum of Fig. 3. This is because the
relative changes observed in the visible part, are actually uniform over the entire spectrum, and
must therefore be consistent over all wavelengths. Thus, although the observations in the
experiments were made mainly for the visible spectrum, they can also be applicable to the much
broader spectrum, as the relative changes in the extinction coefficients obtained from Eq. (9) are
similar for wavelengths other than those in the visible region.
5.2 Relevance and Importance of the liquid fraction
The liquid fraction refers to the relative amount of liquid phase present in the PCM at any
temperature. In most past investigations, the liquid fraction term (β) was mainly used in numerical
studies [28, 31, 32] where the thermal and/or physical properties of the PCM during phase change
were required. Similarly, in the numerical portion of this study, the liquid fraction was directly used
in the calculation of the density and the momentum retardation term, while it was indirectly present
in the effective heat capacity model, due to the temperature dependence. The importance of the
liquid fraction is further demonstrated on an experimental level, whereby the radiation properties of
extinction coefficient into the scattering and absorption coefficients was also done through the
liquid fraction.
The main advantage of using the liquid fraction term in radiation problems can however be
attributed to the numerical simplification of the phase change problem. The observations from this
study suggest that the liquid fraction term can be used to simplify the radiation aspect of phase
change, analogous to the way that the enthalpy-porosity method simplifies the thermal aspect of
phase change.
In the enthalpy-porosity method, the liquid fraction is employed in order to avoid the explicit
tracking of the phase change interface, and considerably decrease the complexity of phase change
problems [33]. In problems involving radiation and phase change, the radiation transmittance,
absorption and reflection during phase change can also be simplified by using the liquid fraction
term, with the assumption of isotropic scattering of the solid phase and constant refractive indices.
This is mathematically demonstrated by Eqs. (14-16), obtained via the manipulation of Eq. (5) and
the validated relations developed in this study.
The transmittance of the PCM is obtained from Eq. (5), where d = [ β⋅σε,liq + (1-β)⋅σε,sol ]⋅s;
τPCM = 10 -d -Eq. 14
The absorption of the PCM can be obtained by dividing Eq. (7) with Eq. (9);
αPCM= [δ⋅β +(1-δ)] ⋅ (1-τPCM) -Eq. 15
The reflectance of the PCM due to scattering can be obtained by dividing Eq. (8) with Eq. (9);
ρPCM= [δ - δ⋅β] ⋅(1-τPCM) - Eq. 16
These equations are obtained from a radiation energy balance of the glazing, and from observations
in the experimental and numerical sections of the study. They provide a simplified/ lumped method
to modelling combined radiation and phase change problems, and they can be used in conjunction
5.3 Design Implications
The purpose of incorporating PCM within a glazed unit is to increase the thermal mass of the glazed
system. However, because of the transparency of glazed units, the radiation effects of the PCM are
also crucial. This section aims at comparing the performance of a PCM-glazed unit with an ordinary
double glazed unit.
The application of PCM increases the overall heat capacity within a double glazed unit. In this case,
with a mean effective heat capacity of 10 kJ/kgK for RT27 during phase change, the decrement delay
of the overall PCM-glazed unit is approximately 2h (decrement factor of 0.9), compared to 0.03h
(decrement factor of 1.0) for an ordinary double glazed unit, calculated using the CIBSE admittance
method [3]. These imply that employing PCM within a glazed unit will improve the thermal mass by
delaying the impact and reducing the effect of the outdoor conditions on the indoor environment.
As elaborated in section 4.2.4, the reduction in transmittance of the PCM-glazed unit during phase
change is mainly due to the scattering and absorption properties of the PCM. However, when the
PCM is melted, radiation absorption is then the dominant effect resulting in an increase in the
temperature of the unit. On the other hand, in a standard double glazed unit, the radiation
absorption properties of air in the cavity are negligible, and the dominant effect resulting in the
reduction in transmittance is the reflection due to changes in refractive indices and the radiation
absorption properties of the glass. The differences in behaviour for these two systems are shown in
Fig. 10. The standard glazing temperature profile is obtained from a separate CFD simulation, with
Fig. 10. Model Temperature and transmittance progression for a PCM-glazed and a standard double glazed unit under 950 W/m2 irradiation and 13°C air/initial glazing temperature.
Fig. 10 shows that in the phase change region of the PCM-glazed unit, the PCM provides a higher
reduction in transmittance and a lower rise in temperature than the standard double glazed unit.
This implies that the radiation heat transfer rate is reduced and the effect of the extra thermal mass
due to the PCM is clearly observed. The discrepancy in the glazing performances occurs after the
phase change process, where the temperature of the PCM increases above that of standard glazing.
This is due to the constant radiation absorption coefficient (4 m-1) of the PCM in the liquid phase, as
opposed to no absorption by the air-cavity. As a result, a steady-state temperature of 40 °C is
obtained for the standard glazing, while a higher temperature of 70 °C is obtained for the
PCM-glazed unit after the phase change process.
Furthermore, it can be seen that the steady-state transmittance of the PCM-glazed (0.47) and
standard glazed units (0.56) are relatively close, even though more radiation is absorbed by the
liquid PCM. This similarity in transmittance can be explained with reference to the different
refractive indices of a normal glazing and PCM-filled glazing. In the case of normal glazing, the
greater difference between the refractive indices of the glass (n=1.5) and air-cavity (n≈1) implies that
difference in refractive indices between the PCM (n=1.3) and the glass (n=1.5) in the PCM-glazing is
lower, less reflection is induced. Thus, although the steady-state transmittances are similar, the
dominant radiation effects are different; the irradiation is mostly absorbed in the liquid PCM
(leading to increase in temperatures), whilst it is mainly reflected in a normal air-cavity glazing. This
therefore stresses the importance of proper sizing of such PCM-systems in order to avoid
overheating.
Moreover, the visual aspect of a PCM-glazed unit is also very important with regards to aesthetic
purposes. As observed in this study, PCMs are fully transparent in the liquid phase, but are
[image:31.595.154.448.338.612.2]translucent in the solid/mushy phase, as shown in Fig. 11.
Fig. 11. Visual aspect of phase change
The colour of the transmitted light is the same at any phase of the PCM as the spectral distribution
in Fig. 3 is the same at all phases, making it acceptable for daylight purposes. However the radiation
intensity is different. Furthermore, the change in opacity and scattering of light can be an
architectural drawback. This can however be minimised by employing concealing measures such as
6.0 Conclusions
This study analyses the optical and thermal aspects of a PCM-glazed unit, and compares its
performance with a standard double glazed unit. The optical properties were evaluated using
spectrophotometry and a custom-built experimental setup, while the thermal properties were
evaluated using the T-history method. Various relationships were developed based on observations
from the experimental results, which allowed the description and modelling of the optical aspects of
PCM during phase change. The experimental results and relationships developed were also
employed in a finite volume model, which was validated over the entire phase change process.
The results of this study show that:
During rapid changes in temperature or phase of the PCM, the transmittance spectra are
unstable. Conversely, under stable conditions, visual transmittance values of 90 % and 40 %
are obtained for the liquid and solid phases, respectively. It was also observed that the
changes in transmittance spectrum at different PCM phases are quasi-uniform under stable
conditions.
The scattering effects are more prominent in the solid phase, while absorption dominates in
the liquid phase. Within the mushy phase, the optical properties of PCM that are
non-scattering in the liquid phase can be described with relation to the liquid fraction.
Employing the relationships developed from this study allows a successful and valid
representation of the radiation propagation within a PCM, over the entire phase change
range. Although the relationships have been developed for the 350-850 nm wavelength
range, it has been argued that they can be extended to the much broader spectrum. This
provides a platform for further research in this field.
The use of PCM within a double-glazed unit improves the thermal mass during phase
change, relative to a standard double glazed unit. After phase change, although providing a
the PCM-glazed unit, compared to reflection in a standard glazed unit. Thus, when using
PCM-glazed units on a case-by-case basis, adequate emphasis must be placed on the
overheating aspects of PCM-glazed units after the PCM has melted.
The PCM visual aspect changes as the material changes phase. It is translucent in the solid
phase and transparent in the liquid phase. Thus, depending on its application, this may be
acceptable, or the PCM may have to be concealed.
This study aims at providing a platform for further research/ application in this field. The
relationships developed can be further verified for a wider range of PCM and wavelengths, or be
employed in the design of thermally massive glazed units with PCM. Furthermore, the behaviour of
PCM-glazed units during night cooling can also be explored.
Acknowledgements:
This work was made possible through sponsorship from the UK Engineering and Physical Sciences
Research Council (EPSRC), Grant No: EP/H004181/1. The Authors acknowledge the help of Ms Meha
Qassem (City University London) with the initial spectrophotometry tests and Mr. Costas Xanthos
References:
[1] C.W. Bostick, Architectural trend thru the looking glass, In Proceedings of the Glass performance days 2009, Tampere, Finland, pp. 860-866
[2] H. Pochee, G. Dawson, P. Burgon, T. Bentham, An analysis of the benefits and drawbacks of exposed thermal mass in modern, well-insulated buildings, In Proceedings of the World Renewable Energy Forum, Denver, Colorado, 13-17 May 2012, Paper 0964
[3] Chartered Institute of Building Services Engineering (CIBSE) guide A, 2006
[4] N. Soares, J.J. Costa, A.R. Gaspar, P. Santos, Review of passive PCM latent heat thermal energy storage systems towards buildings’ energy efficiency, Energy and Buildings (2012),
doi:10.1016/j.enbuild.2012.12.042
[5] M. Medrano, M.O. Yilmaz, M. Nogues, I. Martorell, J. Roca , L.F. Cabeza. Experimental evaluation of commercial heat exchangers for use as PCM thermal storage systems. Applied Energy 86(2009): 2047–2055
[6] H. Weinläder, A. Beck, J. Fricke, PCM-façade-panel for daylighting and room heating, Solar Energy 78(2005): 177-186
[7] D. Heim, J.A. Clarke, Numerical modelling and thermal simulation of PCM–gypsum composites with ESP-r, Energy and Buildings 36(2004): 795–805
[8] J. Mazo, M. Delgado, J.M. Marin, B. Zalba, Modeling a radiant floor system with Phase Change Material (PCM) integrated into a building simulation tool: Analysis of a case study of a floor heating system coupled to a heat pump, Energy and Buildings 47(2012): 458–466
[9] A.V. Sá, M. Azenha, H. Sousa, A. Samagaio, Thermal enhancement of plastering mortars with Phase Change Materials: Experimental and numerical approach, Energy and Buildings 49(2012): 16– 27
[10] Rubitherm Technologies GmbH. <Available from: www.rubitherm.com> (last accessed on 25.11.2012.)
[11] Z. Yinping, J. Yi, J. Yi, A simple method, the T-history method, of determining the heat of fusion, specific heat and thermal conductivity of phase change materials, Measurement Science and Technology 10(1999): 201-5
[12] BINDER GmbH. <Available from: www.binder-world.com/en> (last accessed on 25.11.2012.)
[13]Newark/element 14. <Available from: www.newark.com> (last accessed on 25.11.2012.)
[14] G. Rakocevic, Overview of sensors for Wireless Sensor Networks, Transactions on Internet Research 5(2009): 13-8
[16] S.B. Stankovic, P.A. Kyriacou, The effects of thermistor linearization techniques on the T-history characterization of phase change materials, Applied Thermal Engineering 44(2012): 78-84
[17] J.M. Marin, B. Zalba, L.F. Cabeza, H. Mehling, Determination of enthalpy—temperature curves of phase change materials with the temperature-history method: improvement to temperature dependent properties, Measurement Science and Technology 14(2003): 184-189
[18] H. Mehling, S. Hiebler, E. Günther, New method to evaluate the heat storage density in latent heat storage for arbitrary temperature ranges, Applied Thermal Engineering 30(2012): 2652-2657
[19] E.D. Kravvaritis, K.A. Antonopoulos, C. Tzivanidis, Experimental determination of the effective thermal capacity function and other thermal properties for various phase change materials using the thermal delay method, Applied Energy 88(2011): 4459-4469
[20] PerkinElmer. <Available from: www.perkinelmer.co.uk> (last accessed on 25.11.2012.)
[21] R. Siegel, C.M. Spuckler, Effects of refractive index and diffuse or specular boundaries on a radiating isothermal layer, Journal of Heat Transfer 116(1994): 787-790
[22] ANSYS FLUENT Theory guide (Nov 2010) Release 13.0.
[23] M.F. Modest, Radiative heat transfer, 2nd Edition. Academic Press; 2003
[24] B.L. Gowreesunker, S.A. Tassou, M. Kolokotroni, Improved simulation of phase change processes in applications where conduction is the dominant heat transfer mode, Energy and Buildings 47 (2012): 353–359
[25] B.L. Gowreesunker, S.A. Tassou, Effectiveness of CFD simulation for the performance prediction of phase change building boards in the thermal environment control of indoor spaces, Building and Environment 59(2013): 612-625
[26] D. Poirier, M. Salcudean, On numerical methods used in mathematical modelling of phase change in liquid metals, ASME Journal of Heat Transfer 110(1988): 562–70
[27] R.C. Reid, J.M. Prausnitz, B.E. Poling, The Properties of Gases and Liquids. McGraw-Hill, New York, 1987
[28] W.B. Ye, D.S. Zhu, N. Wang, Fluid flow and heat transfer in a latent thermal energy unit with different change material (PCM) cavity volume fractions, Applied Thermal Engineering 42(2012): 49-57
[29] A. Aucejo, M.C. Burguet, R. Munoz, J.L. Marques, Densities, viscosities, and refractive indices of some n-alkane binary liquid systems at 298.15 K, Journal of Chemical and Engineering Data, 40 (1995): 141–147
[30]H.E.A. Abdel-Salam, S.D. Probert, Use of Compact-Source Iodide (CSI) lamps to simulate solar insolation, Applied Energy 24(1986): 303-313
[32] A.M. Borreguero, M.L. Sánchez, J.L. Valverde, M. Carmona, J.F. Rodríguez, Thermal testing and numerical simulation of gypsum wallboards incorporated with different PCMs content, Applied Energy 88(2011):. 930–937