© 2016 WIT Press, www.witpress.com
ISSN: 2056-3272 (paper format), ISSN: 2056-3280 (online), http://www.witpress.com/journals DOI: 10.2495/EQ-V1-N2-141-154
PARAMETRIC ANALYSIS FOR AN ALGAL OIL
PRODUCTION PROCESS
F. MADUGU & M. COLLU Cranfield University, United Kingdom.
ABSTRACT
Microalgae are considered to be one of the most feasible options that have the potential to serve as a major feedstock for biofuels and bio-products production. However, the economic viability of com-mercial scale production remains questionable by many researchers and investors. There are several uncertainties in the technology for microalgae growing and harvesting, and the extraction of algal oil, which makes it difficult to identify the technology most suitable for minimizing cost and maximizing profits. Therefore, there is a need to carry out parametric analyses to identify the influence of system configuration and process on the economic viability. This study establishes an economic analysis for a microalgae oil production pathway to determine the minimum cost of producing algal oil. Taking the capital and operating costs parameters from the economic analysis, some of the key parameters are changed across a range of values and their influence on the final cost of algal oil is analysed. Each of the parameters is analysed across a range of production scale from 5 to 75 g/m2/d. The results show that the most important cost-driving parameters are the pond cost (especially the liners) and the harvesting costs, and that the costs can be reduced from £1.87/L to £1.58/L for a growth rate of 25 g/m2/d and £1.34/L for a growth rate of 50 g/m2/d. This ultimately suggests that to achieve economic viability, improvements to cell biology (both growth rates and lipid content) and reducing systems unit costs while improving performance will be required together.
Keywords: algal oil, biofuels, economic cost, parametric analysis. 1 INTRODUCTION
The global demand for energy and the environmental issues emanating the use of petrole-um fuel have attracted the use of renewable energy technologies. Global population growth is expected to reach 8 billion by 2030, causing a 36% increase in energy demand with a 27% demand from liquid transport fuel. It has also been reported that global carbon dioxide emis-sion has exceeded the highest threshold of 455 ppm – equivalent, 10 years ahead of expectation. Adopting sustainable energy sources, such as biofuels from microalgae, can make a significant contribution in achieving demand and reducing environmental emissions.
Microalgae are multicellular and unicellular photosynthetic organisms. They are plant-like organisms, but do not have roots or stems, and can be found in marine or fresh water. They use sunlight as a source of energy, and carbon dioxide, phosphorous and potassium as a source of food to grow. They are composed of lipids, carbohydrates and proteins [1, 2], allow-ing them to be used for the production of biofuel, animal feeds, chemicals, cosmetics and pharmaceuticals. Microalgae technologies are not yet being developed on a commercial scale, due to the many uncertainties relating to economic viability; currently, no microalgae are produced at a price that can compete with petroleum fuel.
perfor-mance to be modelled numerically. The analyses vary differently in either their input or output values. For example, it can be their energy value that varies, or the weight of the bio-mass, and in some analyses it is the type of lipid extract or even the processed fuel or bioproduct produced. The major drawback of these studies is that they are limited to particu-lar areas of research, e.g. they either assess the engineering aspect, or economic impact of producing algal biofuels, the energy and resources demand, or just evaluate the environmen-tal impact of the production process, or focus on the biofuel that is being produced. Clearly, a simultaneous analysis of the performance of a feasible biofuels production process that includes technical, economic and environmental impact is needed.
Despite the many alternative technologies for growing microalgae, harvesting and extrac-tion of the oil, identifying the most suitable technology for minimizing the cost of producing crude algal oil and maximizing profits remains challenging. Thus, some articles have focused on techno-economic analyses of alternative pathways for producing algal oil, with the aim of projecting the probable economic viability of a commercial scale microalgae production facil-ity. Some of the recent analyses on economic viability are works published by Davis et al. [3], Chisti [4] and Norsker et al. [5]. These articles estimated algal oil production costs by com-paring open pond (OP) systems with photobioreactor (PBRs). Davis et al. [3] estimated the minimum selling price of algal oil to be $8.52/gal when cultivating in an OP system and $18.1/ gal for PBRs to achieve a 10% internal rate of return with a facility producing 10 million gal-lons per year. Chisti [4] also estimated the cost of producing algal oil using OP and PBRs; the analyses find the cost per gal to be $2.95 for OP and $3.80 for PBRs for an annual biomass production of 100,000 kg. Norsker et al. [5] estimate algal oil production costs at €4.95/kg for OP, €4.16/kg for tabular PBRs and €5.96/kg for flat panel PBRs for a facility area of 100 ha.
It is clear from the number of researches that a substantial volume of work is being done to create a model that shows the potential of a microalgal oil production facility. But these studies are yielding widely differing results, leaving it unclear whether microalgal oil is a competitive alternative to petroleum fuels.
This study carries out a parametric analysis on some key parameters with the aim of iden-tifying their influence on the economic viability of algal oil. This research is limited to the analysis of the most influencing parameters; other economic analysis, such as risk assess-ment, is outside the scope of this work.
2 METHODS AND PROCESS
The process analysis is set at a scale of 1,000 bbl/day of algal oil. The microalgae are grown in an OP cultivation system. Productivity rate of 25 g/m2/d and lipid content of 25 wt% are
processes account for most of the water used in the whole process. Water consumption is estimated based on evaporation loss of 0.229 g/L. Once the algae are settled and the water is returned to the culture, it then follows a secondary harvesting process, which is done with dissolved air flotation (DAF) systems that have an energy consumption of 1.478E-04 kWh/ g-dw [10], and finally centrifugation. Cellular disruption is done using high-pressure homogenization, followed by a wet extraction process. Remnants, including lost solvent and unrecovered lipids, are sent to an anaerobic digestion facility for energy and nutrient recy-cling (Table 1).
2.1 Economic cost of algal oil
The capital equipment estimates utilize unit construction costs from Spon’s Architect and Builders Price Book, Davis Langdon, 137th edition 2012 [11], except for the cultivation
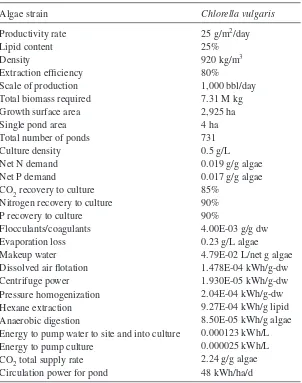
Table 1: Input parameters.
Algae strain Chlorella vulgaris
Productivity rate 25 g/m2/day
Lipid content 25%
Density 920 kg/m3
Extraction efficiency 80%
Scale of production 1,000 bbl/day
Total biomass required 7.31 M kg
Growth surface area 2,925 ha
Single pond area 4 ha
Total number of ponds 731
Culture density 0.5 g/L
Net N demand 0.019 g/g algae
Net P demand 0.017 g/g algae
CO2 recovery to culture 85%
Nitrogen recovery to culture 90%
P recovery to culture 90%
Flocculants/coagulants 4.00E-03 g/g dw
Evaporation loss 0.23 g/L algae
Makeup water 4.79E-02 L/net g algae
Dissolved air flotation 1.478E-04 kWh/g-dw
Centrifuge power 1.930E-05 kWh/g-dw
Pressure homogenization 2.04E-04 kWh/g-dw
Hexane extraction 9.27E-04 kWh/g lipid
Anaerobic digestion 8.50E-05 kWh/g algae
Energy to pump water to site and into culture 0.000123 kWh/L
Energy to pump culture 0.000025 kWh/L
CO2 total supply rate 2.24 g/g algae
[image:3.496.98.400.82.465.2]pond. Engineering design and costs for cultivation ponds adopts data from several major works published by Weissman and Goebel [12], Benemann and Oswald [13] and Lundquist
et al. [14]. The infrastructural material for the system, excluding the pond, is adopted from the algae process description model developed by the Argonne National Laboratory.
A single pond size of 4 ha (690m × 60m) is assumed, with L/W ratio of 20/1, and total channel length of 1,400 m spanning an area of 2,925 ha totalling 731 ponds. The ponds require a total of 731 paddlewheel mixers, one for each pond. The total cost of constructing the ponds is estimated at £138M without liner and £225M with liner. The ponds are assumed to be lined with a 40-mm high-density polyethylene (HDPE) liner at a cost of £0.28/ft2
total-ling £87M, and contributing to 31% of the total capital investment. The total energy requirement for the growth stage is estimated at a price of £0.11 kWh totalling £0.8M; the estimates include the energy required to transport water to the site and into the culture, pad-dlewheel mixing energy and the energy to pump the culture to the settling pond. Water is assumed to be recycled in this analysis; the total makeup water to replace water loss due to evaporation and harvesting is estimated, as the sum of evaporation loss and the water that is passed downstream to settling, minus the water returned to the pond from other operations. The total cost of makeup water is found to be £921,000 at £8.00E-05/L.
The land cost of £20,060 ha ($7,422 ha) is based on figures published in Lundquist et al. [14]. The carbon source is purified CO2 at a low cost of £24/t ($40/tonne) [15]. Nitrogen is derived from ammonia and used with a 76% efficiency to cover losses. The phosphorous is derived from diammonium phosphate (DAP), the cost of ammonia is £240/t ($407/t) and phosphorous £260/t ($442/t) [15].
The estimated cost of harvesting includes cost of settling tanks at £9M, DAF at £2M and centrifugation at £19M, for a total of £31M, which is 9% of the total capital investment. The operating cost of this system comes from the energy consumption at a cost of £4.6M. Chi-tosan is used in the DAF system at a total cost of £57,000. The extraction system is estimated to be £14M, 4% of the total capital investment. The energy cost for extraction is estimated at £4.9M. The recovery process is done using anaerobic digester, and the total cost of the digester is estimated at £0.7M. Other systems include the cost of makeup water piping and CO2 delivery system; the water piping includes both PVC and concrete pipes, and 13 pumps. The total cost of piping is £2M, and £11M for the CO2 distribution system.
Pond operators are calculated based on 50 pond(s) per operator for OP systems. The har-vesting and processing operators are estimated based on scale of production. It is assumed that for a production scale of 1,000 barrels per day, eight operators are required for harvesting (13 settling tanks, 4 centrifuges) and processing (28 homogenizers, 5 centrifuges).
3 RESULTS
3.1 Estimated algal oil production costs
annual operating cost to arrive at the final algal oil cost. The total capital investment is esti-mated at £403M, including indirect capital costs (estiesti-mated as a percentage). The annual operating cost is estimated to be £55M. The estimated final algal oil production cost is £1.87/L. The major contributor to the algal oil costs is shown to come from the capital costs investment.
Pond and liner costs are found to be the highest contributors to the capital cost, with 64% contribution, followed by harvesting with 11% (including settling tanks, DAF and centrifuge) and the inoculum pond at 9%, the high cost of the inoculum pond is a result of the use of 40 mm HDPE liner to line the bottom of the tanks. For the operating costs, the largest driver of cost is energy consumption at 48%, followed by nutrients costs at 27%; labour cost is the lowest contributor to the annual operating costs at 23%. The breakdown costs of the capital and operating costs are presented in Tables 3 and 4.
3.2 Parametric analysis
A parametric analysis is carried out to determine the influence of some of the configured parameters to the algal oil production costs. The reason for adopting this method is to deter-mine at which stage the chosen parameters guarantee a minimum price of algal oil. Hence, the analyses would focus on the parameters that have the potential for possible cost reduction in and highest contribution to the algal oil costs.
The values of each parameter are varied across a range of values and are presented as a percentage of the comparison value. The comparison value is indicated as 100%, which is the base case value used in the estimate above; therefore, 50% indicates half and 200% double the base case value.
The set of parameters that are examined are listed in Table 2.
It should be noted that the parameters are examined to highlight the influence of each parameter independently. Because microalgae oil technology is still at the pilot stage, the values are not set based on practical scales, rather each of the parameters is varied based on assumptions, and what has been presented in the literature.
3.2.1 Productivity rate and lipid content
The assumptions about productivity rate and lipid content can easily be made, but very diffi-cult to justify [16]. Although the lipid content in microalgae can reach up to 75% by weight of dry biomass, most common algae have oil levels between 20% and 50% [17]. Based on current literature and existing plants, there is no credible evidence that productivity much
Table 2: Parameters examined. Parameter Base case value Values analysed
Productivity rate 25 g/m2/d 50, 100, 200% 12.5, 25, 50 g/m2/d
Lipid content 25 wt % 50, 100, 200% 12.5, 25, 50 wt%
Harvesting £3 M /ha 50, 100, 200% 1.5, 3, 6 £/M/ha
Pond and liners cost 0.026£/m2 0, 70, 100, 200% 0.018, 0.026, 0.052 £/m2
Facility footprint 2,925 ha 50, 100, 200% 1,463; 2,925; 5,850 ha
Ammonia 240 £/ton 50, 100, 200% 120, 240, 480 £/ton
[image:5.496.66.432.514.634.2]Table 3: Capital cost estimation (1,000 barrels of algal oil per day).
Cost £/millions % Contribution
£/L contribution
Ponds £138 39 £2.63
Inoculum pond £31 9 £0.60
Pond liner £87 25 £1.66
Algae settling tank £9 3 £0.19
Dewatering DAF £2 1 £0.04
Dewatering centrifuge £19 6 £0.37
Algae Extraction plant £14 4 £0.27
Anaerobic digester £7 2 £0.15
Water transfer system (makeup water piping)
£2 1 £0.05
CO2 distribution system £11 3 £0.23
Major equipment subtotal 93 £6.18
Construction labour £32 10 MEC £0.77
Labour subtotal 9 £0.77
Total installed capital costs (ISBL) £356 £8.42
Site development £3 9 ISBL £0.07
Warehouse £12 4 ISBL £0.31
Additional piping 4.5 ISBL
Total direct costs (TDC) £371
Field expenses £3 10 TDC £0.08
Home office and construction cost £6 20 TDC £0.15
Proratable cost £3 10 TDC £0.08
Contingency £3 10 TDC £0.08
Other costs (i.e. start- up, right of way, freight, etc.)
£3 10 TDC £0.08
Total indirect costs £18 £0.83
Fixed capital investment £388 £9.25
Land cost £15 7 £0.56
Working capital £0 5 TDC
Total capital investment £407
higher than 20 g/m2/day (Algal Biomass Summit, 2011) [18] can be achieved. A recent
benchmark was set at the Algal Biomass Summit in 2011 for 3,706–4,942 gallons per ha per year for a combination of productivity and lipid content, which roughly translates to a lipid content of 25% at an algal productivity value of 20 g/m2/day, or 32% at 15 g/m2/day. This
[image:6.496.65.431.85.526.2]Table 4: Annual operating cost estimation (1,000 barrels of algal oil per day). Cost £/millions % contribution £/L contribution
Ammonia £1.11 2 £0.02
DAP £1.08 2 £0.02
Carbon dioxide consumption £12.76 23 £0.24
Nutrient subtotal £14.94 27 £0.28
Flocculent £0.06 0 £0.00
Makeup water supply £0.92 2 £0.00
Growth and first dewatering £8.36 15 £0.16
Remaining dewatering £4.65 8 £0.09
Lipid extraction £4.92 9 £0.09
Anaerobic digestion £2.26 4 £0.04
Off-site CO2 transfer into pond £1.12 2 £0.00
Recovered CO2 transfer into pond £5.28 10 £0.00
Power subtotal £26.58 48 £0.35
Buildings £0.01 0 £0.00
Total variable costs £41.52 75 £0.63
Manager/lab management/aquatic biologist
£0.51 1 £0.01
Techs, operators £0.77 1 £0.01
Admin £0.04 0 £0.00
Overheads £0.49 1 £0.01
Labour subtotal £1.81 3 £0.03
Salt disposal £1.13 2 £0.02
Maintenances £9.72 18 of TDC £0.19
Total fixed costs £12.66 23 £0.24
Total operating expenses £55.17 100 £1.05
Total revenue £0.00 0 £0.00
Total production cost £55.17 100 £1.05
Financing (avg annual debt payment) £0.00 0 Equity payment – individuals (avg
annual payment)
£0.00 0
Equity payment – corporations (avg annual payment)
£39.69 100
Property tax £3.46 1
Land lease £0.00 0
Total (with financing) £98.97 £1.87
Total (without debt, equity, taxes,
lease) £55.17
£0.89
[image:7.496.63.429.82.600.2]This analysis studies the impact on the 1,000 bbl/day scale by doubling and reducing pro-ductivity from the base case scenario (25 g/m2/d). The scale of productivity is set as constant;
therefore, any increase in productivity and/or increase in lipid content would not change the quantity of the total algal oil produced per barrel, but would change the quantity of biomass produced.
Doubling the productivity to 200% (50 g/m2/d) reduces the growth surface area by 50%,
and the area required to produce the desired algal biomass at 7.31E-04 ton/dw per day decreases from 2,925 to 1,463 ha. Water demand is also reduced by half which translates to a volume equivalent to 0.041% of the UK water requirement consumption in the agriculture sector. Water per unit of algal oil is reduced by 59% from 4.79E-02 to 2.84E-02 L/g of algae.
Reducing productivity by half to 50% (25g/m2/d) increases the required growth surface by
100%. Water demand is increased by 50% from the baseline to a volume equivalent to 0.0014% of the UK water requirement consumption for agriculture. The change in land growth surface area means a possible cost reduction in land cost.
Although the costs of production are greatly affected by the amount of lipid produced and the extraction efficiency of the lipid of the algae strain, changes to the lipid content and extraction efficiency impact on the productivity, but do not affect the scale of production and material infrastructure, but they only have a minimal impact on the processing requirement; e.g. at a constant production rate (i.e. 1,000 bbl/day), the amount of lipid and extraction effi-ciency diminishes, and the cultivated area augments (see eqns 1 and 2).
Biomass BM g dw d oductivity scale L d
Lipid con
daily daily / /
Pr /
(
)
=(
)
ttent
(
%wt)
(1)Total biomass required BM g dw d BM g dw d
Extraction
T daily
eff
/ / / /
(
)
=..
( )
Eeff.(2)
where BMdaily is the biomass produced gram of dewatered algae per day, BMT = Total biomass required in cultivation pond at gram of dewatered algae per day, Eeff. is the extraction efficiency (80%) and productivity scale 1,000 bbl/d is equal to 158,987 litres per day.
The influence of the change in lipid content on the algal oil production cost shows that doubling the algal lipid content to 200% (50% wt) decreases the biomass required from 7.31E+08 to 3.66E+08 g dw algae/d resulting in the algal oil cost per litre to be reduced by 29%. Also, reducing the lipid content by half 50% (to 15% wt) increases the biomass required to 1.22E+09, increasing the algal oil cost from the baseline cost by 36%.
3.2.2 Harvesting
agricultural settlers, they are assumed to have the potential to reduce operating costs and to have a higher concentration factor of up to 15% solids [19]. Hence, the use of EC could potentially reduce about 50% of the capital cost of harvesting.
Reducing the costs of harvesting by 50% reduces the capital equipment costs by 6%, which translates to algal oil costs of £1.73/L, bringing the overall costs down by 6%. Doubling the harvesting cost is found to increase the overall costs by 13%.
3.2.3 Pond and liner costs
Based on the capital and operating cost estimate, the major cost drivers in the base case scenario are ponds and pond liner costs. Improving these two items is critical to the econom-ics of the algal oil cost. Thus, attempts to reduce the pond cost can be very challenging because the simplicity of the design does not allow any room for improvement, and because the design is very dependent on the scale of production [14]. Therefore, the 50% reduction assumed for the other parameters may not be easily achievable. Rather, many published articles suggest that a 30% cost reduction can be achievable [9, 17, 20, 21], by either reduc-ing the land gradreduc-ing and exaction requirements, or through fundamental redesignreduc-ing of the pond system. An example of the latter is a simple trench pond and liner with a low-cost mechanical system installation for the liner; this patent technology has been developed by Phyco Biosciences, which claims that the system can achieve up to 30%+ reduction in cap-ital costs compared to the tradition raceway ponds [22]. Another example is when the characteristics of the site make it a suitable terrain for which liners would not be necessary, and the use of an alternative lining approach for the ponds such as the clay-lined ponds used by Lundquist et al. [14] or the crushed rocks layers by Weissman and Goebel [12] can be adopted.
Therefore, the analysis examined the influence of pond and liner costs by reducing costs by 30%, and doubling costs from the baseline scenario. Also, the possibility of removing the liner entirely is also considered. After reducing the pond and liner costs by 30%, the final algal oil costs are found to improve by 11%, while removing the liner entirely would reduce costs by 33%, and doubling the cost has increased the costs by 33%.
3.2.4 Facility footprint
Land costs of even £5,900/ha ($10,000/ha) would not make a significant difference in the overall algal oil cost [14]. The cost of land is related mainly to location, alternative uses and ownership. Land costs for wastewater treatment are generally more costly, as they are usually located within or near the town. However, land cost can become a significant factor, in terms of access to required facilities such as roads, power, CO2 and water [14].
Because in the base case the facility area is calculated based on productivity scale, when a higher growth rate is achieved the required land area decreases. Therefore, the analysis would examine the facility footprint by assuming 50% reduction from the baseline land require-ment, based on the assumption that a higher growth can be achieved, and a doubling of the land requirement, assuming a lower productivity scale.
When the land requirement is reduced by 50%, it means that land cost is also reduced by 50%. This change reduces the algal oil costs by 15%, which increases by 100% when the land requirement doubles. The influence of the land cost is much greater when the land area increases with a low productivity rate. This may be as a result of using a baseline productivity rate at 25 g/m2/d. It can be seen from the figure that when land requirement is reduced and a
3.2.5 Nutrients costs
Nutrients are essential components in microalgae cultivation. The cost and sustainability of the nutrients depend greatly on the sources and type of nutrient. Advancement in microalgae tech-nology would involve co-locating algal farms with a power plant or wastewater treatment plant for the supply of nutrients [15]. Limited resources and suitable locations are among the serious challenges preventing the commercial production of microalgal oil. There are several reasons that can cause an increase in nutrients demand, such as volatilization of ammonia, which can cause nitrogen loss; other reasons include loss of media due to pond failure and when flushing to control the accumulation of salts or growth inhibitors [8]. The nutrients used here are ammo-nia, as the source of nitrogen, and DAP, as the source of phosphorus used as a fertilizer.
The influence of nitrogen and phosphorus on the algal cost is examined by doubling and reducing nitrogen and phosphorus cost by half. Nitrogen contributes to about £1.1 million, i.e. about 2.69% of the annual operating cost. The processing of 1,000 bbl/d used in the base case is estimated to require 4,610 metric tons of ammonia per year at 0.019 g/g dw algae. Doubling and reducing the ammonia cost changes the algal oil cost by only 1%. The curve illustrated in Fig. 2 shows the trends overlapping each other, because the change in the price is so insignificant.
The influence of changes in the quantity of DAP used shows a trend similar to that of the ammonia. DAP accounts for 2.62% of the annual operating cost at £1.08 million. The annual DAP requirement is 4,151 metric tons per year.
Figure 1 shows the influence of the reduced changes on algal oil costs. The figure illus-trates the reduction costs of the selected parameters, the reason for this is that the parameters show a reasonable cost reduction in the overall costs of production.
3.2.6 Summary: compounded impact on final algal oil production cost
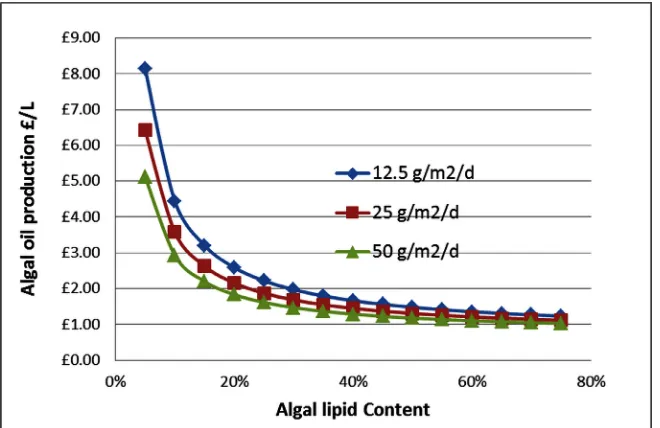
Figure 2 shows productivity having a substantial impact and lipids having the highest influ-ence over the production cost. The curve is non-linear and changes rapidly at lower growth
[image:10.496.85.414.409.623.2]rates, mainly due to the effect of increased demand on parameters, such as land costs and biomass required to achieve the desired scale. Therefore even small changes in the non-linear region can make significant changes to the overall results. The study found this is not an absolute result, as the final algal oil cost depends upon other details of the process, but it can give a useful insight into the quantitative impact from a sensitivity point of view. Chisti and Yan [23] estimate that for algal oil to be competitive with the crude petroleum price of $100 per barrel 2010 USD, it needs to be produced at $0.69/L (£0.41/L). The current price obtained from this analysis shows that substantial improvement would need to be made for algal oil to be competitive. In Fig. 3, the study applied the changes shown in Fig. 2 cumulatively to the base case scenario, for the purpose of assessing the impact of these changes on the facility’s economic viability. Reduction in the costs of the selected parameters shows that if the assumed reductions described above (including all the parameters) are considered, the algal oil production cost approaches an asymptote of £1.34/L for high growth rate (50 g/m2/d),
£2.04/L for medium growth (12.5 g/m2/d) and £1.58/L for base case growth (25 g/m2/d). This
ultimately suggests that to achieve economic viability, improvements to both growth and lipid content and reducing unit costs, while improving performance, will be required together.
4 CONCLUSIONS
The parametric analysis and economic estimate for a 1,000 bbl of algal oil per day facility shows that microalgae production costs can be reduced, if certain improvements can be made to the system process and configuration. Improving the productivity rate and lipid content of microalgae strains through research can improve the economics, given that the productivity rate and lipid content have shown to have the biggest impact on the production cost, since they also influence the costs relative to the other parameters.
The economic and parametric analysis in this study is based on the techno-economic anal-ysis of microalgae cultivation to biofuels and by-products by Madugu and Collu [24]. This
[image:11.496.85.415.70.284.2]study analysed some sets of parameters that needed to be addressed to achieve a viable pro-cess option using a TOPSIS technique.
The economic viability of the algal oil industry can further be improved if the facility pro-duces useable fuel and different energy carriers (electricity or biogas) or other intermediate products. Adopting more cost-effective and efficient equipment can make great cost reduc-tions in capital costs, such as alternative harvesting systems or the use of less costly materials during construction and operation. Increasing the scale of production can also reduce the overall operating costs. This study also recommends that it is important to assess social ben-efits such as jobs generated, and wealth created from such facilities, so as to determine the overall economic benefits. Siting the facility at a location with access to resources can reduce the cost of piping and transportation.
The results obtain in this analysis correspond closely to the value published by many other researches.
REFERENCES
[1] Alabi, A.O. & Tamper, M.B.E., Microalgae Technologies and Processes for Biofuels/ Bioenergy Production for British Columbia; Current Technology, Sustainability and Barriers to Implementation. British Columbia innovation council. Canada, 2009. [2] Mata, T.M., Martins, A.A. & Caetano, N.S. Microalgae for biodiesel production and
other applications: a review. Renewable and Sustainable Energy Reviews, 14(1), pp. 217–232, 2010. doi: http://dx.doi.org/10.1016/j.rser.2009.07.020
[3] Davis, R., Aden, A. & Pienkos, P.T., Techno-economic analysis of autotrophic microalgae for fuel production, Applied Energy, 88(10), pp. 3524–3531, 2011. doi: http://dx.doi.org/10.1016/j.apenergy.2011.04.018
[4] Chisti, Y., Biodiesel from microalgae. Biotechnology Advances, 25(3), pp. 294–306, 2007. doi: http://dx.doi.org/10.1016/j.biotechadv.2007.02.001
[image:12.496.84.416.70.284.2][5] Norsker, N., Barbosa, M.J., Vermuë, M.H. & Wijffels, R.H., Microalgal production — a close look at the economics. Biotechnology Advances, 29(1), pp. 24–27, 2011. doi: http://dx.doi.org/10.1016/j.biotechadv.2010.08.005
[6] Griffiths, M. & Harrison, S.T.L., Lipid productivity as a key characteristic for choosing algal species for biodiesel production. Journal of Applied Phycology,21(5), pp. 493–507, 2009. doi: http://dx.doi.org/10.1007/s10811-008-9392-7
[7] Lardon, L., Hélias, A., Sialve, B., Steyer, J. and Bernard, O. (2009). Life-Cycle Assess-ment of Biodiesel Production from Microalgae. Environmental Science & Technology, 43(17), pp. 6475-6481. doi: http://dx.doi.org/10.1021/es900705j
[8] ANL, The Greenhouse Gases, Regulated Emissions, and Energy Use in Transportation Model, 2012, available at: http://greet.es.anl.gov/ (accessed 27 August 2013).
[9] ANL, The Greenhouse Gases, Regulated Emissions, and Energy Use in Transportation Model, 2015,available at: http://greet.es.anl.gov/ (accessed 16 February 2015). [10] Harris, R.W., Cullinane, J., John, M. & Sun, P.T., Process Design and Cost Estimating
Algorithms for the Computer Assisted Procedure for Design and Evaluation of Waste-water Treatment Systems (CAPDET), U.S. Environmental Protection Agency: USA, 1982.
[11] Langdon, D., Spon’s Architect and Builders Price Book,137th edn., Spon Press: USA and Canada, 2012.
[12] Weissman, J.C. & Goebel, R.P., Design and Analysis of “Microalgal Open Pond Sys tems for the Purpose of Producing Fuels”, subcontract report. Fairfield, California, 1987.
[13] Benemann, J.R. & Oswald, W., Systems and Economic Analysis of Microalgae Ponds for Conversion of CO to Biomass, U.S. Department of Energy, USA, 1996.
[14] Lundquist, T.J., Woertz, I.C., Quinn, N.W.T. & Benemann, J.R., A Realistic Technology and Engineering Assessment of Algae Biofuel Production, Energy Biosciences Institute, University of California, California, 2010.
[15] Jonathan, N.R., Julian, N.R., Bernardo, J.G., Victor, H., Luz Elena, M., Abbas, G., Michael, J.B., George, A.O. & Marc, D.D., A critical analysis of paddlewheel-driven raceway ponds for algal biofuel production at commercial scales. Algal Research, 4, pp. 76–88, 2013.
[16] Benemann, J.R. & Oswald, W.J., Systems and economic analysis of microalgae ponds for conversion of CO2 to biomass. DOE/PC/93, Department of Energy, Berkeley, 1994.
[17] ANL, NREL & PNNL, Renewable diesel from algal lipids: an integrated baseline for cost, emissions, and resource potential from a harmonized model, ANL/ESD/12-4; NREL/TP-5100-55431; PNNL-21437, Argonne National Laboratory: Argonne, IL; National Renewable Energy Laboratory: Golden, CO; Pacific Northwest National Lab-oratory: Richland, WA, June 2012.
[18] Algae Biomass Organisation, Algal Biomass Summit plenary session 2011, 2015, available at: http://www.algaebiomass.org/resource-center/references/reports-studies/ (accessed March 2015).
[20] Davis, R.E., Fishman, D.B., Frank, E.D., Johnson, M.C., Jones, S.B. Kinchin, C.M., Skaggs, R.L., Venteris, E.R. & Wigmosta, M.R., Integrated evaluation of cost, emis-sions, and resource potential for algal biofuels at the National Scale. Environmental Science & Technology, 10(48), pp. 6035–6042, 2014. doi: http://dx.doi.org/10.1021/ es4055719
[21] Frank, E.D., Han, J., Palou-Rivera, I., Elgowainy, A. & Wang, M.Q., Life-cycle analysis of algal lipid fuels with the GREET model, No. 11-5, Argonne National Laboratory, Chicago, 2011.
[22] Phyco, B., Phyco biosciences super trough system, 2015, available at: http://www. phyco.net/Technology.html (accessed November 2015).
[23] Chisti, Y. & Yan, J., Energy from algae: Current status and future trends Algal biofuels – a status report. Applied Energy, 88(10), pp. 3277–3279, 2011. doi: http://dx.doi. org/10.1016/j.apenergy.2011.04.038