Rochester Institute of Technology
RIT Scholar Works
Theses Thesis/Dissertation Collections
6-1-2011
Effect of temperature on the in-plane permeability
of the gas diffusion layer of a PEM fuel cell
Rupak Banerjee
Follow this and additional works at:http://scholarworks.rit.edu/theses
This Thesis is brought to you for free and open access by the Thesis/Dissertation Collections at RIT Scholar Works. It has been accepted for inclusion in Theses by an authorized administrator of RIT Scholar Works. For more information, please [email protected].
Recommended Citation
1
EFFECT OF TEMPERATURE ON THE
IN–PLANE PERMEABILITY OF THE
GAS DIFFUSION LAYER OF A PEMFC
By
Rupak Banerjee
A Thesis Submitted in Partial Fulfillment of the Requirements
for Master of Science in Mechanical Engineering
Approved By:
Dr. Satish Kandlikar
______________________
Department of Mechanical Engineering
(Thesis Advisor)
Dr. Tuhin Das
______________________
Department of Mechanical Engineering
(Examiner)
Dr. Kathleen Lamkin-Kennard
______________________
Department of Mechanical Engineering
(Examiner)
Department Representative
______________________
DEPARTMENT OF MECHANICAL ENGINEERING
ROCHESTER INSTITUTE OF TECHNOLOGY
2
PERMISSION TO REPRODUCE THE THESIS
TITLE OF THESIS:
Effect of Temperature on the In-Plane Permeability of the Gas
Diffusion Layer of a PEM Fuel Cell
I, Rupak Banerjee, hereby grant permission to the Wallace Memorial Library of Rochester Institute of Technology to reproduce my thesis in the whole or part. Any reproduction will not be for commercial use or profit.
3
ACKNOWLEDGEMENT
I begin by expressing my gratitude to my advisor, Dr. Satish G. Kandlikar, for providing me the opportunity to work under his supervision. He has given great support, guiding me through the entire period, to make this project a reality.
I am also thankful for my fellow lab members of the Thermal Analysis, Microfluidics and Fuel Cell Lab, who provided an environment conducive to quality work, and for always being there to provide appropriate feedback and critique, enabling me to produce this work.
This work could never have been possible without the extensive help provided by Robert Kraynik, Steven Kosciol and Dave Hathway during the machining of the test section and other elements. A special appreciation is necessary for the staff of Department of Mechanical Engineering, who has always been a support for all of us.
Finally, I would express my gratitude to my parents, grandparents, brother and best friend, without the support of whom I would never have arrived at this juncture. They have always been there for me, and I feel blessed for their presence. Also, a very special thanks to Mr. Edward Charbonneau, whose guidance has made the journey through this degree pleasant and enjoyable.
4
ABSTRACT
Proton Exchange Membrane (PEM) Fuel Cells convert hydrogen into water by causing electrochemical reaction with oxygen, producing an electric current which can be used to power electric motors. This is seen as a viable alternative to the Internal Combustion Engine which operates on fossil fuels and is often blamed for contribution to the global climate change. Due to the low temperature operation, compared to other forms of fuel cells, it is possible to adapt the PEM Fuel Cell for automotive application. By running on hydrogen, the PEM Fuel Cell promises to enable a clean mode of transport.
5
CONTENTS
PERMISSION TO REPRODUCE THE THESIS ... 2
ACKNOWLEDGEMEN T ... 3
ABSTRACT... 4
LIST OF FIGURES ... 8
LIST OF TABLES ... 9
NOMENCLATURE ... 10
ABBREVIATIONS ... 11
1. INTRODUCTION ... 12
1.1 Gas Diffusion Layer ... 15
1.1.1 Functionality ... 15
1.1.2 Porosity ... 16
1.1.3 Micro-porous layer ... 17
1.1.4 Surface wettability ... 18
1.1.5 Tortuosity... 18
1.1.6 Water transport mechanisms... 18
1.1.6 Directions of mass transport ... 20
1.2 Effects of Temperature ... 22
2. LITERATURE REVIEW ... 23
6
2.2 Objectives ... 33
3. EXPERIMENTAL SETUP ... 34
3.1 Air Supply ... 34
3.2 Humidifier ... 35
3.3 Constant Temperature Water Bath ... 36
3.4 Test Section ... 36
3.5 Data Acquisition... 41
4. TEST PROCEDURE ... 43
4.1 Test Cases... 43
4.2 Leak Testing and Leak Mitigation ... 44
4.3 Testing Procedure... 45
4.4 Data Reduction ... 46
4.5 Validation ... 47
5. UNCERTAINTY AN ALYSIS ... 49
5.1 Systems Calibration... 49
5.1.1 Thermocouple Calibration ... 49
5.1.2 Pressure Sensor Calibration ... 49
5.1.3 Humidity Sensor Calibration ... 50
5.2 Uncertainty Analysis ... 51
7
6.1 Parameters affecting permeability ... 53
6.2 Effect of Temperature ... 53
6.3 Effect of Porosity ... 57
6.4 Effect of PTFE Impregnation ... 59
6.5 Effect of MPL coating ... 60
7. CONCLUSIONS ... 63
8. FUTURE WO RK... 66
8
LIST OF FIGURES
FIGURE 1: SCHEMATIC SHOWING THE DIFFERENT PARTS OF A SINGLE FUEL
CELL 13
FIGURE 2: WATER MANAGEMENT IN PEMFC - DIFFERENT COMPONENTS 14
FIGURE 3: GDL SAMPLE (SGL 25BC) AS SEEN THROUGH LASER CONFOCAL
MICROSCOPY 15
FIGURE 4: LASER CONFOCAL MICROSCOPE IMAGE OF SGL 25BC WITH MPL
COATING. 17
FIGURE 5: THROUGH PLANE DIRECTION OF MASS TRANSPORT 20
FIGURE 6: IN PLANE DIRECTION OF MASS TRANSPORT 21
FIGURE 7: SCHEMATIC OF THE TEST SETUP 35
FIGURE 8: SCHEMATIC REPRESENTATION OF THE TEST SECTION 38
FIGURE 9: SIMULATION RESULTS SHOWING DEVELOPMENT OF STEADY
TEMPERATURE INSIDE THE MANIFOLD OF THE SETUP 39
FIGURE 10: TEST SECTION IN OPERATION 40
FIGURE 11: VALIDATION OF CURRENT DATA WITH LITERATURE 48
FIGURE 12: TEMPERATURE EFFECT ON BASELINE GDL SAMPLES 54
FIGURE 13: TEMPERATURE EFFECTS ON GDL SAMPLES BY SGL 55
FIGURE 14: EFFECT OF TEMPERATURE ON TORAY TGP-H 120 SERIES 56
FIGURE 15: EFFECT OF POROSITY ON THE IN-PLANE PERMEABILITY OF GDL
SAMPLES 58
FIGURE 16: EFFECT OF PTFE ON THE IN-PLANE PERMEABILITY OF GDL SAMPLES
60
FIGURE 17: EFFECT OF MPL ON THE IN PLANE PERMEABILITY 61
9
LIST OF TABLES
TABLE 1: POROSITY AND TORTUOSITY OF GDL SAMPLES WITH DIFFERENT PTFE
IMPREGNATION 26
TABLE 2: SAMPLES TESTED AS PART OF THE CURRENT WORK 43
TABLE 3: FLOW RATES USED IN THE INVESTIGATION AND CORRESPONDING
REYNOLDS NUMBERS 46
10
NOMENCLATURE
K = Permeability (m2 or Darcy) µ = Dynamic Viscosity (Pa-s) Δp = Pressure Drop (Pa)
L = Length of path / thickness of GDL (m) A = Area of sample tested (m2)
W = Volumetric flow rate (m3/s) J = Diffusive flux
D = Co-efficient of diffusion C = Concentration of parameter
Darcy = measure of permeability (approx. 10-12 m2) Deff = effective diffusion coefficient
Dbulk = bulk diffusion coefficient
ε = porosity
Q‟ = diffusibility
11
ABBREVIATIONS
PEM - Proton Exchange Membrane
MEA - Membrane Electrode Assembly
GDL - Gas Diffusion Layer
MPL - Microporous Layer
CCL - Cathode Catalyst Layer
EOD - Electro osmotic Drag
PTFE - polytetrafluoroethylene (also known as Teflon)
SLPM - standard liters per minute
RH - relative humidity
12
1.
INTRODUCTION
Polymer Electrolyte Membrane (PEM) Fuel cells are seen as the future in powering mobile, portable equipment and the transportation industry [1]. They are increasingly being seen as a replacement for the internal combustion engine. Rapid increase in greenhouse gases and the depletion of conventional fuel sources, such as oil wells and natural gas reserves, have focused attention towards the renewable energy options. The prospect of a hydrogen economy in the future predicates an interest in fuel cells. PEM fuel cells are given a special attention over other forms of fuel cells for the automotive application due to the low operating temperatures, quick start up and zero emissions [2].
Although significant advances have been made in the field of fuel cells, there are still a few hurdles which must be overcome before commercialization of the PEM Fuel Cell can be achieved for the automotive market. One of these is the water management inside the cell.
The operation of the fuel cell is based on the following electrochemical reaction:
→ (Anodic reaction) - (1)
→ (Cathodic reaction) - (2)
The combination of the two half reactions result in oxygen and hydrogen being used to produce energy; water being generated as a b y-product. Water is generated at the cathode side catalyst layer (CCL) when the protons transferred from the anode recombine with oxygen atoms to produce H2O.
13
[image:14.612.208.423.220.526.2]efficiency [3] and also for higher durability [4]. The hydration allows the membrane to transport protons from the anode side to the cathode side with lower resistance. However, accumulation of liquid water at the catalyst layer is detrimental to the performance of the cell [5]. The performance loss due to liquid water is known as flooding and efforts must be made to avoid this scenario.
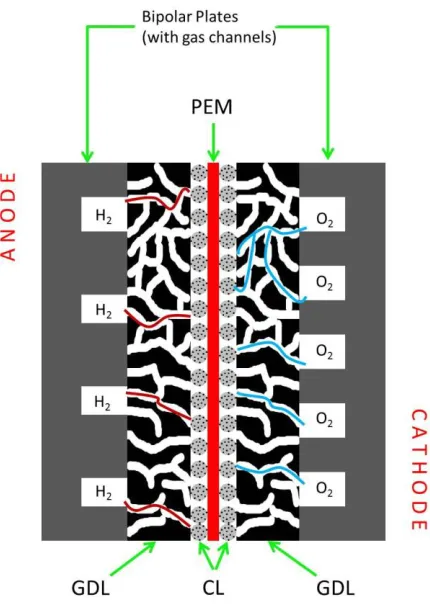
Figure 1: Schematic showing the different parts of a single fuel cell
The water generated from the reactions needs to be efficiently removed from inside the cell so that it may not flood the catalyst layer where the reaction is taking place. The basic structure of the fuel cell is given in figure 1.
14
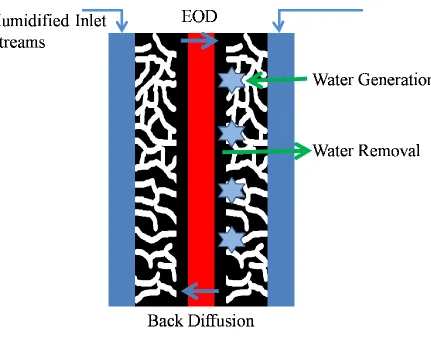
[image:15.612.112.543.203.542.2]considered for the water management inside the fuel cell: water generation, humidified inlet streams, electro-osmotic diffusion, back diffusion and water removal from the cathode catalyst layer.
Figure 2: Water management in PEMFC - Different Components
15 1.1Gas Diffusion Layer
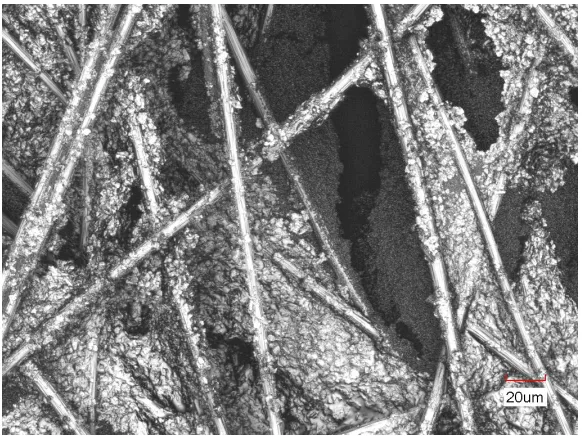
[image:16.612.170.461.166.384.2]The Gas Diffusion Layer is a crucial component of the PEM fuel cell as it has a number of functions. Figure 3 shows us the image of a GDL seen by a Laser Confocal Microscope.
Figure 3: GDL sample (SGL 25BC) as seen through Laser Confocal Microscopy
Carbon papers, made from inhomogeneous stacking of carbon fiber, are a popular choice for GDL materials. The thickness of most GDL materials, in use today, varies between 200 and 400 μm.
1.1.1 Functionality
16 1.1.2 Porosity
GDLs consist of a macro porous substrate with pores size of the range of 1 - 100µm. It is often coated with a microporous layer (MPL), which acts to enhance the electrical conductivity and improves the water management capabilities. The pore diameters for the MPL are in range of 500nm [7].
The bulk porosity (ε) of a GDL is defined as its total pore volume divided by the summation of its total pore volume and its solid volume.
Bulk porosity is expected to affect the effective diffusion coefficient (Deff) of a porous
medium as given by the following relation [1].
Where τ is the tortuosity and D is the bulk diffusion coefficient.
Tortuosity is the crookedness of a pore pattern. It is defined as the ratio of the distance between two points by way of the connected pores to the straight line distance.
17
porosity around 88% when the sample has no MPL. After adding the MPL, the porosity reduces to approximately 82%.
1.1.3 Micro-porous layer
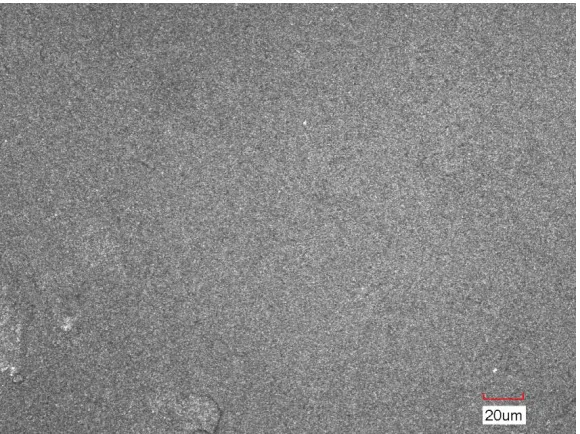
The microporous layer (MPL) is a coating on the macro porous bulk of the GDL. Figure 4 shows the Laser Confocal Microscopy image of a carbon paper with the MPL coating. It has pores of the size of 500nm. Its role in water management is to effectively remove the product water so that the gaseous oxygen can reach the reaction sites through the relatively dry pores [1].The MPL provides a wicking effect for the liquid water to be removed. This is due to the high capillary pressure generated in the pores due to their small size.
[image:18.612.171.461.432.649.2]The MPL improves the electrical conductivity of the porous media but the permeability of this region is significantly less than the bulk region of the porous media, due to the differences in pore sizes and hydrophobicity of the region.
18 1.1.4 Surface wettability
The surface wettability of the different samples of GDL depends on the PTFE content of the sample. With an increase in the PTFE content, the surface wettability tends to decrease, making the GDL more hydrophobic. The surface wettability of the entire sample is heterogeneous in nature. Regions where there is a deposition of PTFE, the sample becomes more hydrophobic compared to the other regions. General values of contact angle for the different samples are θ = 80° for plain GDL and θ = 110° for GDL treated with PTFE.
However, addition of PTFE also creates constriction of pores by closing off some pores and reducing the size of others [8]. This causes a reduction in overall porosity and permeability. The changing surface wettability also results in areas of the GDL which will have hydrophilic properties, and hence have a tendency for water to accumulate in these regions.
1.1.5 Tortuosity
Tortuosity is a property of the path being twisted. It is denoted by τ and is defined as
For high porosity materials, such as GDLs, an appropriate estimation of tortuosity [5] is given as
1.1.6 Water transport mechanisms
19
present inside the diffusion media. However, the mechanism only works in pores of size 10 µm or smaller. Therefore, this mechanism drives the liquid water transport in the MPL, and explains the wicking effect that is observed therein.
The second mechanism observed is permeability of fluid through the porous regions. Permeability is a property of the porous media and is defined by Darcy‟s Law. It is due to a pressure gradient inside the porous medium. However, Mathias et al. [7] explained that permeability is not an important parameter in the through-plane direction as no pressure gradient is wanted between the channels and the catalyst layer. The presence of a pressure gradient in that direction may result in degradation of the fibrous materials and the membrane in particular. However, they did point out that in-plane permeability in the Gas Diffusion layer plays a more crucial role than previously thought. According to them, the in-plane permeability affects the rate at which water vapor is removed from the GDL regions under the land regions of the bipolar plate (BPP). It also affects the rate at which reactant gases are replenished in the same GDL under the land regions. Permeability is governed by Darcy‟s law, which is given mathematically as
20
1.1.6 Directions of mass transport
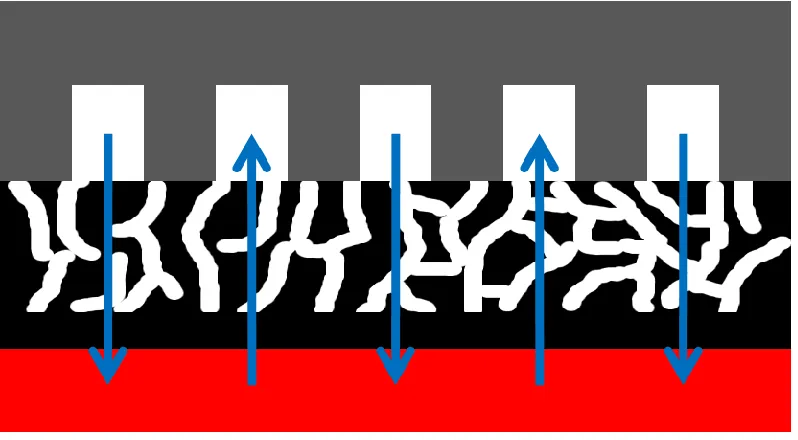
[image:21.612.118.517.309.529.2]When discussing the Gas Diffusion Layer, we may note that there are two primary directions in which the mass transport is likely to occur. First, there is the through-plane direction. This transports reactants from the gas channels to the catalyst and water vapor in the reverse direction, and is seen in figure 5.
Figure 5: Through plane direction of mass transport
21
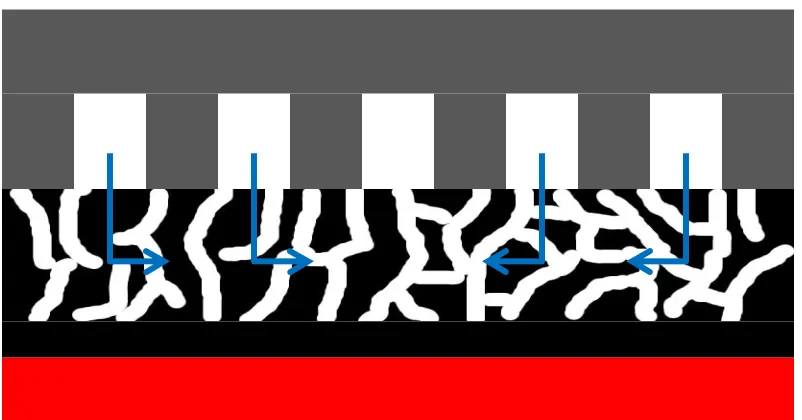
[image:22.612.116.517.158.368.2]case of interdigitated channels and important for both serpentine and parallel channel configuration.
Figure 6: In plane direction of mass transport
It has been mentioned that this transport direction is dominated by the process of diffusion. The other direction of mass transport is in the in-plane direction, shown in figure 6. This is dominated by in-plane permeability. This mechanism is responsible for transferring reactants from the channels to the GDL region under the land. This mechanism is most crucial in the case of interdigitated channels and important for both serpentine and parallel channel configuration.
22
form the porous structure. However, they are aligned in such a manner that the ease of flow for fluids is slightly higher in the in-plane direction compared to the through-plane direction.
1.2 Effects of Temperature
Temperature plays a key role in the operation of PEM Fuel cells. Yan et al. [9] showed that temperature had a significant effect on the performance of the PEM fuel cells. Their work demonstrated that the I-V performance curve was significantly higher when operating temperature was 60⁰C, compared to a cell temperature of 40⁰C.
Additionally, Wang et al. [10] pointed out that an increased temperature, decreases the surface tension, allowing liquid water to enter otherwise hydrophobic regions. This means that the liquid water saturation may be higher at higher temperatures and cut out the reactant transport, which would bring the in-plane permeability into higher relevance.
23
2.
LITERATURE REVIEW
In 2007, when Li et al. [11] reviewed the water flooding issues of the PEM fuel cell, they agreed that water management and flooding mitigation were important to the commercialization of the PEM fuel cell. The task of keeping the membrane hydrated and also avoiding the flooding of the cathode catalyst layer (CCL) becomes even more cha llenging with increasing power densities, and as higher current density is called for.
The performance of the PEM Fuel cell is greatly influenced by the GDL being used and its properties [1]. The properties discussed in the previous section, such as the permeability, electrical conductivity and structural integrity are often conflicting in their trends and therefore a delicate balance must be achieved to extract the best performance from the cell. This issue of water management in the PEMFC has been identified as a key influence on the performance since the 1950s during the initial development of this type of fuel cell by General Electric Company [12].
Different mechanisms have been proposed for the primary mode of transport of water vapor out of the CCL and through the GDL to reach the gas channels. Owejan et al. [13] proposed that the diffusion mechanism assisted with a thermal gradient is sufficient enough to drive the water vapor out of the porous media region of the PEM Fuel Cell. They do mention that the through-plane permeability is insignificant compared to the diffusive transport and hence need not be considered.
24
from the channel to the GDL in interdigitated flow fields and also understanding flow between channels to land region in the case of serpentine flow fields.
Pharoah [14] concluded that the in-plane permeability plays a much more prominent role in fuel cell mass transport compared to the through-plane permeability. In his study, he varied the value of permeability and showed that if a porous material has permeability between 1 x 10⁻¹⁰ m2 and 1 x 10-13 m2 then it would have significant pressure-driven flow. The different GDL samples display permeability within this range and therefore his values prediction of effect of permeability holds true. In this work, Pharoah clearly marks out how some papers have till now avoided the effects of permeability by either explicitly or implicitly ignoring the mechanism of convective transport. This is clear in one of the very early models for the PEM Fuel Cell proposed by Springer et al. [3]
Prasad et al. [15] used numerical modeling and computer simulation to show that the in-plane permeability is an important parameter governing Fuel Cell operation. Their simulation was emulating serpentine flow fields. Among the different flow fields available, the serpentine flow fields have significant advantages, such as avoidance of flow mal-distribution and buildup of reactants in one particular channel [16].
25
leading to an increase in the working temperature inside the fuel cell, especially at the higher current densities.
Considering both diffusion and permeability to be important parameters, as we note from above literature, attention has been paid to research the effects of both permeability and diffusion. A comprehensive literature survey has been completed to identify parameters that are known to affect water transport in the diffusion media.
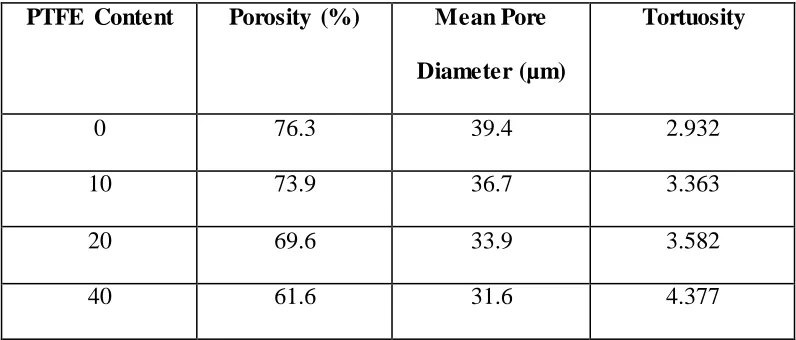
Bevers et al. [8] tested permeability by flowing oxygen through the GDL in the through-plane direction. They varied the percentage of PTFE impregnation and studied the effect that PTFE had on the permeability. They noted that the pressure drop increased with an increase in PTFE indicating a decrease in the permeability. They attributed this decrease in permeability and increase in resistance to flow of gases to the decrease in pore size which was occurring due to the impregnation of PTFE.
26
PTFE Content Porosity (%) Mean Pore
Diameter (µm)
Tortuosity
0 76.3 39.4 2.932
10 73.9 36.7 3.363
20 69.6 33.9 3.582
[image:27.612.116.514.71.241.2]40 61.6 31.6 4.377
Table 1: Porosity and tortuosity of GDL samples with different PTFE impregnation
However, the conclusion on the effect of PTFE on the cell performance is not unanimous. H. Li et al. [11] reported in their review that one group had experienced improved cell performance when their GDL samples were treated with PTFE compared to untreated GDL samples.
Park et al. [19] conducted insitu experiments with GDLs having different PTFE impregnations. Their results showed that PTFE played a very crucial role in the performance of the PEM Fuel Cell. When their GDLs carried 6% PTFE, they underperformed compared to the case where the GDLs carried 20% impregnation. Interestingly, increasing the PTFE content further did not improve the cell performance, as 40% PTFE caused the cell to perform worse compared to both 6% PTFE and 20% PTFE. Thus a crucial balance needs to be maintained regarding the PTFE content for the cell to perform to higher current densities.
27
performance of the cell. Roshandel et al. [18] introduced the concept of how porosity would vary leading to loss in performance. As a result of their numerical investigation they were able to identify how pockets of water would accumulate in the pores of the GDL and result in a lower, non-uniform porosity. The compression applied to hold the cell together during operation also causes a reduction of porosity by up to 32%. This alone can cut down on the reactant transport by about 10%. The land regions are compressed to a greater degree compared to the channel regions and therefore the porosity variation follows a similar trend. Additionally the rate of water production at 0.85 A/cm2 may lead to another loss of porosity by 23%.
Wang et al. [10] studied the relative permeability of the two phases within the gas diffusion layer. Different measurements are taken for different levels of saturation of the GDL. Again, they use the standard Darcy‟s formulation to calculate the permeability of the material after measuring the superficial velocity of the given phase and the respective pressure drop. The mass of water present in the sample is measured and then corre lated to the volume of pores in the GDL to estimate the saturation level. This is a common method of obtaining the saturation of the GDL, though it does not take into consideration the fact that there may be closed pores which would never be filled : obtaining 100% saturation may never be possible using this method. They concluded that an increase in liquid water saturation resulted in higher liquid relative permeability, although the gas relative permeability reduced very rapidly. The gas relative permeability was insignificant as liquid saturation increased to 60%.
28
compressed the GDL to different thicknesses and computed the effective porosity as a function of the original porosity and percentage compression, using the relation
As part of their work, they tested a carbon cloth (Avcarb 1071-HBC), along with two carbon papers, SGL 31BA from Sigracet Inc. and TGP – H 060 from Toray Inc. They concluded that decrease in porosity resulted in a decrease in the permeability of the material, which was found to follow the Carman Kozeny equation quite closely. They also sho wed that the carbon cloth has significantly higher in-plane permeability, compared to the two carbon papers tested in their study.
29
Gurau et al. [22] in their 2007 publication discuss the through-plane and in-plane permeability. They went further in isolating the permeability due to inertial forces and viscous forces for each of the two permeability values. Their results showed that PTFE content could be related to the viscous component of permeability. Their tests showed that the inertial resistances in both the through-plane and in-plane directions were much less, compared to the viscous resistance.
The performance of the PEMFC is also reported to improve with the inclusion of the MPL [23]. It may be included as a separate layer between the GDL and the catalyst layer (CL) although it is often applied as a coating on one side of the GDL. The MPL has pores of the order of a few microns and provides a wicking action to remove the water from t he CL to the GDL. However, this action can be optimized only by ensuring that the MPL is optimized. Q i et al. [24] recommended an optimized MPL from the conclusions drawn from their work.
Ismail et al. [25] studied the effect MPL had on the water vapor transport coefficients. They concluded that increasing the PTFE loading within the MPL allows for improved water transport and improves the permeability of the material, in the through-plane direction. Their work agreed that the through-plane permeability is significantly lower than the in-plane permeability in the bulk structure of the GDL.
Bruggeman [26] in 1935 proposed that diffusion would occur at a lower rate inside porous media compared to the rate of diffusion in free stream. He introduced a term „effective diffusion‟ which would take into consideration the porosity of the material and relate the coefficient of diffusion with that. The Bruggeman correlation is given as
30
Other correlations have since been proposed. Neale and Nader [27] proposed a slight variation which is given as
.
In 2010, Das et al. [28] proposed a similar correlation but more specifically targeted the fibrous porous media popularly used in PEM Fuel Cells. His correlation is given as
( (
))
LaManna and Kandlikar [29][30] conducted studies into the effect of both PTFE and MPL on the effective coefficient of diffusion of the GDL. Their studies concluded that an increase in PTFE content results in a decrease of the coefficient of diffusion. Introducing the MPL also resulted in a reduction of the effective diffusion coefficient. Their studies included three series of GDLs from different manufacturers, including Toray Inc., Sigracet Corp. and MRC. They concluded that Bruggeman and other correlation devised on general porous media exaggerate the effective diffusion in the porous media when tested for GDLs.
31
was no increase in the diffusibility. This was because the increase in effective diffusion coefficient was proportional to the increase in diffusivity of the binary gas pair in open stream. Thus, the GDL was not playing a role in this increased tendency of gases to diffuse. Higher temperatures increased kinetic energy of the gaseous molecules.
We note that the water transport coefficients are quite important and parameters such as porosity, PTFE content and the presence of MPL ha ve had effect on the coefficients. Work has been proceeding to investigate in greater detail, and at more fundamental levels, the reasoning behind the behavior that has been noted in these experiments.
There are some analytical works which have focused on the in plane permeability in the GDL of a PEMFC. Tamayol and Bahrami [32] developed an analytical model relating permeability to the thickness of the pores and the porosity. According to them, these were the primary parameters which influenced permeability. The two parameters take into consideration any additional coatings or layers of treatment applied to the diffusion media.
32
Another study conducted in the 1960s by Currie [34] investigated the effect of temperature and pressure on the gas diffusion in porous media. His work showed significant change in the diffusion with changes in temperature and pressure. As a conclusion, they proposed a correlation to model the changes in the effective diffusion coefficient based on variations in temperature and pressure. The correlations is given as
This study contradicts the findings of Zamel et al. from their 2010 work. It is likely that the work by Curie is based on homogenous porous media whereas Zamel tested with GDL samples which are primarily fibrous porous media.
2.1 Research Needs
33
would lead to more detailed characterization of the GDL materials and lead to improved models for better performance from fuel cell vehicles.
2.2 Objectives
1. Develop a test setup to characterize in-plane permeability. 2. Measure the in-plane permeability for GDL samples. 3. Effect of temperature on in-plane permeability.
4. Effect of PTFE impregnation on in-plane permeability. 5. Effect of MPL coating on in-plane permeability.
34
3.
EXPERIMENTAL SETUP
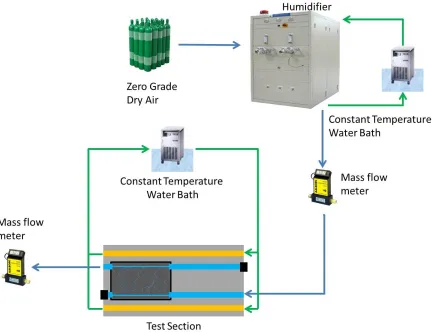
An experimental setup has been developed which allows humidified air to be pumped through the GDL at measured flow rates, thereby allowing us to measure the pressure drop across samples of porous media and obtain the permeability of the material. The setup is capable of both in plane and through plane permeability. The setup has been developed with both diffusion and permeability in mind, though diffusion studies were not carried out as part of this study. The schematic of the experimental setup is shown in figure 7. The different components of the setup are detailed in the following paragraphs.
3.1 Air Supply
The dry air is obtained from bottles of zero grade air. The supplier claims that the air has less than 2 ppm (parts per million) of water vapor present. This means that the water vapor content can be controlled very closely by use of the humidifier.
35
Figure 7: Schematic of the test setup
3.2 Humidifier
36 3.3 Constant Temperature Water Bath
One constant temperature water bath is used in loop with the Arbin humidifier to maintain dew point temperatures and to ensure that the humidity can be maintained at desired levels. The humidifier has heaters designed to control temperature, maintaining desired humidity levels for higher temperatures. However, there is an inherent fluctuation of temperature and the stabilization time is exceptionally long. To avoid the long times required to stabilize the system, a Lauda RE120 chiller has been used to keep the temperature of the humidifier at the dew point temperature required for that particular system temperature.
A second constant temperature water bath is required to maintain the temperature of the test section. For this, we utilize a Thermo Fisher Scientific‟s STANDARD® series water bath, operating at 8.4 LPM. It is capable of maintaining temperature control of ±0.02°C from the set temperature, and can remove 320 watts of heat at room temperature. For purposes of heating, it is capable of heating at 1200 watts while being operated on the standard 115 volts wall socket output. The flow is split, allowing the heated water to pass through both the top and bottom blocks of the test section (explained in the next section).
3.4 Test Section
37
diameter and the exit manifold is again 8 mm in diameter. However, the length of the inlet manifold pipe is 22 centimeters while the exit manifold is just 2 centimeters long.
During past usage of the humidifier, it had been noticed that there is some fluctuation in the temperature of ±5°C. Therefore, as a precaution, we assume that the temperature of the incoming air could be up to 10° lower than the temperature set. This means that we would be able to set the temperature 5° lower than required to avoid overshooting the set temperature. The inlet manifold has a 22 cm length, which has been arrived at by calculation of the length of the manifold assuming a N usselt number of 4. The surface temperature is constant and the flow is assumed to be laminar and fully developed. The tested Reynolds numbers are in the range of 90 to 160, hence the assumption of fully developed laminar flow seems to be reasonable. The Nusselt number assumption has been made based on Shah and London [35] who state that the Nusselt number in rectangular ducts of macroscale to be equal to 3.66 in the case of constant temperature walls and laminar flow.
38
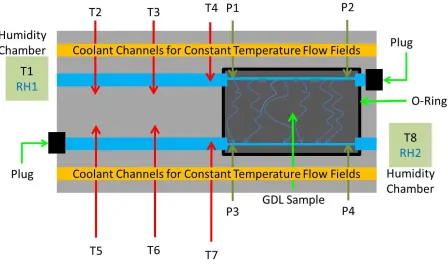
Figure 8: Schematic representation of the test section
The flow within the channel would be in the low Reynolds number range, thus essentially in the laminar region. The tested Reynolds numbers are in the range of 90 to 250. In the case of mini or micro channels, any flow with a Reynolds number less than 1000 can be said to be in the laminar region [36]. The flow rates to be tested for diffusion and permeability in either of the in-plane and through-plane directions are given in table 3.
39
different temperatures, or even the effect of imposing a temperature gradient in favor or against the direction of flow of the gases.
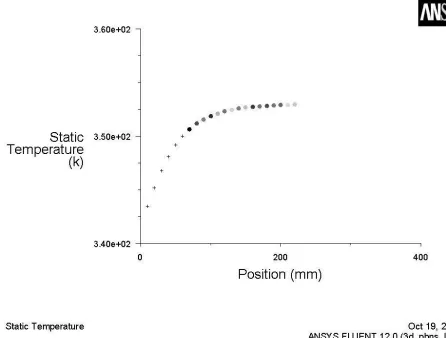
[image:40.612.90.536.232.570.2]8 thermocouples are placed within the aluminum block, which forms the body of the test section, to ensure that the entire system has reached a thermal equilibrium before proceeding to record data.
Figure 9: Simulation results showing development of steady temperature inside the manifold of the setup
40
[image:41.612.101.511.170.553.2]inlet along with the temperature of the gases. The gases then flow through the inlet manifold into the channel. This channel is closed, simulating the interdigitated flow fields used in some PEM Fuel Cells.
Figure 10: Test Section in operation
41
The two readings of humidity need to be equal, to ensure that no condensation occurs inside the channels or the GDL sample. Also, these measurements ensure that the humidity is kept between 90 and 95% which simulates the relative humidity of the incoming gases in the fuel cell. The finished test section in operation is shown in figure 10.
3.5 Data Acquisition
This setup utilizes an SCXI 1000 Chassis connected through a PCI 6221 card. The PCI card being utilized is a multifunction DAQ card and allows the measurement of temperature using the thermocouples as well as measurement of different sensors giving voltage outputs of different ranges.
An SCXI 1102 module has been used for acquisition of data from the thermocouples through an SCXI 1303 isothermal terminal. 8 E-type thermocouples are used for the measurement of temperature at the inlet to the section in the humidity chamber as well as at the humidity chamber at the outlet. 4 thermocouples are used to obtain the temperature of the test section. 2 thermocouples are placed at the inlet to the channel, to determine if the gases are at the desired temperature.
42
range of the sensor and are not affected by the non- linearity present towards the end of the ranges.
43
4.
TEST PROCEDURE
4.1 Test Cases
For us to obtain fundamental understanding o f the factors which affect the water transport parameters in the GDL of a PEM Fuel Cell, it is important to define our test cases in a well-constructed manner. Table 2 gives a summary of all the samples to be tested and the parameters to be investigated as part of each set of testing.
SAMPLES TO BE TESTED PTFE
CONTENT (% ) MPL COATING? PARAMETER INVESTIGATED
TORAY TGP-H 060 PLAIN 0 NO VALIDATION
BASELINE 0 NO
T E M P E R A T U R E
BASELINE 6 NO EFFECT OF PTFE
BASELINE 6 YES EFFECT OF MPL
TORAY TGH-H 120 0 NO EFFECT OF PTFE
TORAY TGH-H 120 10 NO EFFECT OF PTFE
TORAY TGH-H 120 20 NO EFFECT OF PTFE
TORAY TGH-H 120 40 NO EFFECT OF PTFE
SGL 10BA 5 NO EFFECT OF MPL
[image:44.612.85.542.264.576.2]SGL 10BC 5 YES EFFECT OF MPL
Table 2: Samples tested as part of the current work
44
al. [20]. We use the same Toray TGP-H 060 plain GDL sample used by them in their study. By doing so, we ensure that the results are for the same sample and these should match within the error uncertainties of the two investigations.
The Toray TGP-H 120 series has been investigated to study the effects of PTFE impregnation. Toray Inc. has a range of GDLs available in the series with different degrees of PTFE impregnation. The other properties such as thickness and the lack of MPL remain the same in all the samples across the series. The study includes GDL samples from the SGL series manufactured by Sigracet Inc., which are used to test for the effect of MPL coating on the in-plane permeability.
4.2 Leak Testing and Leak Mitigation
In order for the test section and the entire setup to be free from any gas leakages, a number of preventive measures need to be utilized during the experimental routine. After each assembly with a new sample, gas leak detection fluid is used to test for leakages in the system. All flow connections are tested for air leakages.
Another method of observing the flow to ensure major leakages do not occur is by using a flow meter at the exit, as well as the one at the entry for measuring the flow. This enables us to verify whether the flow going in is equal to the flow coming out. This method permits an active observation to be maintained of the flow to mitigate any leakages occurring during the test being conducted, due to the thermal stresses arising from the heating of the test section and the testing gases.
45
without leakages. Finally, if the leakage still remains, the entire test section was disassembled and re-assembled to ensure the leakages had been an error in the assembly and had been corrected.
4.3 Testing Procedure
To test for in-plane permeability, the humidified gas stream needs to come in through one channel, pass through the GDL in the in-plane direction and travel through the exit manifold.
The constant temperature water bath is switched on to allow the test section to reach a constant steady state temperature. The time taken to reach a steady state varies on the temperature. To obtain 40°C it takes approx. 20 minutes from room temperature, whereas 80°C may take up to an hour to reach steady state. The air flow is started. The pressure in the dry air tank is maintained at 40 psig to ensure flow does not fluctuate. The humidifier is also activated, and the dew point temperature is set to ensure proper humidity inside the channel. The temperature of the gas stream increases rapidly and approaches steady state at almost the same time as the test section.
The flow is allowed to increase and achieve steady state. The lowest flow rate to be tested is allowed to run for 20 minutes before recording any data. This is done to stabilize the system.
The flow rates used in the tests are 300 sccm, 400 sccm and 500 sccm. These correspond to the flow velocities (V) of 1.67 m/s to 2.78 m/s. These flow velocities represent the mid-range of flow velocities utilized in operating PEMFCs. These values are used with the viscosity (µ) and density (ρ) of the humidified air in calculating the Reynolds number (Re=ρVDh/µ). Flow
46
the pressure drop data resulting from turbulent flow patterns. Table 3 gives the different flow rates that are run in the test setup and the corresponding Reynolds numbers.
FLOW RATE (SCCM) FLOW VELOCITY (m/s) REYNOLDS NUMBER
300 1.67 96.35
400 2.22 128.46
[image:47.612.82.549.136.253.2]500 2.78 160.58
Table 3: Flow rates used in the investigation and corresponding Reynolds Numbers
Higher flow rates were tried at the end of the test run, but with most samples the pressure drop became unstable.
4.4 Data Reduction
Data is captured by the DAQ described in section 3.5. The data is recorded in .lvm files which are standard output files from LabVIEW®. They are easily accessible with any standard spreadsheet software. Temperature data is averaged to obtain the temperature of the test section. Thermocouple data from the inlet manifold dictate the temperature of the gases. Viscosity of the gases is a function of the temperature; therefore a curve fit is obtained to calculate the different temperatures.
Darcy‟s Law is commonly used to obtain the values of permeability for porous media. The same is used for my data reduction as well. The mathematical formulation is given as
47
The volumetric flow rate (W) is measured before the gases flow into the test section. Area of cross section is calculated from the compressed thickness of the GDL and the length of the channels. Viscosity is calculated as a function of the temperature. Pressure drop is measured across the GDL and also along the channel. It is noticed that the channel pressure drop is insignificant, compared to the pressure drop across the GDL, and therefore may be neglected. The term L signifies the length of path needed to be traversed through the porous media. In the current study, this would be the distance between the two channels.
The DAQ records at 100Hz and writes at 10Hz after averaging the data. Thus we have an averaged value of the temperature and pressure values at the outset.
All the values obtained are plugged into a spreadsheet which has been prepared with the formulae fed in to quickly process the data. The permeability is given as an output in Darcy. 1 Darcy is equal to 10-12 m2; therefore, it is possible to transfer between the more popular unit of Darcy and the SI units.
4.5 Validation
Prasad et al. [20] investigated the effect of porosity. For changing the porosity of the samples, they changed the hard stop shims used to control the compressed thickness of the GDLs. This changed the compressed thickness of the GDLs. The more the GDLs were compressed, the thinner they were and by Carman Kozeny law, the less porous they became.
48
[image:49.612.94.504.221.560.2]Figure 11 shows the comparison of my current data with that of Prasad et al. [20]. The figure also includes the data of Gostick et al. [21]. Although the sample they used is not identical, it is very similar in its porosity, the only difference being the thickness of the sample. The data generated as part of the current work shows good agreement with both the available literature.
49
5.
UNCERTAINTY ANALYSIS
The system makes use of three types of sensors and a flow meter. There is an uncertainty
associated with each measurement. Each type of sensor also has to be calibrated to ensure
confidence on the data generated by them. This sub-section examines the calibration of each
sensor, while the next one evaluates the uncertainty associated with the data generated.
5.1 Systems Calibration
The three types of sensors to be calibrated are thermocouples, electronic pressure transducers
and electronic humidity sensors.
5.1.1 Thermocouple Calibration
The setup uses low noise pre-manufactured E-type thermocouples for fast response time and
high accuracy from 0 – 100⁰C. Each thermocouple is calibrated using the in-house
thermocouple calibrator obtained from OMEGA Inc. model no. HOT POINT® CL900. A 5
point calibration is carried out to ensure optimal accuracy.
The most important thermocouple in the system is the one measuring gas temperature at the
inlet to the test region. This is the temperature used to calculate the viscosity of the fluids
percolating through the system. The bias error is 0.6%, while precision is more reliable at
0.06%.
5.1.2 Pressure Sensor Calibration
The setup requires 4 pressure sensors. PX26 series electronic pressure transducers from
OMEGA Inc. have been used. An in-house pressure calibrator obtained from OMEGA Inc.
has been used to calibrate the pressure sensors. A 5 point calibration has been implemented
50
These pressure sensors have an inherent bias error of up to 10% while the precision remains
at 0.5%. This is a large contributor to the uncertainty of the system, and should be improved
in future experiments on similar lines.
5.1.3 Humidity Sensor Calibration
For measuring the humidity of the system, HIH 4602C sensors from Honeywell are used.
They have an accuracy of 3.5% and a precision of 0.5% RH. However, they do not actively
participate in the uncertainty of the system as they are not used as an input to obtain the
permeability using Darcy’s law.
Instead, the primary purpose of the humidity sensors is to monitor the flow condition. We
would require the system to maintain a high humidity of about 90 – 95% to emulate the flow
conditions of the real fuel cell gas channels. However, we would have to restrict the humidity
from rising to 100%, to avoid condensation to take place, leading to larger pressure drops and
lower values of permeability due to blocked pores in the GDL samples.
The two humidity sensors are used at the inlet and at the exit to ensure the humidity remains
constant throughout the system. Also, by requiring the inlet humidity and the outlet humidity
to remain equal, we could confidently claim there is no condensation taking place within the
GDL sample and that all the pores are available for the flow of gases through.
The humidity sensors are mounted in chambers manufactured in-house, to ensure the
moisture content stabilizes for the noise of the system to be minimized and for the system to
51
5.2 Uncertainty Analysis
To obtain the confidence with which we may measure the in-plane permeability using this
system. The uncertainty of a system is calculated using the following equation
√( ) ( )
U is the uncertainty of the system. B is the bias errors, σ is the standard deviation associated
with the measurement, while N is the total number of individual measurements that are made,
which are then averaged to determine the final value.
All the errors associated with each reading are fed into a spreadsheet which then generates
the uncertainty associated with each measurement. These are then recorded on the results plot
as error bars. The error in the readings varies from 7% to 10% based on the zero errors in the
DAQ during running of some experiments. Each data set has the same percentage error as
they were taken in a single run of the DAQ without shutting down the equipment and
52
6.
RESULTS AND DISCUSSION
In the previous section, we saw the data analysis and the validation of the test section. In this section, we present the data obtained and present an analysis of the effects that have been observed. In addition, we attempt to delve into the reasons which may cause observed effects.
Table 2 presents the different properties of the GDL samples which have been tested. It may be used as a reference when investigating the different parameters which affect the in-plane permeability of the GDL samples. Table 3 gives the details of the tested compression and porosity for each of the different samples investigated in this study. This shows that the percentage compression for all the samples is within a 5% range while the compressed porosity varies significantly. This also explains some of the difference in per meability which is noted between the different GDL samples.
Sample Name
Original Thickness
(µm)
PTFE Hard Stop Used (µm) Original Porosity (%) Compressed Porosity (%) Percentage Compression
Baseline 205 178 86.73
Baseline w/ PTFE
205 178 86.73
Baseline w/ MPL
230 178 Toray
TGP-H 120 0%
370 305 78 73.29 82.38
Toray TGP-H 120 10%
370 305 78 73.29 82.38
Toray TGP-H 120 20%
370 305 78 73.29 82.38
Toray TGP-H 120 40%
370 305 78 73.29 82.38
Toray TGP-H 060 0%
190 152 78 72.57 80.21
[image:53.612.85.547.416.703.2]SGL 10BA 400 330 88 85.46 82.55 SGL 10BC 400 330 82 78.2 82.55
53 6.1 Parameters affecting permeability
Some parameters that have been known previously to affect the permeability of a material, and have been used in modeling of porous materials include the porosity and the pore size. Tamayol and Bahrami [32] used the parameters of pore size and the fiber dia meter of the porous material to model the GDL material in their study. Another parameter known to affect the permeability of materials is the surface tension / surface energy of the material itself. However, this is only of relevance when we are discussing liquid permeation. In discussing gaseous permeation, the effect of surface energy may be neglected as the forces are much less compared to other parameters.
Some other parameters include the pore structure itself. Some porous materials may be easily modeled as capillary tubes going from one side to the other, while materials such as carbon paper used as GDL samples are more difficult to model due to the anisotropic nature of their structure. Also playing a key role is the tortuosity of the porous material. A highly tortuous material is likely to decrease the permeability of the material and vice versa.
Although not directly a property of the base material, but any parameter such as PTFE content or presence of liquid water inside the GDL is also likely to play a role in changing the permeability of the samples.
6.2 Effect of Temperature
All the samples were subjected to testing with different temperatures. Each sample was tested
at 4 temperatures, including room temperature (~25⁰C), 40⁰C, 60⁰C and 80⁰C. The results
from the baseline samples are plotted on figure 12. We observe a distinct tendency for the
54
Figure 12: Temperature Effect on Baseline GDL Samples
We begin by testing baseline samples manufactured by Mitsubishi Rayon Corporation, which
include a plain baseline sample with no PTFE content and no microporous layer, baseline
sample with 6% PTFE impregnation and a baseline sample with 6% PTFE and coated with
an MPL by General Motors Electrochemical Energy Research Laboratory.
All the baseline samples show distinct tendencies of increased in-plane permeability as we
increase the temperature. With increasing temperature it is hypothesized that the pores
55
tends to decrease as the temperature increase [10]. Ergo, there is less resistance to the flow of
vapor with increasing temperature and hence the in-plane permeability tends to increase with
increasing temperatures. Another explanation for the increased permeability on raising the temperature of the system is the buildup of localized pressure.
[image:56.612.110.519.314.656.2]The next series to be examined are the GDL samples from Sigracet Corporation. The SGL series of samples have been tested and represented in the plot of figure 13. As observed for the baseline samples, the SGL GDL samples show an increase in permeability with temperature.
56
Next we look at the samples from Toray Inc. The series TGP-H 120 has been tested with
different PTFE content. The effect of temperature on the different Toray samples is displayed
in figure 14. The plot shows four samples from the Toray TGP-H 120 series with PTFE
content of 0%, 10%, 20% and 40%. The data from Toray TGP-H 120 with 20% PTFE has
only two points whereas at higher temperatures of 60°C and 80°C the pressure would not
stabilize leading to unstable data points. These have been removed from the plot. The
instability was observed from the inability of the system to arrive at a steady state with
[image:57.612.134.499.305.607.2]respect to the pressure sensors.
57
From the above plots, it is evident that the increase of in-plane permeability with increased
temperature is a trend observed uniformly in GDL samples from a range of manufacturers.
This may then be attributed to a restructuring of the pores such that othe rwise closed pores
expand allowing some air to pass through and hence improve the permeability. Another
reason behind the increasing permeability could be closing off of small pores due to
expansion, resulting in localized regions of high pressure.
The other explanation concerns the effect of temperature on the mean free path of the gas molecules. At higher temperatures, the molecules have a longer mean free path and travel more freely, thus introducing lower pressure drops to be observed for the same poros ity. This means that the energy of the molecules increases at the higher temperatures and thus it is easier for them to pass through the porous material. Although the increased viscosity of gases at higher temperatures is expected to account for these changes, the effect introduced due to small pore sizes is perhaps not accounted completely in the case of porous media with microscopic pore structures. This aspect needs to be further investigated to provide a more robust explanation for the observed effect of increased permeability with temperature.
6.3 Effect of Porosity
To consider the effect of porosity, we use the Toray TGP-H 060 series without any PTFE
content. The porosity is changed on the basis of Carman-Kozeny law which relates the
porosity to the compression by using a relation between the uncompressed thickness and the
58
Hard stop materials of different thicknesses were used to control the compressed thickness of
the sample. Three different hard stops are used to compress the GDL to the respective
[image:59.612.135.496.217.526.2]compressions.
Figure 15: Effect of porosity on the in-plane permeability of GDL samples
The porosity changes accordingly. The in-plane permeability is measured using the same
method as described in section 4.4. As seen in figure 15, we observe that with increasing
porosity the permeability increases exponentially. Therefore, it may be concluded that the
59
6.4 Effect of PTFE Impregnation
Investigating the effect of PTFE impregnation on the water transport required GDL samples
identical in all other respects, but with differing PTFE content. By this process, we would be
able to associate any changes in the permeability to the change in PTFE content and reduce
any uncertainty. For this purpose, we utilized the TGP-H 120 series of GDLs from Toray Inc.
This series of GDLs contain no MPL layer and are of 370μm thickness. They are
manufactured using the same process. They are loaded with PTFE to different extent,
although the remaining parameters are all the same.
From Lobato et al. [18], it is evident that there is a decrease in the permeability of the
samples with increase in PTFE content. This is quite expected as we note from table 1 that
the porosity decreases with increased PTFE content. This is due to the PTFE taking up more
of the void space as greater percentages are deposited. This as we know from our work on
porosity, leads to reduced permeability. In our study, we attempt to verify if the same
increase in PTFE content also reduces the in-plane permeability of the samples. Four samples
have been tested for the same purpose, first one without PTFE, the other having 10%, 20%
and 40% impregnation respectively. Figure 16 gives the comparison of the in-plane
60
Figure 16: Effect of PTFE on the In-Plane Permeability of GDL Samples
6.5 Effect of MPL coating
To study the effect of MPL coating, GDL samples from Sigracet Corp.’s SGL 10 series are
used. SGL 10BA and SGL 10BC are identical except for the MPL coating on 10BC. This
means that all other effects such as those of PTFE, thickness and manufacturing techniques
are all identical and the only distinguishing parameter would be the MPL coa ting. All the
samples mentioned in this study of effect of MPL have a PTFE content of 5%.
61
Figure 17: Effect of MPL on the In Plane Permeability
From this we see that there is very little difference between the sample with an MPL coating
and a sample without the MPL coating. Any difference lies within the error range and thus
may be ignored. Thus, we see that the MPL has negligible effect on the in-plane permeability
of a GDL sample.
This result is quite expected and can be explained with the help of figure 18. The difference
between the permeability of the samples with and without MPL may be attributed to the
thickness of the MPL. The MPL is less porous compared to the bulk GDL and does not
compress to any significant degree. Hence, when we compress the GDL, the thickness of the
MPL becomes more prominent. Thus the effective area available for the gases to permeate in
62
Figure 18: In-plane Permeability with MPL
As we see in figure 18, the in-plane permeability passes through the bulk of the porous media
and is not affected by the MPL. The MPL provides a greater resistance to the flow of gases
compared to the bulk structure of the GDL. Hence, the gases prefer to take the path of least
resistance through the GDL rather than penetrating the MPL. Thus the presence of the MPL
plays no role in the in-plane permeability, other than reducing the available thickness for
63
7.
CONCLUSIONS
An ex-situ test setup was developed for the investigation of water transport co-efficient
inside the Gas Diffusion Layer of the Proton Exchange Membrane Fuel Cell. The current
work evaluates the in-plane permeability of the GDL and studies effect of temperature and
the variations caused by PTFE impregnation and MPL coatings which are quite popular
while using the GDL for water management inside the fuel cell. Being an ex-situ experiment,
a large number of unknowns present in the in-situ have been removed. The setup has a large
number of controlled parameters allowing us to measure the unknowns with better accuracy.
The findings of the current work will lead into the development of a 2-dimensional water and
thermal transport model of the PEM Fuel Cell. The transport co-efficient obtained in this
experimental work will form a component of the water vapor transport in the model. This
would lead to a model which would hold at different operating temperatures and would be
more valuable to the fuel cell community.
This setup has been used to measure the in plane permeability and the following conclusions
may be drawn as a result of the current work.
i) EFFECT OF TEMPERATURE – It has been observed that with an increase in
temperature, the in-plane permeability has increased. A total of 9 samples have
been reported with the same trend. The increase differs based on the samples, and
may be attributed to other parameters. Increase in the samples range from 2% to
24% across different GDL samples. Samples with PTFE show a lower percentage
increase with temperature compared to samples without PTFE content. The
64
changes in pore structure with increase in temperature. Another reason attributed
by previous authors includes the increased mean free path for gaseous molecules
with higher temperatures, leading to higher permeation through porous materials.
ii) EFFECT OF POROSITY – Increase in porosity leads to more void spaces for
the gases to pass through. This means the resistance to flow of gases should
decrease. We observe that this is indeed the case, and that the in-plane
permeability has increased rapidly with an increase in porosity. This has been
shown previously in literature and is re-iterated in this work.
iii) EFFECT OF PTFE CONTENT – The current work displays the trend that
increase in PTFE content causes a decrease of in-plane permeability of the GDL.
The deposition of PTFE into the porous GDL material results in the void spaces
of the pores being filled by the Teflon. This leads to the reduction in porosity of
the samples. As we have already established, any reduction in the porosity creates
a decrease in the permeability. Thus we may establish that the reduction in
permeability is due to the reduction in area available for the passage of gases
through the GDL.
Another observation from the study of PTFE content is that the effect of PTFE is
much more pronounced compared to the effect of temperature. Whereas most
samples showed an increase in permeability of around 10% from room
temperature to 80°C, the effect of PTFE was to decrease the permeability by 28%
even when the impregnation was only 10%.
iv) EFFECT OF MPL COATING–From the samples tested in the current work, it
65
permeability. As we have discussed, the microporous layer is further from the gas
channels, compared to the GDL with macro sized pores. Therefore the MPL has
no effect on the in-plane permeability in the gas diffusion layer of a PEM Fuel
66
8.
FUTURE WORK
The current work has considered the in-plane permeability and how it is affected by changes in temperature. Particular focus has been on the temperatures at which the PEM Fuel Cell works with highest efficiencies. The test setup was designed to be capable of much more testing, which unfortunately was not done due to lack of time and the scope of this thesis. Such investigations may be conducted without many modifications to the setup and are listed below with short descriptions.
i) Through Plane Permeability – The temperature effects need to be explored, as the literature survey showed the effect of temperature had not been considered in the case of permeability through the GDL.
ii) Though Plane Diffusion – We observed contradicting literature relating to the diffusion and the effect of temperature. This segment of GDL characterization has been left without much attention and needs to be examined.
iii) In Plane Diffusion – Although most studies look at through-plane diffusion, in-plane diffusion may play a role and is important to the characterization of the materials. Therefore, the in-plane diffusion needs to be investigated. The current setup, with slight modifications, can be used for this purpose.
67
v) Thermally opposed diffusion – In emulating a real fuel cell, diffusion of water vapor takes place in the direction when thermal gradient supports the transport of water vapor. However, in the case of the reactants, the diffusion is being opposed by the thermal gradient. Therefore the diffusion of oxygen in nitrogen needs to be evaluated in a negative thermal gradient condition.
68
9.
References
[1] L. Cindrella et al., “Gas diffusion layer for proton exchange membrane fuel cells--A review,” Journal of Power Sources, vol. 194, no. 1, pp. 146-160, 2009.
[2] C. Bao, M. Ouyang, and B. Yi, “Modeling and control of air stream and hydrogen flow with recirculation in a PEM fuel cell system--I. Control-oriented modeling,”
International Journal of Hydrogen Energy, vol. 31, no. 13, pp. 1879-1896, 2006. [3] T. E. Springer, T. A. Zawodzinski, and S. Gottesfeld, “Polymer electrolyte