Strong effects of coral species on the diversity
and structure of reef fish communities: A
multi-scale analysis
Valeriya Komyakova1,2¤*, Geoffrey P. Jones1, Philip L. Munday1
1 ARC Centre of Excellence for Coral Reef Studies, and College of Marine and Environmental Sciences, James Cook University, Townsville, QLD, Australia, 2 Department of Zoology, University of Melbourne, Melbourne, VIC, Australia
¤ Current address: Pelagic Group, Institute of Marine Research, Bergen, Norway
*Valeriya.Komyakova@gmail.com
Abstract
While there is increasing evidence for habitat specialization in coral reef fishes, the extent to which different corals support different fish communities is not well understood. Here we quantitatively assess the relative importance of different coral species in structuring fish communities and evaluate whether sampling scale and coral colony size affect the per-ceived strength of fish-habitat relationships. Fish communities present on colonies of eight coral species (Porites cylindrica, Echinopora horrida, Hydnophora rigida, Stylophora
pistil-lata, Seriatopora hystrix, Acropora formosa, A. tenuis and A. millepora) were examined in
the Lizard Island lagoon, Great Barrier Reef, Australia. Additionally, the differences in fish communities supported by three coral species (P. cylindrica, E. horrida, H. rigida) were investigated at three spatial scales of sampling (2x2 m, 1x1 m, 0.5x0.5 m). Substantial differ-ences in fish communities were observed across the different coral species, with E. horrida and H. rigida supporting the most fish species and individuals. Coral species explained more of the variability in fish species richness (20.9–53.6%), than in fish abundance (0– 15%). Most coral species supported distinctive fish communities, with dissimilarities ranging from 50 to 90%. For three focal coral species, a greater amount of total variation in fish spe-cies richness and fish abundance was evident at a larger scale of sampling. Together, these results indicate that the structure of reef fish communities is finely tuned to coral species. Loss of preferred coral species could have profound effects on reef fish biodiversity, poten-tially more so than would be predicted on the basis of declining coral cover alone.
Introduction
Habitat characteristics are known to play a key role in structuring natural communities [1–2]. In many ecosystems, living organisms create biogenic habitat that provides critical resources for a wide variety of mobile species. For example, terrestrial forest biomes form the habitat structure essential for the survival of many insects, birds and mammals [3–5]. Likewise, a1111111111
a1111111111 a1111111111 a1111111111 a1111111111
OPEN ACCESS
Citation: Komyakova V, Jones GP, Munday PL
(2018) Strong effects of coral species on the diversity and structure of reef fish communities: A multi-scale analysis. PLoS ONE 13(8): e0202206.
https://doi.org/10.1371/journal.pone.0202206
Editor: Heather M. Patterson, Department of
Agriculture and Water Resources, AUSTRALIA
Received: January 27, 2018 Accepted: July 29, 2018 Published: August 13, 2018
Copyright:©2018 Komyakova et al. This is an open access article distributed under the terms of theCreative Commons Attribution License, which permits unrestricted use, distribution, and reproduction in any medium, provided the original author and source are credited.
Data Availability Statement: All relevant data are
available at doi:10.5061/dryad.b305f.
Funding: This research was supported by the
Australian Research Council Centre of Excellence for Coral Reef Studies (CE0561342) (www. coralcoe.org.au). The funders had no role in study design, data collection and analysis, decision to publish, or preparation of the manuscript.
Competing interests: The authors have declared
macro-algae and seagrasses have a similar habitat-forming role in freshwater and temperate marine ecosystems [6–7]. Numerous studies have examined relationships between the abun-dance of focal species and the areal cover of biogenic habitat [8–10], however, the strength of these relationships may depend on the level at which organisms discriminate among habitat types [11–12]. If focal organisms are highly specialised and discriminate among habitat-form-ing species, then habitat availability should be measured at the species level. In addition, the strength of the relationships between organisms and their habitat may depend on the scale of sampling [13]. Organism-habitat relationships may be obscured if inappropriate taxonomic resolution or spatial scale of sampling are applied [14–16]. Therefore, to understand popula-tion and community responses to degrading habitats, it is necessary to understand these spe-cies and scale-specific phenomena.
On coral reefs, the complex structure of scleractinian corals produces a diversity of habitat types that provide shelter, food and sites for reproduction for other reef organisms [17–19]. Coral cover is often considered the key variable that influences the abundance of coral-reliant organisms [8,20]. However, there is increasing evidence that many organisms preferentially associate with particular coral species or coral morphologies at critical stages of their develop-ment [12,19,21–24]. For example, Bonin [23] demonstrated that new recruits of at least four damselfish species (Chrysiptera parasema,Pomacentrus moluccensis,Dascylus melanurusand
Chrosmis retrofasciatus) had a strong preference for a limited number ofAcroporaspecies. Hence, measures of overall coral cover may fail to detect species-specific habitat associations that are important in explaining the diversity of reef communities.
Some studies have shown that the presence of different coral species influences the structure of fish communities and identified the characteristics of the corals likely to be responsible for these differences [21–23,25–26]. For example, Messmer et al. [26] identified several coral spe-cies that tend to support more diverse fish communities (e.g.Acropora nasutaandSeriatopora hystrix). The physical characteristics of coral species that attract and support a high diversity and abundance of fishes may relate to the branching structure of the coral colonies [21–22,
25]. In general, structurally more complex habitats tend to support more diverse and abundant animal communities by providing a greater variety and number of refuge sites, which in turn can decrease encounter rates between competitors as well as between predators and their prey [27–29]. Consequently, structurally complex coral species are predicted to support richer and more abundant fish communities.
The observed relationships between fish diversity or abundance and the structure of the coral community may also be dependent on the spatial scale of sampling. At very small spatial scales of sampling, fish-habitat associations may appear to break down due to patchy distribu-tion of individuals [15,30]. In contrast, at a large spatial scale, habitat patchiness can become homogenised and other environmental characteristics, such as depth and currents, become more important in structuring fish communities [14–16,21]. Therefore, the spatial scale of sampling of different corals could have a significant effect on the perceived relationships between the coral community structure and the structure of fish communities [31].
The overall aim of this study was to assess the influence of coral species, sampling scales and coral colony size in structuring reef fish communities. We compared the abundance and richness of fish assemblages at Lizard Island on the Great Barrier Reef across a range of com-mon coral species to determine if:
1. Some coral species support more diverse and abundant fish communities than others. We hypothesised that fish diversity and abundance would be associated with coral structural complexity, with coral species that have a complex branching structure supporting more diverse and abundant fish communities than those with a less complex branching structure.
2. The spatial scale of sampling affects the observed relationships between coral species and fish species richness and abundance. We predicted that fish-coral species associations would be less evident at smaller scales, however the performance of specific coral species would remain consistent irrespective of the scale
3. Different coral species tend to accumulate fish species richness and abundance at different rates as colony size increases. We hypothesized that more structurally complex corals would accumulate fish species richness and abundance at faster rates than less structurally complex corals.
Materials and methods
Ethics statement
This study was conducted in accordance with Great Barrier Reef Marine Park Authority requirements for non-extractive research and was compliant with the James Cook University Code of Conduct for Research in the Great Barrier Reef. An authorisation for this limited impact, non-extractive research in the Great Barrier Reef Marine Park was obtained from James Cook University (Authorisation letter number: MBA5). This research did not involve any endangered or protected species and no animals were sampled. This study was conducted in compliance with the James Cook University Ethics Review Committee regulations (Ethics approval project number: A1124).
Study location
The study was conducted within the lagoon of Lizard Island, northern Great Barrier Reef (14˚ 40’S, 145˚28’E), QLD, Australia between November 2006 and January 2007. The Lizard Island lagoon is relatively shallow with a maximum depth of approximately 15 meters and with the majority of reefs situated in three to six meters depth. The lagoon is sheltered from the prevail-ing southeast swell and has well developed reefs around its margins.
Sampling design
Coral structural characteristics. To determine if some species of coral support more
diverse and abundant fish communities than others, we compared fish community structure among eight of the most commonly occurring coral species in the Lizard Island lagoon:Porites cylindrica,Echinopora horrida,Hydnophora rigida,Stylophora pistillata,Seriatopora hystrix,
multiple colonies of each study coral species. These measurements were used to classify corals as species with high and low structural complexity. Inter-branch space of 8–16 colonies of each of the eight coral species were measured to determine if there were significant differences in physical characteristics. Additionally, the branch length was measured for the six coral spe-cies with a branching morphology:A.formosa,E.horrida,H.rigida,P.cylindrica,S.hystrixand
S.pistillata. Ten random distances between branch tips and the length of ten randomly selected branches were measured to the nearest millimetre using callipers or a ruler for longer
branches. Corals were randomly sampled from around the lagoon of Lizard Island.
ANOVA and Kruskal-Wallis tests were used to examine differences in branch length and inter-branch space, respectively, among the coral species. The mean of ten branch lengths (six coral species) was calculated for each coral colony before performing ANOVA. Branch length was log10 transformed to meet the assumptions of normality and homoscedasticity (Section A inS1 Supporting Information). The mean of ten inter-branch spaces (eight coral species) was also calculated for each coral colony before performing nonparametric independent samples Kruskal-Wallis test, as the data did not meet the assumptions for ANOVA (Section A inS1 Supporting Information). The analysis was performed using SPSS.
Fish community structure and coral species. To determine if some species of coral
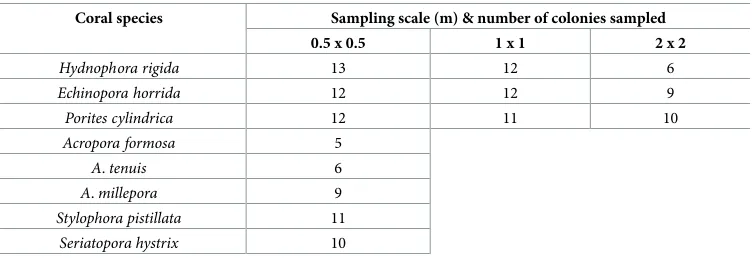
sup-port more diverse and abundant fish communities than others, we compared fish community structure among the eight coral species selected for the study (listed above). A minimum of five haphazardly selected colonies of each coral species were sampled at 0.5 x 0.5 m spatial scale (Table 1). Only colonies that showed no obvious signs of disease, bleaching or partial mortality were used. The fish assemblage occupying each coral colony (up to 0.5 m above the colony) was surveyed visually for a maximum of six minutes. During the first three minutes all the larger and more obvious fishes were counted from a distance of approximately one meter. For the following three minutes the spaces between branches were carefully and systematically searched for cryptic fish species. Only individuals that appeared to use the coral head or hov-ered above the coral head for the entire time of the observation were recorded. Fish that swam past the coral head during the observation period were not counted. Individuals were identi-fied to species level and a life stage for each individual was recorded (adult, juvenile, new settler).
[image:4.612.201.577.570.699.2]Fish species richness, total fish abundance, and fish community structure were compared among the eight coral species that were sampled at 0.5 x 0.5 m. ANOVA was used to test for significant differences in fish species richness and total fish abundance among the eight coral species. Fish species richness and fish abundance were log10 transformed to meet assumptions of normality and homoscedasticity (Section B inS1 Supporting Information). The analysis was performed using SPSS.
Table 1. Number of coral colonies sampled at three different scales.
Coral species Sampling scale (m) & number of colonies sampled
0.5 x 0.5 1 x 1 2 x 2
Hydnophora rigida 13 12 6
Echinopora horrida 12 12 9
Porites cylindrica 12 11 10
Acropora formosa 5
A.tenuis 6
A.millepora 9
Stylophora pistillata 11
Seriatopora hystrix 10
A similarity percentage analysis (SIMPER) and a distance-based permutational multivariate analysis of variance (PERMANOVA) on a Bray-Curtis similarity matrix were used to compare fish assemblage structure among coral species. The 16 most abundant and frequently occur-ring fish taxa (minimum of 4.5% contribution to the abundance and frequency of occurrence of individuals for at least one coral species) were used in the multivariate analysis. Life stages of each fish taxa (new settlers, juveniles and adults) were considered separately in the analysis. Some fish species/age groups could not be identified to species level or occurred with low fre-quencies or abundances, but belong to a common genus or family. The data for these fish spe-cies were pooled together to form higher classification groups:Gobiodon, Pomacentrids, Pomacentrid juveniles, Labrids, Other Juveniles and Other New Settlers. Further pair-wise PERMANOVA tests were conducted as a post hoc test to identify which coral species were sig-nificantly different from each other in fish community structure. The data for this analysis were fourth root transformed prior to analysis to reduce the influence of extreme values of highly abundant fish species. Unrestricted permutations of raw data (9999) and Type III sums of squares were used to generateP-values due to the unbalanced design.
Bootstrapped values were calculated over 100 replications per coral species. The relation-ship between fish assemblage and individual coral species was visually explored using a non-metric multidimensional scaling (nMDS) plot where bootstrapped values and 95% confidence intervals were calculated over 100 replications per coral species. All multivariate analyses were performed using PRIMER v.6 and PERMANOVA+ [37–38].
Fish community structure and spatial scales of sampling. To determine if the spatial
scale of sampling influenced the relationship between fish community structure and coral spe-cies identity, single-spespe-cies coral stands ofP.cylindrica,E.horridaandH.rigidawere surveyed using three different sized quadrats (i.e., 2x2 m, 1x1 m and 0.5x0.5m). The spatial scales were selected based on the site attached behaviour and relatively small home ranges of the majority of the encountered fish species and on the availability of the study coral stands. Due to differ-ences in growth forms, these were the only three of the eight coral species that could be sam-pled at all three spatial scales. A minimum of six haphazardly selected healthy colonies of each coral species were sampled at each spatial scale (Table 1). In most instances, individual coral colonies that closely matched one of the sampling scales were chosen. The size of each coral colony was estimated with a measuring tape. In a few instances (2x2 m scale only), the area surveyed was a portion of a larger coral colony. In these instances, a 2x2 m quadrat was hap-hazardly placed over the coral to delineate the sample area. Each coral colony was sampled at only one spatial scale. Fish assemblages were quantified as described above. Additionally, water depth and reef zone within the lagoon were recorded for each sampled coral.
A regression tree approach [39] was used to explore and describe the relationships between coral species, fish species richness and fish abundance at the three different scales. Depth and reef zone were also included in the analysis to account for their potential effects on the fish variables. Fish abundance was log10 transformed to reduce the influence of extreme values (Section C inS1 Supporting Information). Absolute deviations were used to estimate tree branching and the size of trees was selected by cross-validation, choosing the tree with the smallest estimated predictive error. Regression tree analysis was used because it is suited to the exploration of relationships between ecological communities and multiple environmental vari-ables and where the sampling of varivari-ables may be unbalanced, where missing values occur, or where there are non-linear relationships between the ecological community and the environ-mental variables [39]. The analysis was performed using the TreesPlus (S-Plus) statistical com-puter package [39].
Fish community structure and coral colony size. To determine if different coral species
size we compared the relationship of these traits to colony size for the three coral species for which a range of colony sizes was available:P.cylindrica,E.horridaandH.rigida. Colony max-imum height, width and length were measured to the nearest centimetre. All fish present within the colony and up to 0.5 m above it were counted. The branches of each colony were carefully searched for cryptic species.
ANCOVAs were used to test how fish species richness and fish abundance scaled with coral colony size among the three coral species. Each fish variable was considered as a dependant variable while coral species and colony size were categorical and continuous predictors, respectively. OnlyP.cylindrica,E.horridaandH.rigidaexhibited sufficient variation in coral colony size to be included in this analysis. Fish abundance and colony size (expressed as colony average diameter) were log10 transformed to meet the assumptions of normality, homoscedas-ticity and linearity (Section D inS1 Supporting Information). The analysis was performed using Statistica v8.
Results
Coral structural characteristics
The eight coral species examined differed in their average inter-branch space (Kruskal-Wallis, Chi-Square = 374.44, p<0.001). A post hoc Tukey HSD test showed thatA.formosahad sig-nificantly larger inter-branch distance than the other seven coral species (x= 66.5 mm, p<0.05) andA.tenuishad the smallest interbranch distance among the eight studied coral species (x= 18.8 mm, p>0.05). There was no significant difference in branch length between
A.tenuis,A.millepora,S.hystrixandS.pistillata(p>0.05).P.cylindrica,H.rigidaandE. hor-ridahad an intermediate branch length. The branch length ofP.cylindricaandH.rigidaalso did not differ significantly fromS.pistillata(x= 27.9 mm, p>0.05) (Fig 1A).
The six branching corals differed significantly in their branch length (ANOVA, F5,87= 13.815, p<0.001). The Tukey HSD test showed thatA.formosahad significantly longer branches than the other five coral species (x= 106.2 mm, p<0.05).S.hystrixhad the shortest branch length (x= 37.5 mm). The branch length ofS.hystrixwas significantly shorter than
E.horrida(x= 64.9 mm) andA.formosa, but not the other four coral species (Fig 1B).
For the purposes of this study, corals with intermediate branch length and inter-branch dis-tance (E.horrida,H.rigida,P.cylindrica) were considered more structurally complex than cor-als with only small branch distance and branch length or corcor-als with only large inter-branch distance and inter-branch length. This definition was adopted in accordance with the assumption that intermediate inter-branch distance and branch length should provide refuge for small and medium size fishes, while excluding larger predators, similarly to the idea that lays behind the “intermediate disturbance hypothesis”[40].
Fish community structure and coral species
Fish species richness & fish abundance. Mean fish species richness differed among the
eight coral species (F7,70= 15.923, p<0.001). A post hoc Tukey HSD test showed thatE.
hor-ridaandH.rigidasupported significantly higher fish species richness than the other coral spe-cies, with the exception ofP.cylindrica(p<0.05) (Fig 2A).A.tenuisandA.milleporacolonies supported significantly lower fish species richness than most other coral species, with the exception ofS.pistillata(Tukey HSD, p<0.05) (Fig 2A). There was no significant difference in the fish species richness supported byS.pistillata,S.hystrix and A.formosa(Fig 2A).
0
10
20
30
40
50
60
70
80
M
ean
in
te
r-br
an
ch
s
pac
e +
/-S.E
.
Coral species
B
C
D
C
D
C
D
abundance thanE.horrida,H.rigidaandP.cylindricacolonies (p<0.05) (Fig 2B). There was no significant difference in fish abundance amongA.millepora,A.formosa,H.rigida,P. cylin-drica,S.hystrixandS.pistillata(Fig 2B).
Fish assemblages. A total of 57 fish species and 1,205 individuals were observed
occupy-ing the eight coral species sampled at the 0.5 x 0.5 m spatial scale. Fish communities were dom-inated by damselfishes, which represented 47% (27 species) of the total number of species and just under 70% of the abundance of all individuals recorded, withChromis viridisand Poma-centrus moluccensisbeing the two most abundant species.
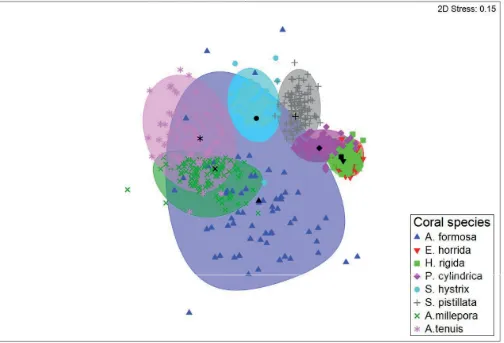
Multivariate analysis of fish community composition revealed significant differences in fish assemblages among the eight coral species (PERMANOVA+ F7,70= 4.1, p<0.001;Fig 3). Pair–wise tests identified differences in fish community structure among most of the coral spe-cies examined; however, fish community structure did not differ betweenE.horrida,H.rigida
andP.cylindricaor betweenA.millepora,A.tenuisandA.formosa(Table 2). These results were supported by SIMPER analysis, which showed high levels of dissimilarities between most coral species (~50–90%) (Table 3).H.rigidaandA.tenuis, andE.horridaandA.tenuishad the most dissimilar fish communities (91% in both cases), whereasE.rigidaandH.horridahad the most similar communities (52.4% dissimilarity). Bray-Curtis similarities for each coral spe-cies (within groups similarities) were relatively low ranging from 16% (A.millepora) to 49% (E.horrida).C.viridis,P.moluccensis, pomacentrid and labrid species exploited most of the studied corals.Gobiodon histriowas observed onA.milleporaandA.tenuis, while Paragobio-don xanthosomuswas only observed onS.hystrix.N.melasnew settlers were predominantly observed onA.milleporaandA.tenuis. WhileS.nigricansexclusively occupiedA.formosa
stands (Table 4).
Fish community structure and spatial scales of sampling
Fish species richness. Coral species was the only variable that explained a significant
amount of variation in fish species richness at each of the three sampling scales. Regression tree analyses for the three coral species sampled at the 2x2 m, 1x1 m and 0.5x0.5 m scale each produced a two-leaf tree (Fig 4). One leaf represented high fish species richness associated withE.horridaandH.rigidaand the second leaf represented low fish species richness associ-ated withP.cylindricacolonies. On average,E.horridaandH.rigidacolonies contained twice as many fish species compared withP.cylindricaat each of the three sampling scales (Fig 4).
Overall, the largest sampling scale examined (2x2 m) explained twice as much of the varia-tion in the data (53.6%) than the two smaller scales (32.5% and 20.9%, respectively). However,
E.horridaandH.rigidasupported a richer fish community thanP.cylindricaregardless of the scale of sampling (Fig 4).
Fish abundance. Overall, as for species richness, the larger spatial scale explained much
more variation in the abundance of fish species than the two smaller scales. Coral species explained a substantial amount of variation in fish abundance only at the two largest sampling scales (2x2 m and 1x1 m) (Fig 5). Regression tree analyses of log fish abundance for the three coral species sampled at the 2x2 m and 1x1 m scale produced a three-leaf tree in each case, explaining 26.5% and 18.9% of the variance, respectively (Fig 5). In both cases the first split was based on coral species, and the second split was based on water depth, explaining 15% (2x2 m, first split) and 11.5% (2x2 m second split), 8.4% (1x1 m, first split) and 10.5% (1x1m, second split) of the variation in fish abundance. One leaf represented high fish abundance Fig 1. (a) The differences in the inter-branch space of the eight study coral species. Shared letters indicate no significant difference. (b) The differences in branch length of the six branching coral species. Shared letters indicate no significant difference.
0
0.2
0.4
0.6
0.8
1
1.2
Log
fi
sh
speci
es r
ichness +
/-S
.E
.
Coral species
D
C
D
B
C
B
C
A
A
A
B
D
0
0.2
0.4
0.6
0.8
1
1.2
1.4
1.6
Log f
is
h
a
b
unda
nc
e
+
/-S
.E
.
Coral species
C
A
B
C
A
B
C
B
C
B
C
A
B
A
A
B
a.associated withE.horridaandH.rigidacolonies at shallower depth, the second leaf repre-sented intermediate fish abundance associated withE.horridaandH.rigidacolonies in deeper areas. The third leaf represented the lowest fish abundance associated withP.cylindrica colo-nies. On average,E.horridaandH.rigidacolonies supported twice as high fish abundance as
P.cylindricaat 2x2 m and 1x1 m scales (Fig 5A and 5B). The regression tree analysis of the log fish abundance for the three coral species sampled at the 0.5x0.5 m scale produced a two-leaf tree explaining 13% of the variance (Fig 5C).
Fish community structure and coral colony size. Fish species richness increased as
col-ony size increased (ANCOVA; colcol-ony size F1,67= 75.3195, p<0.001;Fig 6A). There was no interaction between coral species and coral colony size (Homogeneity of slopes, F2,65= 0.5147, p>0.05) indicating that all three coral species accumulated fish species richness at approxi-mately the same rate with increasing colony size.E.horridaandH.rigidasupported higher fish species richness thanP.cylindricaon colonies of similar size (ANCOVA; coral species, F2,67= 6.1785, p<0.05;Fig 6A).
Fig 2. (a) Log fish species richness supported by eight coral species. Shared letters indicate no significant difference. (b) Log fish abundance supported by eight coral species. Shared letters indicate no significant difference.
[image:10.612.64.568.324.667.2]https://doi.org/10.1371/journal.pone.0202206.g002
Fig 3. Two-dimensional, non-metric multidimensional scaling (nMDS) plot showing ordination of fish assemblages in relation to eight study coral species based on bootstrapped values calculated for 100 replications per coral species. Bootsrap averages (coloured symbols), group averages (black symbols) and 95% confidence intervals (coloured ellipses) based on bootstrap sampling with replacement are also shown.
Similarly, log fish abundance increased with colony size (ANCOVA; colony size, F1,67= 70.6107, p<0.001,Fig 6B). There was no interaction between coral species and colony size (Homogeneity of slopes, F2,65= 0.2785, p>0.05) indicating that all three coral species accu-mulated fish abundance at approximately the same rate with increasing colony size.E.horrida Table 2. PERMANOVA pair-wise comparisons using Bray-Curtis similarity values to test for differences in fish community structure on different coral species.
Groups t p-value Unique permutations
A. formosa E.horrida 2.1759 0.0014 4942
H.rigida 2.2717 0.0009 5899
P.cylindrica 1.8453 0.0034 4944
S.hystrix 1.6432 0.0064 2886
S.pistillata 1.6754 0.0167 3896
A.millepora 1.2243 0.1904 1992
A.tenuis 1.3958 0.1068 336
E. horrida H.rigida 1.1394 0.264 9943
P.cylindrica 1.2218 0.202 9916
S.hystrix 2.668 0.0001 9872
S.pistillata 2.341 0.0002 9885
A.millepora 2.7335 0.0001 9797
A.tenuis 3.0917 0.0001 7730
H. rigida P.cylindrica 1.1824 0.2394 9935
S.hystrix 2.579 0.0001 9905
S.pistillata 2.29 0.0003 9930
A.millepora 2.6789 0.0001 9857
A.tenuis 3.0628 0.0002 8368
P. cylindrica S.hystrix 2.0059 0.001 9870
S.pistillata 1.716 0.0099 9904
A.millepora 2.0693 0.0001 9763
A.tenuis 2.1957 0.0024 7611
S. hystrix S.pistillata 1.9203 0.002 9823
A.millepora 1.7432 0.0043 9427
A.tenuis 1.5334 0.0405 5704
S. pistillata A.millepora 2.0047 0.0005 9660
A.tenuis 1.8603 0.0026 6865
A. millepora A.tenuis 0.62136 0.8354 4310
Significant values are highlighted in bold.
https://doi.org/10.1371/journal.pone.0202206.t002
Table 3. Results of SIMPER routine to analyse dissimilarity between groups (coral species). Pair-wise comparisons are shown.
A. formosa E. horrida H. rigida P. cylindrica S. hysrix S. pistillata A. millepora
A. tenuis 82.8 91 91 85.2 80.6 82.9 75.2
A. millepora 84.6 89.4 88.6 87.2 87.7 89
S. pistillata 82.2 71.9 72.2 72.5 78.8
S. hysrix 84.7 78.5 78 77.6
P. cylindrica 82.5 59.5 59.9
H. rigida 80.4 52.4
E. horrida 77.7
[image:11.612.34.574.586.685.2]supported higher log fish abundance thenP.cylindricaandH.rigida(ANCOVA; coral species, F2,67= 4.6293, p<0.05;Fig 6B).
Discussion
Substantial differences in fish species richness, abundance and assemblage structure were found among the eight coral species. Two coral species,E.horridaandH.rigida, supported the highest fish species richness and abundance. In general, the different corals supported distinct fish communities, with dissimilarities ranging from 50–90%. Coral species was the main vari-able explaining variation in fish species richness at three different sampling scales, with more variation explained at the largest scale of sampling. Fish species richness and abundance increased with coral colony size at similar rates for different coral species, but there were sub-stantial differences among species at similar coral colony sizes. These results have important implications for interpreting the effects of declining coral cover, species diversity and coral size in response to the increasing severity and frequency of disturbances impacting on coral reefs.
Importance of coral species
[image:12.612.39.579.89.376.2]Our results are consistent with other studies showing that coral diversity has a strong influence on fish species richness and abundance [25,41]. Our findings also indicate that some coral Table 4. Percentage occurrence of fish taxa on each coral species.
A. formosa (22%) E. horrida
(49%) H. rigida (47%) P. cylindrica (36%) S. hysrix (28%) S. pistillata (33%) A. millepora (16%) A. tenuis (25%)
Other NS 13.6
(34%)
0.84 1.7 - 8 2.6 9.1 11.8
Other Juv - 4.2 5.9 7.5 8 - 4.5 5.9
Pomacentrids 9.1 8.4
(22%)
9.3 (25%)
10.4 (20%)
6 5.1 9.1 5.9
Pomacentrus mollucensis 4.5 9.2
(27%) 11 (33%) 14.9 (41%) 8 17.9 (36%) 4.5
-P.mollucensisJuv 9.1 4.2 1.7 7.5 8
(10%)
20.5 (40%)
9.1 17.6
(33%)
P.mollucensisNS - 0.84 1.7 6 10
(14%)
5.1 9.1 17.6
(26%)
Chromis viridis 4.5 3.4 6.8
(10%)
4.5 2 7.7 4.5
-Labrids 9.1 9.2
(23%)
5.9 6 2 7.7 -
-Gobiodon histrio - - - 13.6
(11%)
11.8
Paragobiodon xanthosomus - - - - 14
(32%)
- -
-Neoglyphidodon melasNS 4.5 - - - 18.2
(55%)
17.6 (23%)
Stegastes nigricans 13.6 (38%)
- - -
NS–new settlers; Juv–juveniles
Note: Those species that contributed>10% to the Bray-Curtis similarity of each group from SIMPER analysis are shown. The within group percent similarity is also displayed and individual species contribution to the within group percent similarities is given for major contributors (>10%) (in bold).
P. cylindrica E. horrida H. rigida
5.73
(11) (24)12
32.5% of variance explained
P. cylindrica E. horridaH. rigida
11.7 (10)
21.5 (15) 53.6% of variance explained
P. cylindrica E. horridaH. rigida
4.92 (12)
8.8 (25)
20.9% of variance explained
. b .
a
[image:13.612.114.554.72.648.2]c.
Fig 4. Regression tree analysis of the fish species richness at Lizard Island, Great Barrier Reef, QLD, Australia. The explanatory variables were: coral species, depth, and reef zone. For each of the terminal nodes the distribution of the observed values of fish species richness is shown in a histogram. Each node is labeled with the mean rating and the number of observations in a group (in parentheses). (a) 2x2 m scale. The tree explained 53.6% of the total variability in the data. (b) 1x1 m scale. The tree explained 32.5% of the total variability in the data. (c) 0.5x0.5 m scale. The tree explained 20.9% of the total variability in the data.
. b .
a
c.
P. cylindrica
Depth > 1.9 m E. horrida H. rigida
Depth < 1.9 m
1.66 (10)
1.96
(11) 2.15(4)
26.5% of variance explained
P. cylindrica
Depth > 4.3 m E. horrida H. rigida
Depth < 4.3 m
1.21 (11)
1.29
(6) 1.58(18)
18.9 % of variance explained
Depth > 3.1 m Depth < 3.1 m
1.04
(12) 1.34(25)
[image:14.612.93.561.94.536.2]13% of variance explained
species tend to support more diverse and abundant fish communities than other coral species and therefore may play a more important role in supporting fish diversity.E.horridaandH.
rigidasupported richer and more abundant fish communities than the other six coral species examined. Three coral speciesA.millepora,A.tenuisandS.pistillatasupported the least diverse and least abundant fish communities. Several studies have investigated the importance of differentAcroporaandPocilloporaspecies as coral reef fish habitat [23,27,42], however other common coral species, which may be important fish habitat, have received less attention. While there is an obvious effect of coral species identity on fish communities, there may also be an interaction effect of different coral species, with some combinations being able to sup-port higher fish diversities and abundances. These possible relationships require further investigation.
Current estimates indicate that less than 10% of reef fish species are coral dependent [18,
24], although a much larger proportion of species are known to respond to declining coral cover [8,42]. The strength of the species-specific patterns observed here suggest a large num-ber of small fish species discriminate among coral species in some way. Many fish species pre-fer to settle on or near live coral [23–24,43], even if adults of the same species are not coral dependant. Coker et al. [24] reported that there is large variation in habitat specialisation on coral reefs, with some fish species being strongly linked to single coral species and others being found to occupy a number of species of corals. The corals in our study that supported the high-est richness of fishes appeared to be providing suitable habitat for a large array of fish species.
Differences in fish species richness, abundance and community composition supported by different coral species may potentially be related to the branching structure of the corals. In general, coral species with an intermediate branch spacing and length supported the most rich and abundant fish communities (e.g.E.horrida,H.rigida). Small fish species or younger life stages were predominantly associated with tightly branched corals likeA.milleporaandA. ten-uis, while the large damselfishS.nigricanswas almost exclusively confined toA.formosacoral colonies, which was the most open branching coral in this study. Although branching com-plexity does not necessarily exclude predators, it is likely to aid in prey escape [44]. Tightly branched corals would be expected to decrease predation levels and allow higher survival for smaller fish species; however, only a few fish species would be able to use these corals as refuge due to the size limitations (e.g. corymbose corals, such asA.millepora,A.tenuis). On the other hand, the more open corals, with larger distances between branches and abundant free space available, would allow a large number of different fish species to enter the colony; however, it also means that larger predators can access prey more easily. Coral species that provide ade-quate space among the branches for movement and feeding of resident fish, and at the same time a sufficiently dense structure to offer protection from larger predators, might be expected to be favoured by a wide range of small reef fishes. Coral reef fish often use holes of approxi-mately their own body diameter as shelter [21,27], which may explain why more structurally complex coral species support more diverse fish communities.
Although coral species was the most important factor affecting the structure of fish commu-nities, water depth also had a small, but detectable, influence on overall fish abundance. Water depth explained 10–15% of the variance in fish abundance, with higher abundances associated with coral colonies in shallower water. It has been suggested that the relationship between fish abundance and live coral cover may be stronger in shallower zones, as fish are forced to remain in close proximity to the substratum in such areas [45].
The first split based on coral species explained 8.4%, second split based on depth explained 10.5%. (c) 0.5x0.5 m scale. The tree explained 13% of the total variability in the data.
0
5
10
15
20
25
-0.6
-0.4
-0.2
0
0.2
0.4
F
ish
sp
eci
es
ri
ch
n
e
ss
Log average diameter (m)
a.
b.
0
0.5
1
1.5
2
2.5
3
E. horrida
P. cylindrica
H. rigida
Log average diameter (m)
Log fish abundance
H. rigida
P. cylindrica
E. horrida
0.4
0.2
0
0.2
-0.4
-0.6
-Importance of sampling scale
Coral species explained a greater amount of total variation in fish species richness and fish abundance at the largest sampling scale examined (2x2 m) compared with two smaller sam-pling scales. Moreover, while coral species explained a relatively large amount of variation in fish species richness at all three sampling scales (21–54%), this relationship was not as strong for fish abundance (0–15%). The findings indicate that fish species richness-habitat associa-tions become less apparent at very small spatial scales. The smaller change in the proportion of variation in fish abundance explained at all three spatial scales, compared with fish species richness, indicates that spatial scale has less influence on fish abundance-habitat associations than it does on fish species richness-habitat associations. These results show that the spatial scale of sampling can have a significant effect on the strength of the relationship between coral and fish communities, but does not alter the basic patterns.
Importance of colony size
We found that fish species richness and abundance increased with coral colony size for the three coral species examined. Other studies have also reported positive correlations between reef or coral head size and corresponding fish species richness or fish abundance [21,46–47]. This relationship is usually explained by the assumption that larger areas contain larger num-bers of refuges and are likely to create a greater number of microhabitats. Therefore, larger areas can facilitate niche partitioning and support a greater number of individuals, and thus, larger areas are also likely to contain a larger number of species [21,48–49]. Fish abundance and richness increased at a similar rate with increasing colony size for the three coral species examined. This suggests that the same mechanisms may be regulating abundance and species richness on the three coral species. One such mechanism could be coral structural characteris-tics. In the lagoon of Lizard Island, the variations in fish species richness and fish abundance were explained by coral species themselves.E.horridaandH.rigidasupported higher fish spe-cies richness thanPorites cylindricaat all sizes, whileE.horridasupported higher fish abun-dance than the other two corals at all sizes.
Conclusion
This study found that the diversity and abundance of the fish communities was strongly related to the coral species examined. Furthermore, the strength of the association with coral species was stronger for species that could be sampled at larger spatial scales. The majority of fish species exhibited preferences for two of the coral species surveyed,E.horridaandH.rigida. In addition, for a given coral species, fish species richness and abundance increased as colony size increased, howeverE.horridaandH.rigidasupported higher fish species richness thanP.
cylindricaat all colony sizes. These results suggest that similar processes influence fish distribu-tion up to the largest scale examined here and that physical characteristics of the coral species are likely to have a significant influence on both the number of individuals and the number of fish species found on coral colonies.
These results have important implications for our understanding of the likely effects of degrading coral communities on fish communities. Often, the coral species supporting the most diverse fish communities also appear to be highly susceptible to coral bleaching, storms and cyclones, and other disturbances [23,32–33]. Various disturbances will tend to reduce the Fig 6. (a) Relationships between fish species richness supported by three different coral species and an average diameter of a range of coral colonies. (b) Relationships between fish abundance supported by three different coral species and average diameter of a range of coral colonies.
average size of surviving coral colonies, further negatively influencing the abundance and diversity of coral reef fish communities. Together, these results suggest that a reduction in the cover of coral species, especially those that support diverse and abundant fish communities, could cause significant reductions in the diversity and abundance of local coral-associated fish communities. Triggers to initiate management actions are often based on gross estimates of declining coral cover. However, management plans to preserve the biodiversity of coral reefs must focus on detecting declines in and protecting structurally complex coral species.
Supporting information
S1 Supporting Information. Assumptions testing.
(DOCX)
Acknowledgments
We are grateful for the assistance in the field provide by K. Markey, A. Downing, O. O’shea and C. Johansson. We also thank Dr. M. Sheaves for his invaluable help with statistical analy-sis. The manuscript was improved by comments from J. Dawson, Dr. A. Hoey, Dr. K. Dafforn, Dr. A. McKinley and Dr. J. Jaffre´s. Financial support was provided by the ARC Centre of Excellence for Coral Reef Studies.
Author Contributions
Conceptualization: Valeriya Komyakova, Geoffrey P. Jones, Philip L. Munday.
Data curation: Valeriya Komyakova.
Formal analysis: Valeriya Komyakova, Geoffrey P. Jones, Philip L. Munday.
Funding acquisition: Geoffrey P. Jones.
Investigation: Valeriya Komyakova.
Methodology: Valeriya Komyakova.
Supervision: Geoffrey P. Jones, Philip L. Munday.
Visualization: Valeriya Komyakova.
Writing – original draft: Valeriya Komyakova.
Writing – review & editing: Valeriya Komyakova, Geoffrey P. Jones, Philip L. Munday.
References
1. Brown JH. On the relationship between abundance and distribution of species. Am Nat. 1984; 124: 255–279.
2. Bell SS, McCoy ED, Mushinsky HR. Habitat structure. The physical arrangement of objects in space. Population and Biology Series. Chapman and Hall; 1991.
3. Araujo APA, De Paula JD, Carneiro MAA, Schoereder JH. Effects of host plant architecture on coloniza-tion by galling insects. Aust Ecol. 2006; 31: 343–348.
4. McAlpine CA, Rhodes JR, Callaghan JG, Bowen ME, Lunney D, Mitchell DL, et.al. The importance of forest area and configuration relative to local habitat factors for conserving forest mammals: A case study of koalas in Queensland, Australia. Biol Conserv. 2006; 132: 153–165.
5. MacGregor-Fors. Relation between habitat attributes and bird richness in a western Mexico suburb. Landsc Urban Plan. 2008; 84: 92–98.
7. Curtis JMR, Vincent ACJ. Distribution of sympatric seahorse species along a gradient of habitat com-plexity in a sea-grass dominated community. Mar Ecol Prog Ser. 2005; 291: 81–91.
8. Jones GP, McCormick MI, Srinivasan M, Eagle JV. Coral decline threatens fish biodiversity. Proc Natl Acad Sci U S A. 2004; 101: 8251–8253.https://doi.org/10.1073/pnas.0401277101PMID:15150414
9. Jaxion-Harm J, Speight MR. Algal cover in mangroves affects distribution and predation rates by carniv-orous fishes. J Exp Mar Biol Ecol. 2012; 414–415: 19–27.
10. Philpott SM, Bichier P. Effects of shade tree removal on birds in coffee agroecosystems in Chiapas, Mexico. Agric Ecosyst Environ. 2012; 149: 171–180.
11. Swihart RK, Gehring TM, Kolozsvary MB, Nupp TE. Responses of ‘resistant’ vertebrates to habitat loss and fragmentation: the importance of niche breadth and range boundaries. Divers Distrib. 2003; 9: 1– 18.
12. Munday PL. Habitat loss, resource specialization, and extinction on coral reefs. Glob Change Biol. 2004; 10: 1642–1647.
13. Andrew NL, Mapstone BD. Sampling and the description of spatial pattern in marine ecology. Oceanogr Mar Biol Annu Rev 25: 39–90
14. Syms C (1995) Multi-scale analysis of habitat association in a guild of blennioid fishes. Mar Ecol Prog Ser. 1987; 125: 31–43.
15. Hewitt JE, Thrush SF, Cummings VJ, Turner SJ. The effect of changing sampling scales on our ability to detect effects of large-scale processes on communities. J Exp Mar Biol Ecol. 1998; 227: 251–264. 16. Sale PF. Appropriate spatial scales for studies of reef-fish ecology. Aust J Ecol. 1998; 23: 202–208. 17. Wilson SK, Graham NAJ, Pratchett MS, Jones GP, Polunin NVC. Multiple disturbances and global
deg-radation of coral reefs: are reef fishes at risk or resilient? Glob Change Biol. 2006; 12: 2220–2234. 18. Pratchett MS, Munday PL, Wilson SK, Graham NAJ, Cinner JE, Bellwood DR, et.al. Effects of
climate-induced coral bleaching on coral-reef fishes–Ecological and Economical Consequences. Oceanogr Mar Biol Annu Rev. 2008; 46: 251–296.
19. Stella JS, Pratchett MS, Hutching PA, Jones GP. Coral-associated invertebrates: diversity, ecological importance and vulnerability to disturbance. Oceanogr Mar Biol Annu Rev. 2011; 49: 43–116. 20. Kokita T, Nakazono A. Rapid response of an obligatory corallivorous filefish Oxymonacanthus
longiros-tris (Monacanthidae) to a mass coral bleaching event. Coral Reefs. 2001; 20: 155–158.
21. Holbrook SJ, Brooks AJ, Schmitt RJ. Predictability of fish assemblages on coral patch reefs. Mar Freshw Res. 2002a; 53: 181–188.
22. Holbrook SJ, Brooks AJ, Schmitt RJ. Variation in structure attributes of patch-forming corals and in pat-terns of abundance of associated fishes. Mar Freshw Res. 2002b; 53: 1045–1053.
23. Bonin MC. Specializing on vulnerable habitat: Acropora selectivity among damselfish recruits and the risk of bleaching-induced habitat loss. Coral Reefs. 2012; 31:287–297.
24. Coker DJ, Wilson SK, Pratchett MS. Importance of live coral habitat for reef fishes. Rev Fish Biol Fish. 2014; 24: 89–126.
25. Munday PL. Fitness consequences of habitat use and competition among coral-dwelling fishes. Oecolo-gia. 2001; 128: 585–593.https://doi.org/10.1007/s004420100690PMID:28547404
26. Messmer V, Jones GP, Munday PL, Holbrook SJ, Schmitt RJ, Brooks AJ. Habitat biodiversity as a determinant of fish community structure on coral reefs. Ecology. 2011; 92: 2285–2298. PMID:
22352168
27. Hixon MA, Beets JP. Predation, prey refuges, and the structure of coral reef fish assemblages. Ecol Monogr. 1993; 63: 77–101.
28. Bonin M, Srinivasan M, Almany GR, Jones GP. Interactive effects of interspecific competition and microhabitat on early post-settlement survival in a coral reef fish. Coral Reefs. 2009; 28: 265–274. 29. Graham NAJ, Nash KL. The importance of structural complexity in coral reef ecosystems. Coral Reefs.
2013; 32: 315–326.
30. Ault TR, Johnson CR. Spatial variation in fish species richness on coral reefs: habitat fragmentation and stochastic structuring processes. Oikos. 1998; 82: 354–364.
31. Jones GP, Syms C. Disturbance, habitat structure and the ecology of fishes on coral reefs. Aust J Ecol. 1998; 23: 287–297.
32. Hughes TP, Connell JH. Multiple stressors on coral reefs: A long-term perspective. Limnol Oceanogr. 1999; 44: 932–940.
34. Loya Y, Sakai K, Yamazato K, Nakano Y, Sambali H, van Woesik R. Coral bleaching: the winners and losers. Ecol Lett. 2001; 4: 122–131.
35. Thompson VJ, Munday PL, Jones GP. Habitat patch size and mating system as determinants of social group size in coral-dwelling fishes. Coral Reefs. 2007; 26: 165–174.
36. Munday PL, Jones GP, Pratchett MS, Williams AJ. Climate change and the future for coral reef fishes. Fish Fish. 2008; 9: 261–285.
37. Clarke KR, Gorley RN. PRIMER V.6: user manual/tutorial. PRIMER-E, Plymouth; 2006.
38. Anderson M, Gorley R, Clarke K. PERMANOVA+ for PRIMER. Guide to software and statistical meth-ods. PRIMER-E, Plymouth, UK; 2008.
39. De’ath G, Fabricius KE. Classification and regression trees: a powerful yet simple technique for ecologi-cal data analysis. Ecology. 2000; 81: 3178–3192.
40. Connell JH. Diversity in tropical rain forests and coral reefs. Science. 1978; 199: 1302–1309.https:// doi.org/10.1126/science.199.4335.1302PMID:17840770
41. Komyakova V, Munday PL, Jones GP. Relative importance of coral cover, habitat complexity and diver-sity in determining the structure of reef fish communities. PLoS ONE. 2013; 8(12): e83178.https://doi. org/10.1371/journal.pone.0083178PMID:24349455
42. Pratchett MS, Coker DJ, Jones GP, Munday PL. Specialization in habitat use by coral reef damselfishes and their susceptibility to habitat loss. Ecol Evol. 2012; 2: 2168–2180.https://doi.org/10.1002/ece3.321
PMID:23139876
43. Wilson SK, Burgess SC, Cheal AJ, Emslie M, Fisher R, Miller I, et.al. Habitat utilization by coral reef fish: implications for specialists vs. generalists in a changing environment. J Anim Ecol. 2008; 77: 220– 228.https://doi.org/10.1111/j.1365-2656.2007.01341.xPMID:18081778
44. Caley MJ, St. John J. Refuge availability structures assemblages of tropical reef fishes. J Anim Ecol. 1996; 65: 414–428.
45. Chabanet P, Ralambondrainy H, Amanieu M, Faure G, Galzin R. Relationships between coral reef sub-strata and fish. Coral Reefs. 1997; 16: 93–102.
46. Sale PF, Douglas WA. Temporal variability in the community structure of fish on coral patch reefs and the relation of community structure to reef structure. Ecology. 1984; 65: 409–422.
47. Kuwamura T, Yogo Y, Nakashima Y. Population dynamics of goby Paragobiodon echinocephalus and hard coral Stylopora pistillata. Mar Ecol Prog Ser. 1994; 103: 17–23.
48. Rosenzweig ML. Species diversity in space and time. Cambridge University Press. Cambridge; 1995. 49. Lomolino MV. The species-area relationship: new challenges for an old pattern. Prog Phys Geogr.