PARP1 Stabilizes CTCF Binding and Chromatin Structure To
Maintain Epstein-Barr Virus Latency Type
Lena N. Lupey-Green,
a*
Lisa B. Caruso,
aJozef Madzo,
aKayla A. Martin,
a*
Yinfei Tan,
bMichael Hulse,
aItalo Tempera
aaFels Institute for Cancer Research & Molecular Biology, Lewis Katz School of Medicine at Temple University,
Philadelphia, Pennsylvania, USA
bCancer Biology Program, Fox Chase Cancer Center, Philadelphia, Pennsylvania, USA
ABSTRACT
Epstein Barr virus (EBV) is a potentially oncogenic gammaherpesvirus
that establishes a chronic, latent infection in memory B cells. The EBV genome
per-sists in infected host cells as a chromatinized episome and is subject to
chromatin-mediated regulation. Binding of the host insulator protein CTCF to the EBV genome
has an established role in maintaining viral latency type. CTCF is posttranslationally
modified by the host enzyme PARP1. PARP1, or poly(ADP-ribose) polymerase 1,
cata-lyzes the transfer of a poly(ADP-ribose) (PAR) moiety from NAD
⫹onto acceptor
pro-teins, including itself, histone propro-teins, and CTCF. PARylation of CTCF by PARP1 can
affect CTCF’s insulator activity, DNA binding capacity, and ability to form chromatin
loops. Both PARP1 and CTCF have been implicated in the regulation of EBV latency
and lytic reactivation. Thus, we predicted that pharmacological inhibition with PARP1
inhibitors would affect EBV latency type through a chromatin-specific mechanism.
Here, we show that PARP1 and CTCF colocalize at specific sites throughout the EBV
genome and provide evidence to suggest that PARP1 acts to stabilize CTCF binding
and maintain the open chromatin landscape at the active Cp promoter during type
III latency. Further, PARP1 activity is important in maintaining latency type-specific
viral gene expression. The data presented here provide a rationale for the use of
PARP inhibitors in the treatment of EBV-associated cancers exhibiting type III latency
and ultimately could contribute to an EBV-specific treatment strategy for
AIDS-related or posttransplant lymphomas.
IMPORTANCE
EBV is a human gammaherpesvirus that infects more than 95% of
in-dividuals worldwide. Upon infection, EBV circularizes as an episome and establishes
a chronic, latent infection in B cells. In doing so, the virus utilizes host cell
machin-ery to regulate and maintain the viral genome. In otherwise healthy individuals, EBV
infection is typically nonpathological; however, latent infection is potentially
onco-genic and is responsible for 1% of human cancers. During latent infection, EBV
ex-presses specific sets of proteins according to the given latency type, each of which
is associated with specific types of cancers. For example, type III latency, in which
the virus expresses its full repertoire of latent proteins, is characteristic of
AIDS-associated and posttransplant lymphomas AIDS-associated with EBV infection.
Under-standing how viral latency type is regulated at the chromatin level may reveal
po-tential targets for EBV-specific pharmacological intervention in EBV-associated
cancers.
KEYWORDS
CTCF, epigenetics, Epstein-Barr virus, latency, PARP1, gene expression
E
pstein-Barr virus (EBV) is a gammaherpesvirus that infects more than 95% of the
human population worldwide. While EBV latent infection is typically asymptomatic
in healthy individuals, EBV infection is associated with a variety of lymphomas and
epithelial cancers and accounts for approximately 1% of all human cancers (1). In
Received30 April 2018Accepted26 June 2018
Accepted manuscript posted online5 July 2018
CitationLupey-Green LN, Caruso LB, Madzo J, Martin KA, Tan Y, Hulse M, Tempera I. 2018. PARP1 stabilizes CTCF binding and chromatin structure to maintain Epstein-Barr virus latency type. J Virol 92:e00755-18.https://doi.org/10 .1128/JVI.00755-18.
EditorJae U. Jung, University of Southern California
Copyright© 2018 Lupey-Green et al. This is an open-access article distributed under the terms of theCreative Commons Attribution 4.0 International license.
Address correspondence to Italo Tempera, [email protected].
*Present address: Lena N. Lupey-Green, Department of Microbiology and Immunology, Pennsylvania State College of Medicine, Hershey, Pennsylvania, USA; Kayla A. Martin, The Wistar Institute, Philadelphia, Pennsylvania, USA.
crossm
on November 6, 2019 by guest
http://jvi.asm.org/
particular, EBV-associated lymphomas tend to correlate with specific patterns of viral
gene expression or latency type. Understanding how latency type gene expression is
regulated may reveal potential therapeutic targets for treating EBV-associated cancers.
During infection of B cells, the EBV genome undergoes a highly regulated process
to circularize, chromatinize, repress lytic cycle genes, and selectively transcribe latency
genes (2). Accordingly, the virus is subject to chromatin-mediated epigenetic regulation
(3, 4). EBV encodes viral proteins and hijacks host proteins to manipulate the chromatin
landscape to support the viral life cycle. The host factor CTCF, a protein that functions
in maintaining and regulating chromatin architecture, is frequently targeted by DNA
viruses to manipulate viral gene expression (5, 6). Indeed, chromatin
immunoprecipi-tation studies have identified a number of CTCF binding sites throughout the EBV
genome (7–11). CTCF binding at latency promoters Qp and Cp prevents the spread of
repressive chromatin to Qp and mediates latency type-specific promoter usage and
gene expression by forming alternative chromatin loops (11, 12). Although CTCF
binding is widespread across both the human and EBV genomes, it is unclear how CTCF
binding and function are regulated in a site-specific manner.
CTCF is subject to a number of posttranslational modifications that regulate its
function, including phosphorylation, SUMOylation, and PARylation (13–15). PARylation
is the addition of poly(ADP-ribose) moieties from an NAD
⫹donor onto acceptor
proteins, catalyzed by the enzyme PARP1. PARP1 was initially studied in the context of
DNA damage, leading to the development and FDA approval of the PARP inhibitor
olaparib for the treatment of BRCA-deficient ovarian and metastatic breast cancers (16,
17). More recent work has focused on understanding the mechanisms of PARP1
involvement in transcription and epigenetic regulation (18, 19). PARP1 widely
colocal-izes with CTCF in human cell lines, and PARylation of CTCF modulates its insulator
activity (15, 20, 21). Thus, it is possible that PARylation of CTCF by PARP1 contributes
to site-specific regulation of CTCF binding and function.
Previously, our laboratory identified a correlation between EBV latency type and
PARP activity (22) and identified a role for PARP1 binding in EBV lytic reactivation (23).
Here, we hypothesized that PARP1 cooperates with CTCF to regulate EBV latency. Using
genome-wide approaches, we observed widespread CTCF and PARP1 colocalization
and identify a cooperative role for PARP1 and CTCF in regulating EBV type III latency at
the chromatin level. Taken together, these findings demonstrate that PARP1 regulates
EBV latency and provide a rationale for the use of PARP inhibitors in the treatment of
cancers associated with type III EBV latency.
RESULTS
PARP1 binds specific sites across the EBV genome.
Our laboratory previously
demonstrated that PARP1 binds to the lytic switch promoter Zp to regulate lytic
reactivation (23). Additionally, we have shown that the latency protein LMP1 regulates
PARP activity to alter host gene expression and observed a correlation between latency
type and levels of PARylation (22). These data prompted us to investigate whether
PARP1 activity also regulates viral gene expression, specifically through a DNA binding
mechanism, as we observed for reactivation. EBV-immortalized lymphoblastoid cell
lines (LCLs) were utilized in these studies, since they exhibit type III viral latency and
maintain high levels of PARylation (22). We performed chromatin immunoprecipitation
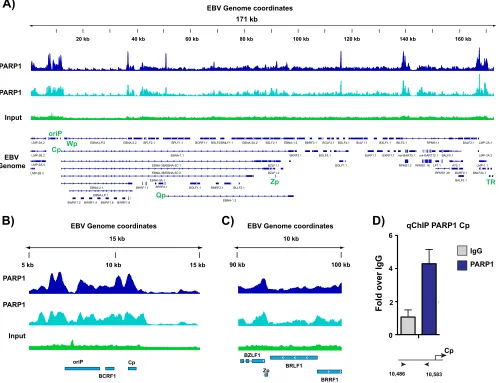
sequencing (ChIP-seq) in LCLs to assess PARP1 binding across the EBV genome (Fig. 1A)
and identified numerous PARP1 binding sites that were consistent between biological
duplicate experiments. The ChIP-seq experiment validated PARP1 binding at Zp
ob-served previously (Fig. 1C), but most notably it revealed a dense region of PARP1
enrichment around OriP and the active Cp promoter (Fig. 1B). PARP1 binding was
independently validated by ChIP-quantitative PCR (qPCR) at the Cp promoter (Fig. 1D).
PARP1 colocalizes with CTCF across the EBV genome.
Work from the Lieberman
and Sample laboratories have characterized a prominent CTCF binding site at Cp (7, 8,
12, 24). Based on the established functional relationship between CTCF and PARP1 (20),
we also performed ChIP-seq for CTCF in these same LCLs. In comparing PARP1 and
on November 6, 2019 by guest
http://jvi.asm.org/
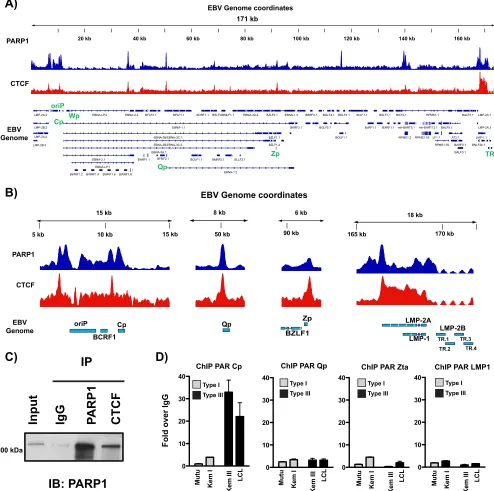
CTCF binding across the EBV genome, we identified numerous sites at which PARP1
and CTCF colocalize (Fig. 2A), as well as additional sites in which either PARP1 or CTCF
binds alone. PARP1 and CTCF colocalize at both latency promoters, Cp and Qp, the
LMP1/2 promoter, and the lytic promoter Zp (Fig. 2B). CTCF and PARP1 can physically
interact (25), so we also show by immunoprecipitation that CTCF binds PARP1 in LCL
cellular extracts (Fig. 2C). Studies in mice have demonstrated that CTCF can be
PARylated by PARP1 (20, 26). To assess whether CTCF is PARylated at these sites of
colocalization, we performed ChIP for PAR in a panel of cell lines exhibiting type I and
type III latency at the major latent promoters and the lytic promoter Zp (Fig. 2D). Most
interestingly, we only observed enrichment for PAR at Cp in type III latent cell lines,
suggesting that PARylation of CTCF at this site is important for Cp activation and
transcription.
PARP inhibition alters CTCF binding across the EBV genome.
PARylation of CTCF
alters CTCF function (15, 20). Thus, we asked whether the inhibition of PARP activity
alters CTCF binding across the EBV genome. Since CTCF is likely PARylated at Cp, we
predicted that inhibiting PARP activity would result in a loss of CTCF at Cp. ChIP-seq in
LCLs treated with and without the PARP inhibitor olaparib revealed some changes in
171 kb
20 kb 40 kb 60 kb 80 kb 100 kb 120 kb 140 kb 160 kb
EBV Genome
LMP-2A.2 EBNA-LP.2 EBNA-2.2 BFLF2.1 BPLF1.1 BORF1.1BSLF2/BMLF1.1 EBNA-3A.2 BZLF2.1 EBNA-1.3 BBRF2.1 BGLF4.1BDLF4.1 BcLF1.1 BXLF1.1 BILF2.1 RPMS1.1 BALF2.1 LMP-2A.1
LMP-2B.2 EBNA-1.1 BKRF3.1 BGLF5.1 BcRF1.1 BXRF1.1mir-BART5.1 mir-BART12.1BALF5.1 LMP-2A.3
EBNA-3B/EBNA-3C.1 BZLF1.1 BGLF1.1 RPMS1.2 RPMS1.16LF1.1 A73.1 LMP-1.1
EBNA-3B/EBNA-3C.2 BZLF1.2 RPMS1.39 BARF0.1 BNLF2b.1
EBNA-3A.1 BALF3.1
EBNA-2.1 BHRF1.1 BFRF2.1 BOLF1.1 BMRF2.1 BLLF2.1
EBNA-LP.1
EBNA-1.2
BWRF1.2 BWRF1.4 BWRF1.6 BWRF1.8
LMP-2A.4 LMP-2B.3
oriP
Cp
Qp Wp
TR Zp
PARP1
PARP1
Input
A)
EBV Genome coordinatesB)
15 kb
5 kb 10 kb 15 kb
PARP1
PARP1
Input
EBV Genome coordinates
oriP Cp
BCRF1
C)
10 kb
90 kb 100 kb
EBV Genome coordinates
BZLF1
BRLF1
BRRF1 Zp
D)
qChIP PARP1 CpIgG
PARP1
Cp
10,486 10,583
Fold over IgG
0 2 4 6
FIG 1PARP1 binds specific sites across the Epstein-Barr virus genome. (A) Chromatin immunoprecipitation sequencing (ChIP-seq) for PARP1 across the EBV genome in lymphoblastoid cell lines (LCLs) in two biological replicates compared with background input DNA. Peaks are expressed as counts per million reads. Corresponding genes in the linearized EBV genome are shown below. (B) Zoomed image of PARP1 ChIP-seq at the latent Cp locus in LCLs. (C) Zoomed image of PARP1 ChIP-seq at the lytic Zp locus in LCLs. (D) Independent ChIP-qPCR validation of PARP1 enrichment at Cp in LCLs. qPCR data are presented as fold above the level for IgG. Results are representative of three independent experiments and show means⫾standard deviations.
on November 6, 2019 by guest
http://jvi.asm.org/
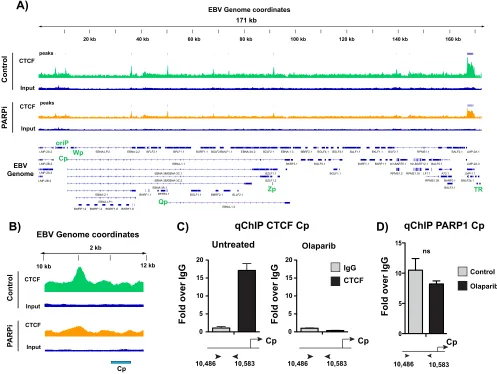
[image:3.585.44.545.76.459.2]CTCF binding across the genome (Fig. 3A), although the most prominent change
occurred at Cp. CTCF was evicted from the Cp promoter after PARP inhibition (Fig. 3B).
By independent ChIP-qPCR, we validated the loss of CTCF binding from Cp with PARP
inhibition (Fig. 3C). Because olaparib is known to result in trapping of PARP1 to its DNA
targets, we also performed ChIP for PARP1 at Cp in LCLs treated with olaparib. PARP
inhibition does not significantly alter PARP1 binding at Cp (Fig. 3D).
171 kb
20 kb 40 kb 60 kb 80 kb 100 kb 120 kb 140 kb 160 kb
EBV Genome
EBV Genome PARP1
CTCF
LMP-2A.2 EBNA-LP.2 EBNA-2.2 BFLF2.1 BPLF1.1 BORF1.1 BSLF2/BMLF1.1 EBNA-3A.2 BZLF2.1 EBNA-1.3 BBRF2.1 BGLF4.1BDLF4.1 BcLF1.1 BXLF1.1 BILF2.1 RPMS1.1 BALF2.1 LMP-2A.1
LMP-2B.2 EBNA-1.1 BKRF3.1 BGLF5.1 BcRF1.1 BXRF1.1mir-BART5.1 mir-BART12.1BALF5.1 LMP-2A.3
EBNA-3B/EBNA-3C.1 BZLF1.1 BGLF1.1 RPMS1.2 RPMS1.16LF1.1 A73.1 LMP-1.1
EBNA-3B/EBNA-3C.2 BZLF1.2 RPMS1.39 BARF0.1 BNLF2b.1
EBNA-3A.1 BALF3.1
EBNA-2.1 BHRF1.1 BFRF2.1 BOLF1.1 BMRF2.1 BLLF2.1
EBNA-LP.1
EBNA-1.2
BWRF1.2 BWRF1.4 BWRF1.6BWRF1.8
LMP-2A.4 LMP-2B.3
oriP
Cp
Qp Wp
TR Zp
A)
EBV Genome coordinatesB)
15 kb
5 kb 10 kb
PARP1
CTCF
EBV Genome coordinates
8 kb
15 kb 50 kb
oriP Cp Qp
BCRF1
6 kb
90 kb
BZLF1
Zp LMP-2A
LMP-2B LMP-1 TR.1 TR.3
TR.2 TR.4
18 kb
165 kb 170 kb
C)
Input
IgG
P
ARP1
CTCF
IP
IB: PARP1
100 kDa0 10 20 30 40
ChIP PAR Cp
Fold over IgG
0 10 20 30 40
ChIP PAR Qp ChIP PAR Zta
0 10 20 30 40
ChIP PAR LMP1
0 10 20 30 40
Mutu Kem I
Kem III
LCL
Mutu Kem I
Kem III
LCL
Mutu Kem I
Kem III
LCL
Mutu Kem I
Kem III
LCL
Type I Type III
Type I Type III
Type I Type III
Type I Type III
D)
FIG 2PARP1 colocalizes with CTCF across the Epstein-Barr virus genome. (A) ChIP-seq for PARP1 and CTCF across the EBV genome in LCLs demonstrating widespread colocalization. Peaks are expressed as counts per million reads. Corresponding genes in the linearized EBV genome are shown below. (B) Zoomed images of PARP1 and CTCF ChIP-seq at Cp, Qp, Zp, and LMP1/2 loci. Peaks are shown as counts per million reads. Scale in theyaxes are independent among the loci shown. (C) Western blot showing PARP1 and CTCF interaction in LCLs. Cell lysates were subjected to immunoprecipitation with antibodies for IgG, PARP1, and CTCF. Immune complexes were resolved by gel electrophoresis and immunoblotted for PARP1. (D) ChIP-qPCR for poly(ADP-ribose) moieties at Cp, Qp, Zp, and LMP1 in representative type I (white bars; Mutu, Kem I) and type III (black bars; Kem III, LCL) latent cell lines. qPCR data are presented as fold above the level for IgG. Results are representative of three independent experiments and show means⫾standard deviations.
on November 6, 2019 by guest
http://jvi.asm.org/
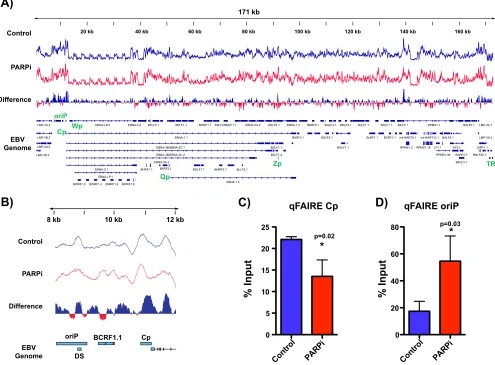
[image:4.585.45.539.76.567.2]PARP inhibition results in more tightly packed chromatin at Cp.
CTCF binding
to the genome is integral to maintaining chromatin topology in the mammalian
genome (27, 28). The observed loss of CTCF binding after PARP inhibition prompted us
to investigate broad changes in chromatin. Accordingly, we used
formaldehyde-assisted isolation of regulatory elements (FAIRE), a technique that assays for open and
nucleosome-depleted regions of DNA, to detect EBV genome-wide changes in
chro-matin accessibility in response to PARP inhibition (Fig. 4). We determined chrochro-matin
packing in LCLs before (blue track) and after (red track) inhibition of PARP activity. We
assessed changes in the FAIRE profile between conditions and determined changes in
chromatin accessibility by differential analysis. Blue peaks indicate regions in which
more open chromatin is enriched in the control, i.e., chromatin packing after PARP
inhibition, while red peaks indicate regions with more open chromatin in the
PARP-inhibited sample, i.e., chromatin relaxation after PARP inhibition. Genome-wide the
effects on chromatin were varied, resulting in both packing and relaxation of chromatin
(Fig. 4A). Upon closer examination of the Cp locus, after PARP inhibition we observed
significant chromatin packing at the Cp promoter but, interestingly, chromatin
relax-B)
2 kb
10 kb 12 kb
EBV Genome coordinates
171 kb
20 kb 40 kb 60 kb 80 kb 100 kb 120 kb 140 kb 160 kb
EBV Genome
LMP-2A.2 EBNA-LP.2 EBNA-2.2 BFLF2.1 BPLF1.1 BORF1.1BSLF2/BMLF1.1 EBNA-3A.2 BZLF2.1 EBNA-1.3 BBRF2.1 BGLF4.1BDLF4.1 BcLF1.1 BXLF1.1 BILF2.1 RPMS1.1 BALF2.1 LMP-2A.1
LMP-2B.2 EBNA-1.1 BKRF3.1 BGLF5.1 BcRF1.1 BXRF1.1mir-BART5.1 mir-BART12.1BALF5.1 LMP-2A.3
EBNA-3B/EBNA-3C.1 BZLF1.1 BGLF1.1 RPMS1.2 RPMS1.16LF1.1 A73.1 LMP-1.1
EBNA-3B/EBNA-3C.2 BZLF1.2 RPMS1.39 BARF0.1 BNLF2b.1
EBNA-3A.1 BALF3.1
EBNA-2.1 BHRF1.1 BFRF2.1 BOLF1.1 BMRF2.1 BLLF2.1
EBNA-LP.1
EBNA-1.2
BWRF1.2 BWRF1.4 BWRF1.6 BWRF1.8
LMP-2A.4 LMP-2B.3
oriP
Cp
Qp Wp
TR Zp
A)
EBV Genome coordinatesCTCF
Input
CTCF
Input
Control
PA
R
P
i
peaks
peaks
Cp CTCF
Input
CTCF
Input
Control
P
ARPi
Untreated
OlaparibC)
0 5 10 15 20
0 5 10 15 20
Fold over IgG
Fold over IgG
qChIP CTCF Cp
IgG
CTCF
Cp
10,486 10,583
Cp
10,486 10,583
D)
0 5 10 15
Cp
10,486 10,583
Control
Olaparib
qChIP PARP1 Cp
Fold over IgG
ns
FIG 3PARP inhibition alters CTCF binding across the Epstein-Barr virus genome. (A) ChIP-seq for CTCF across the EBV genome in untreated or olaparib-treated (PARPi) LCLs and respective input DNA. Peaks are expressed as counts per million reads. Corresponding genes in the linearized EBV genome are shown below. (B) Zoomed image of CTCF ChIP-seq at the latent Cp locus in LCLs, demonstrating the loss of enrichment after olaparib treatment. (C) Independent ChIP-qPCR validation of CTCF enrichment at Cp in untreated or olaparib-treated LCLs. qPCR data are presented as fold above the level for IgG. Results are representative of three independent experiments and show means⫾standard deviations. (D) ChIP-qPCR for PARP1 in untreated or olaparib-treated LCLs. qPCR data are presented as fold above the level for IgG. Results are representative of three independent experiments and show means⫾standard deviations (ns, not significant).
on November 6, 2019 by guest
http://jvi.asm.org/
[image:5.585.41.538.74.448.2]ation within OriP (Fig. 4B). FAIRE-qPCR validated the genome-wide observations,
show-ing a loss of open chromatin at Cp with PARP inhibition (Fig. 4C) and enrichment for
open chromatin at OriP (Fig. 4D).
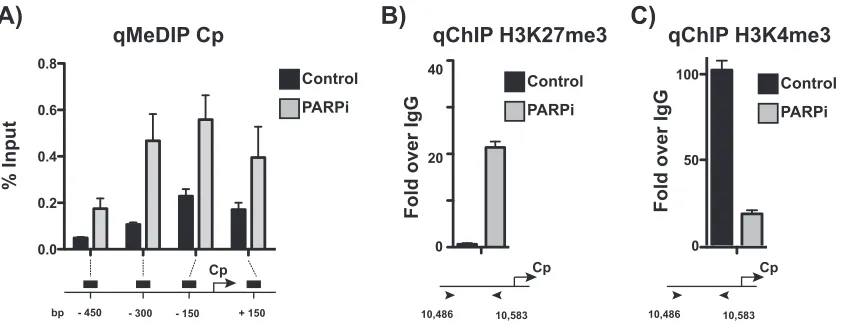
The active chromatin landscape at the Cp promoter is repressed after PARP
inhibition.
In type III latent cells, Cp is associated with active chromatin markers. The
chromatin landscape at Cp, at least in part, mediates type III latent gene expression (3,
29). With the observation that PARP inhibition results in packing chromatin at Cp, we
further examined the chromatin landscape at Cp. To assess DNA methylation at the Cp
promoter, we performed methylated DNA immunoprecipitation to immunoprecipitate
methylated DNA from LCLs treated with olaparib or left untreated (Fig. 5A). PARP
inhibition increases DNA methylation across the promoter, most significantly just
upstream of Cp. Chromatin immunoprecipitation for the repressive histone mark
H3K27me3 revealed a gain of enrichment following PARP inhibition (Fig. 5B) and a
concomitant loss in enrichment of the active H3K4me3 mark (Fig. 5C), consistent with
the packed phenotype observed by FAIRE.
PARP inhibition alters the EBV latency phenotype, reflecting a transition to type
I latency.
PARP inhibition results in the accumulation of repressive chromatin at the
171 kb
20 kb 40 kb 60 kb 80 kb 100 kb 120 kb 140 kb 160 kb Control
EBV Genome
PARPi
Difference
A)
C)
D)
B)
LMP-2A.2 EBNA-LP.2 EBNA-2.2 BFLF2.1 BPLF1.1 BORF1.1 BSLF2/BMLF1.1 EBNA-3A.2 BZLF2.1 EBNA-1.3 BBRF2.1 BGLF4.1BDLF4.1 BcLF1.1 BXLF1.1 BILF2.1 RPMS1.1 BALF2.1 LMP-2A.1
LMP-2B.2 EBNA-1.1 BKRF3.1 BGLF5.1 BcRF1.1 BXRF1.1mir-BART5.1 mir-BART12.1BALF5.1 LMP-2A.3
EBNA-3B/EBNA-3C.1 BZLF1.1 BGLF1.1 RPMS1.2 RPMS1.16LF1.1 A73.1 LMP-1.1
EBNA-3B/EBNA-3C.2 BZLF1.2 RPMS1.39 BARF0.1 BNLF2b.1
EBNA-3A.1 BALF3.1
EBNA-2.1 BHRF1.1 BFRF2.1 BOLF1.1 BMRF2.1 BLLF2.1
EBNA-LP.1
EBNA-1.2
BWRF1.2 BWRF1.4BWRF1.6 BWRF1.8
LMP-2A.4
LMP-2B.3
oriP
Cp
Qp Wp
TR Zp
oriP
DS
Cp BCRF1.1 Control
EBV Genome
PARPi
Difference
12 kb 10 kb
8 kb
Control PARPi 0
5 10 15 20 25
% Input
*
p=0.02
Control PARPi 0
20 40 60 80
% Input
*
p=0.03
qFAIRE Cp
qFAIRE oriP
FIG 4PARP inhibition results in more tightly packed chromatin at the Cp promoter. (A) Formaldehyde-assisted isolation of regulatory element sequencing (FAIRE-seq) to assess chromatin accessibility across the EBV genome in LCLs before (control; blue track) and after inhibition of PARP activity (PARPi; red track). By differential analysis, blue peaks represent regions in which open chromatin is enriched in the control, and red peaks represent regions with more open chromatin in the PARPi sample. (B) Zoomed image of FAIRE-seq at the latent Cp locus in LCLs, demonstrating the packing of chromatin at Cp after PARP inhibition. (C) Independent FAIRE-qPCR validation at Cp and OriP in untreated or olaparib-treated (PARPi) LCLs. qPCR data are presented as percentages of input DNA. Results are representative of three independent experiments and show means⫾standard deviations. Statistical significance, as determined by Student’s
ttest, is indicated by asterisks andPvalue.
on November 6, 2019 by guest
http://jvi.asm.org/
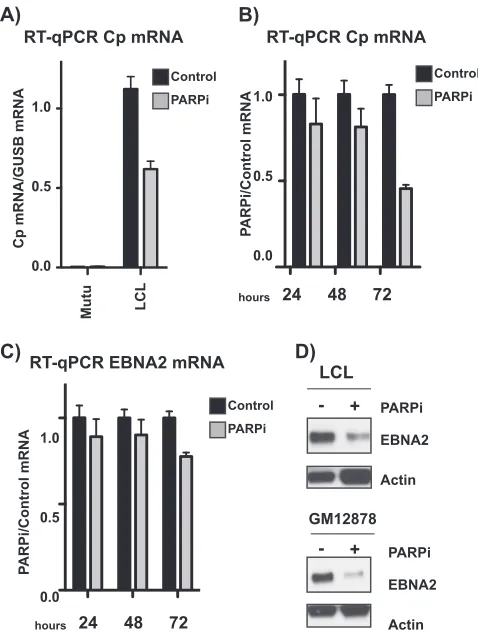
[image:6.585.44.539.77.442.2]active Cp promoter in type III latent cells. Thus, we predicted that treatment with
olaparib would decrease transcription from Cp. We performed quantitative reverse
transcription-PCR (qRT-PCR) to assess expression from Cp in Mutu and LCL cell lines
before and after PARP inhibition, revealing downregulation of Cp (Fig. 6A). Moreover,
this downregulation is time dependent over 72 h (Fig. 6B). EBNA2, which is expressed
from the Cp promoter, is also downregulated after 72 h of PARP inhibition, although
to a lesser extent than Cp itself (Fig. 6C). In addition, at the protein level, EBNA2
expression is significantly decreased to a much greater extent than that at the
transcriptional level in two different EBV-immortalized lymphoblastoid cell lines
treated with olaparib (Fig. 6D).
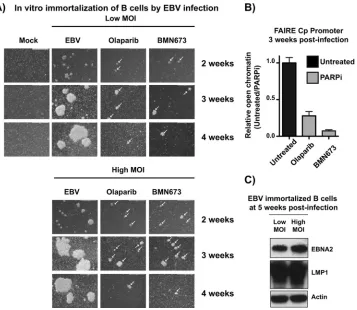
PARP inhibition represses EBV-mediated immortalization and transformation
of primary B cells.
Taken together, these data suggest that PARP inhibition results in
the accumulation of repressive marks at Cp, ultimately silencing transcription from Cp
and downregulating type III latent protein expression. Cp activation is required for the
establishment of EBV latency and transformation of primary B cells. We anticipated that
PARP inhibition has a similar effect on Cp during prelatency and may prevent the
activation of Cp and establishment of latency, ultimately preventing transformation of
primary B cells. Primary peripheral blood mononuclear cells (PBMCs) were incubated
with EBV at a low or high multiplicity of infection (MOI) with or without either olaparib
or BMN673, a more potent PARP inhibitor, and observed by light microscopy to assess
the outgrowth of LCLs (Fig. 7A). Untreated cells began to form clusters by 3 weeks,
which were maintained at 4 weeks postinfection. Cellular extracts at 5 weeks were
subjected to Western blotting to validate EBV latency; indeed, the cells expressed both
EBNA2 and LMP1, reflecting the establishment of type III latency (Fig. 7C). In PBMCs
incubated with olaparib or BMN673, clusters were visible at 3 weeks but were
signifi-cantly smaller than those of the untreated samples (Fig. 7A). By 4 weeks, the
PARP-inhibited cells had largely died and were not maintained thereafter. With the cell
clusters that had grown out after 3 weeks, we performed FAIRE at Cp to assess
chromatin state (Fig. 7B). Consistent with what was observed with PARP inhibition
during latency (Fig. 4), the PARP-inhibited samples were significantly less enriched in
open chromatin than in the untreated samples, presumably reflecting a
transcription-ally nonpermissive environment. Unfortunately, the small number of cells obtained
after PARP inhibition was not sufficient to perform additional ChIP and RT-PCR
exper-iments to assess epigenetic marks and transcription status.
% Input
0.0 0.2 0.4 0.6 0.8
A)
Control PARPi
Cp
- 450 - 300 - 150 + 150
bp
qMeDIP Cp
Fold over IgG
B)
0 20 40
Control PARPi
Cp
10,486 10,583
qChIP H3K27me3
0 50 100
Fold over IgG
Control PARPi
C)
Cp
10,486 10,583
qChIP H3K4me3
FIG 5Active chromatin landscape at the Cp promoter is repressed after PARP inhibition. (A) Methylated DNA immunoprecipitation (MeDIP) qPCR at the Cp promoter in untreated and olaparib-treated (PARPi) LCLs. qPCR data are presented as percentages of input DNA. Results are representative of three independent experiments and show means⫾standard deviations. (B) ChIP-qPCR for the repressive H3K27me3 mark at Cp in untreated and olaparib-treated (PARPi) LCLs. qPCR data are presented as fold above the level for IgG. Results are representative of three independent experiments and show means⫾standard deviations. (C) ChIP-qPCR for the active H3K4me3 mark at Cp in untreated and olaparib-treated (PARPi) LCLs. qPCR data are presented as fold above the level for IgG. Results are representative of three independent experiments and show means⫾standard deviations.
on November 6, 2019 by guest
http://jvi.asm.org/
[image:7.585.43.466.72.234.2]DISCUSSION
Here, we aimed to understand how PARP1 and CTCF cooperate to regulate the EBV
genome. We demonstrate that PARP activity has genome-wide effects on CTCF binding
across the viral genome and viral gene expression, and that PARylation of CTCF
maintains the active chromatin landscape at Cp in type III latency. Taken together,
these data elucidate a cooperative role for PARP1 and CTCF in regulating EBV latency
and ultimately could provide insight into PARP-based therapeutics for EBV-associated
cancers.
We demonstrate that PARP1 and CTCF colocalize at the majority of sites across the
EBV genome in LCLs, including at both latency promoters Cp and Qp. However, in type
III latent cells, CTCF binding is lost only at Cp after PARP inhibition (Fig. 8). Indeed, in
response to PARP inhibition and CTCF loss, Cp undergoes a transition from a
transcrip-tionally active open chromatin landscape to a repressive promoter, gaining both DNA
methylation and H3K27me3 marks (Fig. 8). CTCF binding at Qp, however, is maintained.
ChIP analysis for PAR suggests that CTCF enriched at Qp is not PARylated and could
account for why CTCF enrichment at Qp is not affected by PARP inhibition.
Interest-ingly, ChIP for PAR indicates that in type I latency, CTCF at the active Qp is not
PARylated, as might be expected. However, PARP activity is significantly lower in type
EBNA2
Actin PARPi
EBNA2
Actin PARPi
-
+
-
+
LCL
GM12878
0.0 0.5 1.0
Cp mRNA/GUSB mRNA
Mutu LCL
RT-qPCR Cp mRNA RT-qPCR Cp mRNA
RT-qPCR EBNA2 mRNA
0.0 0.5 1.0
0.0 0.5 1.0
P
A
RPi/Control mRNA
P
ARPi/Control mRNA
Control
PARPi
Control
PARPi Control
PARPi
24 48 72
hours
24 48 72
hours
A)
B)
C)
D)
FIG 6PARP inhibition alters the Epstein-Barr virus latency phenotype, reflecting a transition to type I latency. (A) qRT-PCR showing relative expression of Cp transcripts in untreated and olaparib-treated type I Mutu (negative control) and type III latent LCL cell lines. Expression is relative to that of the abundant B cell transcriptGUSB. Graph is representative of three independent experiments and shows means⫾ standard deviations. (B) qRT-PCR showing relative expression of Cp transcripts in LCLs. PARPi cells were treated with olaparib for 24, 48, or 72 h, as indicated. Expression is shown relative to untreated levels. Results are representative of three independent experiments and show means⫾standard deviations. (C) qRT-PCR showing relative expression of EBNA2 transcripts in LCLs. PARPi cells were treated with olaparib for 24, 48, or 72 h, as indicated. Expression is shown relative to untreated levels. Results are represen-tative of three independent experiments and show means⫾standard deviations. (D) Western blot for EBNA2 protein in two different type III latent lymphoblastoid cell lines treated with olaparib (PARPi). Actin served as a cellular loading control.
on November 6, 2019 by guest
http://jvi.asm.org/
[image:8.585.86.325.71.392.2]I latency than type III and may not be relevant for Cp/Qp regulation in type I latency
(22). Further, CTCF binding at Qp does not correlate with Qp activity, and stable CTCF
knockdown in type I latent cell lines does not alter Qp expression, suggesting that Qp
is regulated independently of CTCF/PARP (24, 30).
Although many studies have explored how PARylated CTCF is functionally distinct,
no study to date has characterized differentially PARylated CTCF across the genome or
how site-specific PARylation might be achieved. It is not fully established how PARP1
is recruited to specific promoters, even in the human genome. PARP1 almost
exclu-sively binds to the EBV genome at CTCF-bound sites. Unlike CTCF, PARP1 does not bind
DNA in a sequence-specific manner; it is likely here that PARP1 is recruited to
CTCF-bound sites by CTCF or another binding partner. A growing body of work has recently
implicated CTCF as having an active role in DNA damage repair. It is intriguing to
speculate that CTCF and PARP1 are recruited to the viral genome in a sort of innate
immune response related to the double-stranded DNA nature of the viral genome,
through which the virus has coopted their roles in transcription for its own advantage.
Of the CTCF sites examined in our work, including those at both Cp and Qp latency
promoters,
LMP1
and
BZLF1
promoters, only CTCF at Cp correlated with PAR
enrich-ment by ChIP. In type III latency, Cp is transcriptionally active, while Qp is
transcrip-tionally silenced; it is possible that chromatin marks, lack of DNA methylation, or
specific transcription factors associated with an active promoter are required for
PARylation of CTCF. In breast cancer cells, PARP1 associates with active chromatin
FIG 7PARP inhibition represses Epstein-Barr virus-mediated immortalization and transformation of primary B cells. (A) Primary peripheral blood mononuclear cells (PBMCs) were treated with the immunosuppressive drug FK506 for 1 h and then incubated with EBV particles at an MOI of 30 (high) or 10 (low). Uninfected PBMCs were used as a control. After 24 h, cells were incubated with the indicated PARP inhibitor. EBV infection was assessed by light microscopy analysis of clusters of EBV⫹cells over 4 weeks. White arrows indicate clusters in treated samples. (B)
Untreated and olaparib- or BMN673-treated (PARPi) cells at 3 weeks were subjected to FAIRE-qPCR to quantify open chromatin at the viral Cp promoter. Results are representative of three independent experiments and show means⫾standard deviations. (C) Western blot analysis of EBNA2 and LMP1 expression in untreated samples at 5 weeks postinfection to confirm EBV latency in LCL outgrowths. Actin served as a cellular loading control.
on November 6, 2019 by guest
http://jvi.asm.org/
[image:9.585.47.404.70.380.2]marks, CTCF, and DNase hypersensitivity sites, supporting the idea that CTCF
PARyla-tion could preferentially associate with active chromatin marks in the EBV genome (31).
PARylation of CTCF as an active chromatin marker would not explain why CTCF at the
active
LMP1
promoter is not PARylated in type III latent cells. CTCF binding at LMP1 is
unique among other binding sites across the EBV genome for its strong cooccupancy
with both cohesin and CTCF (32) and its proximity to a PAX5 binding site (33). It is
possible that PARylation regulates CTCF function at some loci (e.g., Cp), while at other
sites (e.g., the
LMP1-LMP2
promoter) cohesin or other factors control CTCF. Recently, we
showed that LMP1 expression is necessary for the activation of PARP1 observed in type
III latently infected cells (22). Thus, a PARylation-independent function of CTCF at the
LMP1-LMP2 promoter could represent an evolutionary mechanism to ensure PARP1
activation through LMP1 and subsequent epigenetic regulation during EBV infection.
EBV has likely coopted this mechanism of locus-specific CTCF PARylation for its own
advantage. Differential CTCF PARylation at Cp and Qp could dictate CTCF function by
latency type. For example, in type III latency, OriP forms a CTCF-mediated chromatin
loop with the active Cp promoter (12). It is possible that PARylation of CTCF at Cp in
type III latency functions to promote three-dimensional chromatin looping with OriP. As
a result, OriP specifically loops with the PARylated Cp promoter but not the
unPARy-lated Qp promoter, maintaining the proper latency type-specific enhancer-promoter
interaction. Thus, PARylation of CTCF could serve as a mechanism to stabilize or
destabilize alternative chromatin loops across the viral genome in EBV latency. Whether
CTCF
PARP1
PARP1
K4me3
K27me3
Me
Me Me Me
Me
Me
K27me3 K27me3
K27me3 K27me3 K27me3
K4me3 K4me3
K4me3
PARP Activation
PARP Inhibition
Chromatin Repressed
Chromatin
Active
Chromatin Poly(ADP)ribose DNA methylation
Cp Active
Cp Inactive
Legend
Type III Latency
Type III Latency
FIG 8In type III latency, CTCF is PARylated by PARP1 at Cp to maintain the open chromatin landscape and transcription. (Top) During type III latency, PARP1 binds along with PARylated CTCF at the active Cp promoter. PARP1 and CTCF cooperate at Cp to promote open chromatin structure and active transcription by maintaining decondensed nucleosomes and H3K4me3 and preventing DNA methylation. (Bottom) PARP inhibition results in the loss of CTCF at Cp and is associated with the formation of a repressive chromatin environment at the Cp promoter. After PARP inhibition, the Cp promoter becomes enriched for DNA methylation, the repressive H3K27me3 mark, and the nucleosomes are compacted, resulting in decreased type III latency transcription.
on November 6, 2019 by guest
http://jvi.asm.org/
[image:10.585.42.401.74.391.2]this mechanism is at play during EBV latency remains an open question that is actively
under investigation in our laboratory. Nevertheless, our results are consistent with the
possibility that the role of PARP1 in EBV latency is dependent on its well-characterized
activity in CTCF-mediated chromatin organization and may also involve currently
unknown interactions with other epigenetic factors.
PARP1 binding to DNA is mutually exclusive with DNA methylation and tends to
associate with CTCF in regions of open chromatin (31). When EBV DNA enters a cell, it
becomes gradually methylated, a process that is integral to proper latency
establish-ment and gene expression (34, 35). It is thus possible that the virus has coopted PARP1
and CTCF to stably maintain DNA methylation in the regulation of viral latency. In
accordance with our observations in type III latent cells, and because CTCF binding at
Cp is important to sustain type III latency, we predicted that PARP inhibition might also
prevent the establishment of type III latency. Indeed, we observed that PARP inhibition
prevents the outgrowth of LCLs and results in a compact, repressive chromatin
land-scape at Cp. Due to technical limitations, we were not able to assess viral gene
expression in the PARP-inhibited cells, so it is unclear how the few cells that did survive
were maintained. We were unable to obtain enough material to perform ChIP to
understand how CTCF binding may differ between the untreated and PARP-inhibited
cells, although FAIRE indicates that Cp is highly compacted and thus likely repressed at
3 weeks postinfection. Pooling of cells for experiments at earlier time points after
infection could provide insight into viral gene expression and chromatin changes and
reveal whether viral infection ever occurs in these cells and what might drive the
transient outgrowth of the LCLs. Based on our studies in type III latent LCLs, we might
predict that CTCF is unable to bind to Cp with PARP inhibition, allowing for the spread
of DNA methylation and silencing of Cp. These experiments do not exclude the likely
possibility that PARP inhibition also affects the host genome and negatively impacts
normal B cell biology to prevent the outgrowth of LCLs from PBMCs. Indeed, work from
our laboratory does suggest that PARP inhibition affects transcription of B cell-related
pathways (22). However, the less open chromatin conformation structure of the EBV
genome in infected cells treated with PARP inhibitors and the repression of viral gene
expression in the context of PARP inhibition provide compelling evidence that PARP1
activity is biologically relevant for the EBV epigenome during infection. Although
distinguishing the specific role of PARP activity on the host epigenome during viral
infection is important, answering this question is beyond the scope of this study.
Nevertheless, these data demonstrate an important role for PARP activity in the
establishment of EBV latency and outgrowth of immortalized LCLs.
A number of EBV-associated cancers, including posttransplant- and AIDS-associated
lymphomas, rely on type III latent protein expression to drive tumorigenesis. Here, we
show that PARP inhibition deregulates expression of Cp and subsequently reduces
EBNA2 expression. Although EBNA2 is not an oncoprotein
per se, it promotes several
tumorigenic pathways, and its expression is associated with poor survival in diffuse
large B cell lymphoma (36–38). Thus, the reduction of EBNA2 expression by olaparib
could be an effective therapeutic approach to treat EBV type III latency-associated
cancers. We did not, however, observe downregulation of the LMP1 oncoprotein (data
not shown). Other work from our laboratory, however, demonstrates that PARP
inhi-bition does attenuate LMP1-induced tumorigenesis in a colony formation assay (22). It
is possible that 72 h of PARP inhibition is sufficient to downregulate EBNA2 expression
but not long enough to reduce EBNA2 transactivation of LMP1 and ultimately
down-regulate expression from the
LMP1-LMP2
promoter. Long-term exposure to PARP
inhibitors could downregulate LMP1 expression to eliminate expression of the potent
oncoprotein. Further, our data suggest that PARP inhibition prevents the establishment
of latency, so PARP inhibitors could also help to eliminate viral reservoirs in patients.
In summary, our results, together with previous work from our group and others,
reveal a new function for PARP1 activity in the regulation of EBV latency, demonstrating
that PARP1 and PARylation are important mechanisms by which the viral epigenome is
regulated. Our work adds an important branch to the existing model of how, in the
on November 6, 2019 by guest
http://jvi.asm.org/
context of EBV latency, PARP1 activity regulates viral chromatin and how two
epige-netic factors, CTCF and PARP1, communicate to regulate viral gene expression through
modifying chromatin. We acknowledge that this work does not explain at the
mech-anistic level how PARylation affects the CTCF-mediated three-dimensional organization
of EBV chromosome, and we are actively working to characterize the global
three-dimensional organization of the EBV genome and further assess the mechanism by
which PARP1 alters viral three-dimensional genome structure through CTCF. Gaining a
better insight into the PARP1/CTCF interaction may reveal new important molecular
steps that are necessary for EBV to regulate viral gene expression during latency.
MATERIALS AND METHODS
Cell culture and treatment.Cell lines were maintained in a humidified atmosphere containing 5% CO2at 37°C. B cell lines were cultured in suspension in RPMI 1640 supplemented with fetal bovine serum
at a concentration of either 10% (Mutu and Kem I) or 15% (LCL, Kem III, and GM12878). All cell media were supplemented with 1% penicillin-streptomycin. Olaparib (Selleck Chemical) was dissolved in dimethyl sulfoxide (DMSO) and diluted in the appropriate cell medium for treatment. B cells were treated with 5M olaparib for 72 h or as specified. The concentration of olaparib used in experiments does not produce a cellular phenotype and does not induce DNA damage.
ChIP-seq. Chromatin immunoprecipitation with next-generation sequencing (ChIP-seq) was per-formed as previously described (39, 40), with minor changes. A total of 2.5⫻107cells were cross-linked
with 1% formaldehyde for 10 min, and chromatin was sonicated with a Qsonica sonicator. One-tenth of the sonicated chromatin was collected and used as input material, while the rest of the chromatin was immunoprecipitated using 5g of CTCF antibody (Millipore), 5g of PARP1 antibody (Active Motif), or 5g of normal rabbit IgG (Santa Cruz) in LCLs. DNA fragments of⬃150 to 300 bp were visualized by agarose gel purification. Immunoprecipitated DNA was ligated to adapter primers using the TruSeq ChIP library preparation kit (Illumina) and then sequenced using the Illumina HiSeq 2500 platform according to the manufacturer’s recommendations (Illumina) at the Fox Chase Cancer Center Sequencing Facility. For both untreated and olaparib-treated LCLs,⬃15 ng of PARP1-immunoprecipitated or input DNA was recovered from each biological replicate, while⬃15 ng of CTCF-immunoprecipitated DNA was recovered after pooling two biological replicates.
Sequencing data for ChIP-seq and input experiments from untreated and treated LCLs were aligned to the EBV genome (GenBank accession numberNC_007605) using the Bowtie algorithm (41, 42), and all of the redundant tags were removed before downstream analysis. Peak calling was performed using the Homer algorithm (43) with input DNA used as a reference set. All peaks with false discovery rates (FDRs) of 1% for untreated or treated cells were overlapped to create a list of unique binding sites and used for further analysis. Integrative Genomics Viewer was used for data visualization (44). All ChIP-seq data have been deposited in GEO.
ChIP-qPCR.ChIP assays were performed according to the Upstate Biotechnology, Inc., protocol as described previously, with minor modifications (22). Briefly, cells were fixed in 1% formaldehyde for 15 min, and DNA was sonicated using a Qsonica sonicator to generate 200- to 500-bp fragments. Chromatin was immunoprecipitated with polyclonal antibodies to PARP1 (Active Motif), CTCF (Millipore), H3K27me3 (Active Motif), and H3K4me3 (Active Motif). Immunoprecipitation of PAR was carried out using PAR resin (Tulip Biolabs). Real-time PCR was performed with a master mix containing 1⫻Maxima SYBR green, 0.25
M primers, and 1/50 of the ChIP DNA per well. Quantitative PCRs were carried out in triplicate using the ABI StepOnePlus PCR system. Data were analyzed by the ΔΔCTmethod (whereCTis threshold cycle)
relative to DNA input and normalized to the IgG control. All primers used for qPCR are listed in Table S1 in the supplemental material.
Immunoprecipitation.For each immunoprecipitation reaction, 3⫻106LCLs were washed in cold
phosphate-buffered saline (PBS) and resuspended in 3 ml of RIPA buffer (1% NP-40, 1% DOC, 0.1% SDS, 150 mM NaCl, 10 mM Tris-HCl [pH 7.4]). Cells were Dounce homogenized with 10 strokes using a tight-fitting pestle. To allow the SDS to solubilize, the protein cellular solution was rotated at 4°C, and after 30 min the solution was centrifuged at 10,000⫻gfor 5 min. Fiftyl of cell solution was saved as control input. One ml of cell lysate per IP was then used and incubated with 2.5g of polyclonal antibodies to PARP1 (Active Motif), CTCF (Millipore), or normal rabbit IgG at 4°C. After overnight incubation, the immunocomplexes were collected by incubating with 100l of 50% slurry protein A Sepharose beads (Thermo Fisher Scientific). After 2 h the beads were collected by centrifugation and washed three times with 1 ml low-salt NET buffer (50 mM Tris-HCl, 150 mM NaCl, 5 mM EDTA, 0.5% NP-40 [pH 7.4]) and three times with 1 ml high-salt NET buffer (50 mM Tris-HCl, 300 mM NaCl, 5 mM EDTA, 0.5% NP-40 [pH 7.4]). After the last wash, the beads were resuspended in 50l of 2⫻Laemmli buffer and boiled for 15 min. Immunoprecipitated proteins were resolved by SDS-PAGE gel and analyzed by Western blotting with monoclonal antibody to PARP1 (Trevigen) diluted in 5% PBS plus Tween (PBS-T) according to the manufacturer’s instructions.
FAIRE.Formaldehyde-assisted isolation of regulatory elements (FAIRE) assay was performed accord-ing to an established protocol (45). Per sample, 1⫻107LCLs were cross-linked with 1% formaldehyde,
and the reaction was quenched by adding glycine to a final concentration of 125 mM after 5 min. Cells were washed twice with PBS and cell pellets collected by centrifugation at 300⫻gfor 5 min at 4°C. Fixed cells were then resuspended in cold lysis buffer (1% SDS, 10 mM EDTA, 50 mM Tris [pH 8.0]), and chromatin was sonicated as described for ChIP to generate 300- to 500-bp fragments. One-tenth of the
on November 6, 2019 by guest
http://jvi.asm.org/
chromatin was saved and used as input material, and the remaining chromatin was diluted with 3 volumes of dilution buffer (0.01% SDS, 1.1% Triton X-100, 1.2 mM EDTA, 16.7 mM Tris [pH 8.0], 167 mM NaCl). Chromatin was centrifuged at 15,000⫻gfor 5 min at 4°C to pellet cell debris, and DNA was isolated from the supernatant by phenol-chloroform extraction and ethanol precipitation. The DNA pellet was resuspended in 100l of 10 mM Tris-HCl (pH. 7.5) and incubated with 10g of RNase A (New England BioLabs) at 37°C. After 30 min, 20g of proteinase K (Roche) was added to the samples and incubated at 55°C for 1 h and then at 65°C to reverse any DNA-DNA cross-links. The de-cross-linked DNA was purified with Zymo Spin I columns and eluted twice with 25l of 10 mM Tris-HCl (pH. 7.5). For quantitative PCR analysis, the recovery of FAIRE-extracted DNA was assessed by qPCR and compared to results for input DNA using the ΔΔCTmethod. All primers used for qPCR are listed in Table S1 in the
supplemental material.
For next-generation sequencing, 20 ng of input DNA and 20 ng of FAIRE-DNA, each combined from two biological replicates, were used to prepare sequencing libraries using Illumina protocols and subjected to Illumina HiSeq 2500 sequencing according to the manufacturer’s recommendations (Illu-mina). Library preparation and DNA sequencing were performed at the Fox Chase Cancer Center Sequencing Facility. FAIRE-seq analysis was performed as described above for ChIP-seq. All FAIRE-seq data have been deposited in GEO.
Methylated DNA immunoprecipitation (MeDIP).DNA was extracted from 2⫻106cells with a
GeneJET genomic DNA purification kit (Thermo Scientific) according to the manufacturer’s instructions. A total of 2g of DNA was sonicated to between 200 and 300 bp. Samples were boiled for 10 min and immediately cooled on ice. To each sample, 50l of 10⫻immunoprecipitation buffer (IP buffer; 1.4 M NaCl, 0.5% Triton X-100) and 5g of 5-methylcytosine antibody (Active Motif) were added, followed by incubation overnight at 4°C. The immunocomplexes were precipitated by adding 50l of Dynabeads (Life Technologies) and rotated for 2 h at room temperature. Beads were collected with a magnetic rack and washed three times with 500l of 1⫻IP buffer. Beads were incubated at 50°C for 2 h with shaking in 500 l of proteinase K digestion buffer (50 mM Tris [pH 8.0], 10 mM EDTA, 0.5% SDS, 1 mg of proteinase K/ml). DNA was extracted twice by phenol-chloroform, followed by ethanol precipitation. DNA was analyzed by quantitative PCR. Two percent of the genomic DNA was used as input material. All primers used for qPCR are listed in Table S1.
qRT-PCR.For quantitative reverse transcription-PCR (qRT-PCR), RNA was extracted from 2⫻106cells
using TRIzol (Thermo Fisher Scientific) according to the manufacturer’s instructions. SuperScript II reverse transcriptase (Invitrogen) was used to generate randomly primed cDNA from 1g of total RNA. A 50-ng cDNA sample was analyzed in triplicate by quantitative PCR using the ABI StepOnePlus system. Data were analyzed by the ΔΔCTmethod relative to expression of the B cell marker GusB and normalized to
untreated controls. All primers used for qPCR are listed in Table S1.
Western blot analysis.Cell lysates were prepared in radioimmunoprecipitation assay (RIPA) lysis buffer (50 mM Tris-HCl, pH 7.4, 150 mM NaCl, 0.25% deoxycholic acid, 1% NP-40, 1 mM EDTA; Millipore) supplemented with 1⫻protease inhibitor cocktail (Thermo Scientific). Protein extracts were obtained by centrifugation at 3,000⫻gfor 10 min at 4°C. Protein concentration was measured using a bicinchoninic acid (BCA) protein assay (Pierce). Lysates were boiled with 1⫻ Laemmli sample buffer (Bio-Rad) containing 1.25%-mercaptoethanol (Sigma-Aldrich). Proteins were resolved by gel electrophoresis on a 4 to 20% polyacrylamide gradient Mini-Protean TGX precast gel (Bio-Rad) and transferred to an Immobilon-P membrane (Millipore). Membranes were blocked in 5% milk in PBS-T for 1 h at room temperature and incubated overnight at 4°C with primary antibodies against PARP1 (Active Motif), EBNA2 (Abcam), LMP1 (Abcam), and actin (Sigma-Aldrich).
In vitroimmortalization of peripheral blood mononuclear cells.Primary peripheral blood mono-nuclear cells (PBMCs) were purchased from the ATCC (ATCC-PCR-800-011). PBMCs were incubated with the immunosuppressive drug FK506 for 1 h and then incubated with EBV particles at either low MOI (10) or high MOI (30). Control PBMCs were not exposed to EBV particles. After 24 h, EBV-infected PBMCs were incubated with or without either 10M olaparib or 100 nM BMN673 to inhibit PARP activity. EBV infection was assessed by evaluating clusters of EBV-positive cells by light microscopy over 4 weeks.
Statistical analysis. All experiments presented were conducted at least in triplicate to ensure reproducibility of results. The Prism statistical software package (GraphPad) was used to identify statistically significant differences between experimental conditions and control samples, using Student’s
ttest as indicated in the figure legends.
Accession number(s).The ChIP-seq and FAIRE-seq data have been deposited in the GEO database under accession numberGSE115829.
SUPPLEMENTAL MATERIAL
Supplemental material for this article may be found at
https://doi.org/10.1128/JVI
.00755-18
.
SUPPLEMENTAL FILE 1,
PDF file, 0.1 MB.
ACKNOWLEDGMENTS
We thank Jeffery T. Sample (Pennsylvania State College of Medicine) and Paul M.
Lieberman (The Wistar Institute) for providing cell lines.
Research reported in this publication was supported by the National Institute of
on November 6, 2019 by guest
http://jvi.asm.org/
Allergy and Infectious Diseases of the National Institutes of Health under award number
R01AI130209.
The content is solely the responsibility of the authors and does not necessarily
represent the official views of the National Institutes of Health. Study design, data
collection and interpretation, and the publication of the work were not influenced by
our funding source.
REFERENCES
1. Thorley-Lawson DA, Hawkins JB, Tracy SI, Shapiro M. 2013. The patho-genesis of Epstein-Barr virus persistent infection. Curr Opin Virol 3:227–232.https://doi.org/10.1016/j.coviro.2013.04.005.
2. Thorley-Lawson DA. 2015. EBV persistence–introducing the virus. Curr Top Microbiol Immunol 390:151–209.
3. Tempera I, Lieberman PM. 2014. Epigenetic regulation of EBV persis-tence and oncogenesis. Semin Cancer Biol 26:22–29.https://doi.org/10 .1016/j.semcancer.2014.01.003.
4. Lieberman PM. 2015. Chromatin structure of Epstein-Barr virus latent episomes. Curr Top Microbiol Immunol 390:71–102.
5. Pentland I, Parish J. 2015. Targeting CTCF to control virus gene expression: a common theme amongst diverse DNA viruses. Viruses 7:3574 –3585. https://doi.org/10.3390/v7072791.
6. Washington SD, Edenfield SI, Lieux C, Watson ZL, Taasan SM, Dhummak-upt A, Bloom DC, Neumann DM. 2018. Depletion of the insulator protein CTCF results in HSV-1 reactivation in vivo. J Virol 92:e00173-18.https:// doi.org/10.1128/JVI.00173-18.
7. Chau CM, Zhang X-Y, McMahon SB, Lieberman PM. 2006. Regulation of Epstein-Barr virus latency type by the chromatin boundary factor CTCF. J Virol 80:5723–5732.https://doi.org/10.1128/JVI.00025-06.
8. Day L, Chau CM, Nebozhyn M, Rennekamp AJ, Showe M, Lieberman PM. 2007. Chromatin profiling of Epstein-Barr virus latency control region. J Virol 81:6389 – 6401.https://doi.org/10.1128/JVI.02172-06.
9. Holdorf MM, Cooper SB, Yamamoto KR, Miranda JL. 2011. Occupancy of chromatin organizers in the Epstein-Barr virus genome. Virology 415: 1–5.https://doi.org/10.1016/j.virol.2011.04.004.
10. Arvey A, Tempera I, Lieberman P. 2013. Interpreting the Epstein-Barr virus (EBV) epigenome using high-throughput data. Viruses 5:1042– 4254.https:// doi.org/10.3390/v5041042.
11. Tempera I, Wiedmer A, Dheekollu J, Lieberman PM. 2010. CTCF prevents the epigenetic drift of EBV latency promoter Qp. PLoS Pathog 6:e1001048.https://doi.org/10.1371/journal.ppat.1001048.
12. Tempera I, Klichinsky M, Lieberman PM. 2011. EBV latency types adopt alternative chromatin conformations. PLoS Pathog 7:e1002180.https:// doi.org/10.1371/journal.ppat.1002180.
13. El-Kady A, Klenova E. 2005. Regulation of the transcription factor, CTCF, by phosphorylation with protein kinase CK2. FEBS Lett 579:1424 –1434. https://doi.org/10.1016/j.febslet.2005.01.044.
14. MacPherson MJ, Beatty LG, Zhou W, Du M, Sadowski PD. 2009. The CTCF insulator protein is posttranslationally modified by SUMO. Mol Cell Biol 29:714 –725.https://doi.org/10.1128/MCB.00825-08.
15. Yu W, Ginjala V, Pant V, Chernukhin I, Whitehead J, Docquier F, Farrar D, Tavoosidana G, Mukhopadhyay R, Kanduri C, Oshimura M, Feinberg AP, Lobanenkov V, Klenova E, Ohlsson R. 2004. Poly(ADP-ribosyl)ation reg-ulates CTCF-dependent chromatin insulation. Nat Genet 36:1105–1110. https://doi.org/10.1038/ng1426.
16. De Vos M, Schreiber V, Dantzer F. 2012. The diverse roles and clinical relevance of PARPs in DNA damage repair: current state of the art. Biochem Pharmacol 84:137–146.https://doi.org/10.1016/j.bcp.2012.03.018. 17. Lord CJ, Ashworth A. 2017. PARP inhibitors: synthetic lethality in the
clinic. Science 355:1152–1158.https://doi.org/10.1126/science.aam7344. 18. Kraus WL. 2008. Transcriptional control by PARP-1: chromatin modula-tion, enhancer-binding, coregulamodula-tion, and insulation. Curr Opin Cell Biol 20:294 –302.https://doi.org/10.1016/j.ceb.2008.03.006.
19. Ciccarone F, Zampieri M, Caiafa P. 2017. PARP1 orchestrates epigenetic events setting up chromatin domains. Semin Cell Dev Biol 63:123–134. https://doi.org/10.1016/j.semcdb.2016.11.010.
20. Farrar D, Rai S, Chernukhin I, Jagodic M, Ito Y, Yammine S, Ohlsson R, Murrell A, Klenova E. 2010. Mutational analysis of the poly(ADP-ribosyl)ation sites of the transcription factor CTCF provides an insight into the mechanism of its regulation by poly(ADP-ribosyl)ation. Mol Cell Biol 30:1199 –1216.https://doi.org/10.1128/MCB.00827-09.
21. Ong C-T, Van Bortle K, Ramos E, Corces VG. 2013. Poly(ADP-ribosyl)ation regulates insulator function and intrachromosomal interactions in Dro-sophila. Cell 155:148 –159.https://doi.org/10.1016/j.cell.2013.08.052. 22. Martin KA, Lupey LN, Tempera I. 2016. Epstein-Barr virus oncoprotein
LMP1 mediates epigenetic changes in host gene expression through PARP1. J Virol 90:8520 – 8530.https://doi.org/10.1128/JVI.01180-16. 23. Lupey-Green LN, Moquin SA, Martin KA, McDevitt SM, Hulse M, Caruso
LB, Pomerantz RT, Miranda JL, Tempera I. 2017. PARP1 restricts Epstein Barr virus lytic reactivation by binding the BZLF1 promoter. Virology 507:220 –230.https://doi.org/10.1016/j.virol.2017.04.006.
24. Hughes DJ, Marendy EM, Dickerson CA, Yetming KD, Sample CE, Sample JT. 2012. Contributions of CTCF and DNA methyltransferases DNMT1 and DNMT3B to Epstein-Barr virus restricted latency. J Virol 86:1034 –1045. https://doi.org/10.1128/JVI.05923-11.
25. Guastafierro T, Cecchinelli B, Zampieri M, Reale A, Riggio G, Sthandier O, Zupi G, Calabrese L, Caiafa P. 2008. CCCTC-binding factor activates PARP-1 affecting DNA methylation machinery. J Biol Chem 283: 21873–21880.https://doi.org/10.1074/jbc.M801170200.
26. Farrar D, Chernukhin I, Klenova E. 2011. Generation of poly(ADP-ribosyl)ation deficient mutants of the transcription factor, CTCF, p 293–312.InTulin AV (ed), Poly(ADP-ribose) polymerase. Humana Press, Totowa, NJ.
27. Phillips-Cremins JE, Corces VG. 2013. Chromatin insulators: linking ge-nome organization to cellular function. Mol Cell 50:461– 474.https://doi .org/10.1016/j.molcel.2013.04.018.
28. Ong C-T, Corces VG. 2014. CTCF: an architectural protein bridging ge-nome topology and function. Nat Rev Genet 15:234 –246.https://doi .org/10.1038/nrg3663.
29. Lieberman PM. 2013. Keeping it quiet: chromatin control of gammaher-pesvirus latency. Nat Rev Microbiol 11:863– 875.https://doi.org/10.1038/ nrmicro3135.
30. Salamon D, Banati F, Koroknai A, Ravasz M, Szenthe K, Bathori Z, Bakos A, Niller HH, Wolf H, Minarovits J. 2009. Binding of CCCTC-binding factor in vivo to the region located between Rep*and the C promoter of Epstein-Barr virus is unaffected by CpG methylation and does not correlate with Cp activity. J Gen Virol 90:1183–1189.https:// doi.org/10.1099/vir.0.007344-0.
31. Nalabothula N, Al-jumaily T, Eteleeb AM, Flight RM, Xiaorong S, Moseley H, Rouchka EC, Fondufe-Mittendorf YN. 2015. Genome-wide profiling of PARP1 reveals an interplay with gene regulatory regions and DNA methylation. PLoS One 10:e0135410. https://doi.org/10 .1371/journal.pone.0135410.
32. Chen H-S, Martin KA, Lu F, Lupey LN, Mueller JM, Lieberman PM, Tempera I. 2014. Epigenetic deregulation of the LMP1/LMP2 locus of Epstein-Barr virus by mutation of a single CTCF-cohesin binding site. J Virol 88:1703–1713.https://doi.org/10.1128/JVI.02209-13.
33. Arvey A, Tempera I, Tsai K, Chen H-S, Tikhmyanova N, Klichinsky M, Leslie C, Lieberman PM. 2012. An atlas of the Epstein-Barr virus transcriptome and epigenome reveals host-virus regulatory interactions. Cell Host Microbe 12:233–245.https://doi.org/10.1016/j.chom.2012.06.008. 34. Woellmer A, Hammerschmidt W. 2013. Epstein-Barr virus and host cell
methylation: regulation of latency, replication and virus reactivation. Curr Opin Virol 3:260 –265.https://doi.org/10.1016/j.coviro.2013.03.005. 35. Hammerschmidt W. 2015. The epigenetic life cycle of Epstein-Barr virus.
Curr Top Microbiol Immunol 390:103–117.
36. Kaiser C, Laux G, Eick D, Jochner N, Bornkamm GW, Kempkes B. 1999. The proto-oncogene c-myc is a direct target gene of Epstein-Barr virus nuclear antigen 2. J Virol 73:4481– 4484.
37. Höfelmayr H, Strobl LJ, Marschall G, Bornkamm GW, Zimber-Strobl U. 2001. Activated Notch1 can transiently substitute for EBNA2 in the maintenance of proliferation of LMP1-expressing immortalized B cells. J Virol 75:2033–2040.https://doi.org/10.1128/JVI.75.5.2033-2040.2001.
on November 6, 2019 by guest
http://jvi.asm.org/
38. Stuhlmann-Laeisz C, Borchert A, Quintanilla-Martinez L, Hoeller S, Tzankov A, Oschlies I, Kreuz M, Trappe R, Klapper W. 2016. In Europe expression of EBNA2 is associated with poor survival in EBV-positive diffuse large B-cell lymphoma of the elderly. Leukemia Lymphoma 57:39 – 44.https://doi.org/10.3109/10428194.2015.1040014.
39. Plasschaert RN, Vigneau S, Tempera I, Gupta R, Maksimoska J, Everett L, Davuluri R, Mamorstein R, Lieberman PM, Schultz D, Hannenhalli S, Bartolomei MS. 2014. CTCF binding site sequence differences are asso-ciated with unique regulatory and functional trends during embryonic stem cell differentiation. Nucleic Acids Res 42:774 –789.https://doi.org/ 10.1093/nar/gkt910.
40. Tempera I, De Leo A, Kossenkov AV, Cesaroni M, Song H, Dawany N, Showe L, Lu F, Wikramasinghe P, Lieberman PM. 2016. Identification of MEF2B, EBF1, and IL6R as direct gene targets of Epstein-Barr virus (EBV) nuclear antigen 1 critical for EBV-infected B-lymphocyte survival. J Virol 90:345–355.https://doi.org/10.1128/JVI.02318-15.
41. Zhang Y, Liu T, Meyer CA, Eeckhoute J, Johnson DS, Bernstein BE, Nusbaum C, Myers RM, Brown M, Li W, Liu XS. 2008. Model-based analysis of ChIP-Seq (MACS). Genome Biol 9:R137.https://doi.org/10.1186/gb-2008-9-9-r137. 42. Langmead B, Salzberg SL. 2012. Fast gapped-read alignment with
Bow-tie 2. Nat Methods 9:357–359.
43. Heinz S, Benner C, Spann N, Bertolino E, Lin YC, Laslo P, Cheng JX, Murre C, Singh H, Glass CK. 2010. Simple combinations of lineage-determining transcription factors prime cis-regulatory elements required for macro-phage and B cell identities. Mol Cell 38:576 –589. https://doi.org/10 .1016/j.molcel.2010.05.004.
44. Robinson JT, Thorvaldsdóttir H, Winckler W, Guttman M, Lander ES, Getz G, Mesirov JP. 2011. Integrative genomics viewer. Nat Biotechnol 29: 24 –26.https://doi.org/10.1038/nbt.1754.
45. Simon JM, Giresi PG, Davis IJ, Lieb JD. 2012. Using formaldehyde-assisted isolation of regulatory elements (FAIRE) to isolate active regulatory DNA. Nat Protoc 7:256 –267.https://doi.org/10.1038/nprot.2011.444.
on November 6, 2019 by guest
http://jvi.asm.org/