UNIVERSITI TEKNIKAL MALAYSIA MELAKA
EFFECTS OF INLET VELOCITY ON FLUID FLOW IN
T-JUNCTION PIPE FOR COMBINING FLOW
This report submitted in accordance with requirement of the Universiti Teknikal Malaysia Melaka (UTeM) for the Bachelor Degree of Manufacturing Engineering
Technology (Process and Technology) with Honours
by
MUHAMMAD IRSYAD HAZIEM BIN ZULKIPLI
B071310899
940920-06-5975
FACULTY OF ENGINEERING TECHNOLOGY 2016
SULIT TERHAD
TIDAK TERHAD
BORANG PENGESAHAN STATUS LAPORAN PROJEK SARJANA MUDA
TAJUK: Effects of Inlet Velocity of Fluid Flow in T-Junction Pipe for Combining Flow
SESI PENGAJIAN: 2015/16 Semester 2
Saya MUHAMMAD IRSYAD HAZIEM BIN ZULKIPLI
mengaku membenarkan Laporan PSM ini disimpan di Perpustakaan Universiti Teknikal
Malaysia Melaka (UTeM) dengan syarat-syarat kegunaan seperti berikut:
1. Laporan PSM adalah hak milik Universiti Teknikal Malaysia Melaka dan penulis. 2. Perpustakaan Universiti Teknikal Malaysia Melaka dibenarkan membuat salinan untuk
tujuan pengajian sahaja dengan izin penulis.
3. Perpustakaan dibenarkan membuat salinan laporan PSM ini sebagai bahan pertukaran antara institusi pengajian tinggi.
4. **Sila tandakan ( )
(Mengandungi maklumat yang berdarjah keselamatan atau
kepentingan Malaysia sebagaimana yang termaktub dalam
AKTA RAHSIA RASMI 1972)
(Mengandungi maklumat TERHAD yang telah ditentukan oleh
organisasi/badan di mana penyelidikan dijalankan) Disahkan oleh:
Cop Rasmi: Alamat Tetap: No 25, JLN MEGAH
5, TTAMAN MEGAH, 82000,
PONTIAN, JOHOR
Tarikh:
________________________
DECLARATION
I hereby, declared this report entitled “EFFECTS OF INLET VELOCITY ON FLUID FLOW IN T-JUNCTION PIPE FOR COMBINING FLOW” is the results of my own
research except as cited in references
Signature : ……….
Author’s Name : MUHAMMAD IRSYAD HAZIEM BIN ZULKIPLI Date : 9 December 2016
APPROVAL
This report is submitted to the Faculty of Engineering Technology of UTeM as a partial fulfillment of the requirements for the degree of Bachelor of Manufacturing Engineering Technology (Process And Technology) with Honours. The member of the supervisory is
as follow:
……… (Mr. Iskandar Bin Waini)
ABSTRAK
Objektif tesis sarjana muda yang telah dijalankan ialah untuk mendedahkan kaedah dan pandangan bagaimana teknologi Sistem Perpaipan boleh digunakan untuk mencapai penggunaan optimum mereka dalam matlamat industri. Dalam kajian ini, medan aliran simpang perpaipan telah dianalisis dengan menggunakan AcuField View simulasi dalam perisian pengaturcaraan HyperWorks. Keputusan simulasi dikenal pasti sebagai variasi puncak halaju di simpang dengan frekuensi yang berbeza dan perbezaan fasa arah masuk, sementara itu, eddy dan halaju kejutan wujud di sudut simpang, dan had kerja telah diabaikan. Walaupun eddy hilang dalam T-simpang, perbezaan halaju dan kehilangan tekanan masih terlalu besar. Bagi menangani masalah ini, jenis cecair telah ditukarkan kepada tiga jenis sahaja iaitu air sebagai jmedium utama aliran yang digunakan manakala dua lainjenis cecair ialah Diesel dan Ammonia. Selain itu, jenis bahan yang digunakan untuk membuat paip seperti besi bergalvani, besi tahan karat, dan tembaga juga diabaikan kerana hanya memberi tumpuan kepada analisis cecair yang bermakna geseran tidak dipertimbangkan dalam kajian ini. Melalui pengiraan kehilangan tekanan dari paip, ia telah mendapati bahawa halaju masuk yang lebih tinggi menyebabkan kehilangan tekanan yang lebih rendah seperti yang telah dinyatakan.
ABSTRACT
The objective of bachelor thesis is to reveal the methods and insights how Piping System technology can be use of significant for attaining their optimal use in industry goals. In this study, the flow fields of T-junction were analyzed by using AcuField View simulation benchmarks in HyperWorks programming software. The simulation results identified the variation rule of velocity peak in T-junction with different frequencies and inlet direction phase differences, meanwhile, the eddy and velocity shock existed in the corner of the T-junction, and limit working state was neglected. Although the eddy disappeared in T-junction, the velocity differences and pressure loss were still too big. To address this problem, type of fluids were change into three type only which is Water as the main type of flow used while other two type of fluids are Diesel and Ammonia. Additionally, type of pipe materials such as Galvanized Iron, Stainless Steel, and Brass were also neglected due to only focusing on fluid analysis which mean friction were not considered in this study. Through the computation of the pressure loss from pipe, it has been found that the higher the inlet velocity the lower pressure loss indicated.
DEDICATION
This thesis is dedicated to my beloved father, for earning an honest living for us and supporting and encouraging me to believe in myself and become who I am right now It is dedicated also to my beloved mother, a strong and gentle soul who taught me to keep trust in Allah S.W.T, believe in hard work which later make me success in the future.
I would like to give my deepest gratitude to my kindest supervisor, Mr. Iskandar Bin Waini for his endless support, mentorship and kindness to me throughout in completion of this project
This is also dedicated to my friends who keep accompany me in the endless day and night to complete this project.
ACKNOWLEDGEMENT
Firstly, I owe a great many thanks to my research advisor, Mr. Iskandar Bin Waini who give continuous support, knowledge, his motivation and guiding and correcting various document of mine with full attention and care. With his guidance, this thesis is complete with success. I astounding with his vast knowledge in area expertise such as HyperWorks, AcuField View and etc. I would state that, Mr. Iskandar is the best advisor and teacher to me.
Secondly, toward my co-supervisor, Mr. Mohd Hidayat Bin Ab Rahman, who give explanations and assisting me to complete this project. I would like to give my gratitude to Mr. Sufian for helping me understand and teaching me the outcome of my thesis and its result.
Many thanks to my fellow friends and classmates for keep push me to complete this projects and fighting until to its fullest together with me. Last but not least, I would like to give my thankfulness to my family which is my parents and my sisters for keep trusting and supporting me in completing this project. Without all people I mentioned above, I would not complete this thesis.
TABLE OF CONTENT
DECLARATION iii
APPROVAL iv
ABSTRAK v
ABSTRACT vi
DEDICATION vii
ACKNOWLEDGEMENT viii
TABLE OF CONTENT ix
LIST OF TABLE xii
LIST OF FIGURE xii
CHAPTER 1 1
INTRODUCTION 1
1.1 Background of Study 1
1.2 Problem Statement 2
1.3 Objective of Project 3
1.4 Project Scope 3
1.5 Layout of Project 4
1.6 Conclusion 5
CHAPTER 2 6
LITERATURE REVIEW 6
2.1 Introduction 6
2.2 Previous Research of Fluid Flow in Pipe 6
2.3 T-junction 90º Pipe 11
2.4 Turbulence Flow 12
2.5 Combining Flow in T-Junction 13
2.6 Newtonian and non-Newtonian Fluids 14
CHAPTER 3 16
METHODOLOGY 16
3.0 Introduction 16
3.1 CATIA Modelling of T-Junction Pipe. 18
3.2 Simulation by Using HyperWorks 27
CHAPTER 4 33
RESULTS AND DISCUSSION 33
4.0. Introduction 33
4.1. Flow Parameters 33
4.2. Inlet Velocity with Streamline Projection 35
4.3 Velocity Flow Fields Analysis in T-Junction Pipes 37
4.4. Pressure Analysis in T-Junction Pipes 42
4.5 Analysis of Flow Rate 45
4.6 Various Viscosity and Density of Fluid 47
CHAPTER 5 51
CONCLUSION 51
5.0 Introduction 51
5.1 Summary of Project 51
5.2 Achievement of Project Objectives 51
5.3 Significant of Research 52
5.4 Problem Occurred during Research 52
5.5 Suggestion for Future work 53
REFERENCES 54
LIST OF TABLE
TABLE 1.1 CHAPTER ORGANIZATION 4
TABLE 3.1METHOD USE IN SIMULATION 29
TABLE 4.1 VISCOSITY AND DENSITY FOR DIFFERENT FLUIDS 50
LIST OF FIGURE
FIGURE 2.1 EXAMPLE OF T-JUNCTION WITH 900 ANGLE 11
FIGURE 2.2 (A) CASE 1 13
FIGURE 2.3 (B) CASE 2 13
FIGURE 2.4 GRAPH OF NEWTONIAN AND NON-NEWTONIAN FLUIDS 15
FIGURE 3.1 FLOW CHART OF THE PROJECT 17
FIGURE 3.2 CATIA V5 SOFTWARE 19
FIGURE 3.3 FIRST STEP IN DESIGNING PIPE 19
FIGURE 3.4 T-JUNCTION PIPE RENAME 20
FIGURE 3.5 YZ PLANE 20
FIGURE 3.6 DRAW CIRCLE WITH CONSTRAINT 21
FIGURE 3.7 PAD THE CIRCLE SHAPE. 21
FIGURE 3.8 MIDPOINT EXTENDED 22
FIGURE 3.9 FIRST COMPLETE PART 22
FIGURE 3.10 ZX WORKBENCH 23
FIGURE 3.11 CREATE CIRCLE 23
FIGURE 3.12 PAD SECOND CIRCLE 24
FIGURE 3.13 SOLID 3D PART 24
FIGURE 3.14 CREATE SHELL AT THREE FACES 25
FIGURE 3.15 HOLLOW INNER PART 25
FIGURE 3.16 CREATE EDGE FILLET 26
FIGURE 3.17 COMPLETED PIPES DESIGN 26
FIGURE 3.18 MAIN STAGE OF HYPERWORKS SIMULATION 27
FIGURE 3.19 CFD GENERAL PROCESSES 28
FIGURE 4.1 SCHEMATIC DIAGRAM OF T-JUNCTION 34
FIGURE 4.2 STREAMLINE FLOW FOR CASE 1 35
FIGURE 4.3 STREAMLINE FLOW FOR CASE 2 36
FIGURE 4.4 VELOCITY PROFILES AT 25.4 MM BRANCH PIPE WITH VARIOUS
INLET 38
FIGURE 4.5 VELOCITY PROFILES AT 25.4 MM BRANCH PIPE WITH VARIOUS
INLET VELOCITY FOR CASE 2 40
FIGURE 4.6 PRESSURE FIELDS WITH VARIOUS INLET VELOCITIES FOR CASE
1 42
FIGURE 4.7 PRESSURE FIELDS WITH VARIOUS VELOCITIES FOR CASE 2 43 FIGURE 4.8 VELOCITY CONTOUR FOR FLOW RATE OF DIFFERENT INLET
BRANCHES 45
FIGURE 4.9 PRESSURE CONTOUR FOR FLOW RATE OF DIFFERENT INLET
BRANCHES 45
FIGURE 4.10 VELOCITY CONTOUR FOR VARIOUS TYPE OF FLUIDS 47 FIGURE 4.11 PRESSURE CONTOUR FOR VARIOUS TYPE OF FLUIDS 48
Chapter 1
INTRODUCTION
1.1 Background of Study
In this chapter pipe networks are usually used to transport and supply the fluid and gases from one location to the other location. All this transportation networks vary from fewer pipes to the other pipes which number might be considering thousands. So many type of components will be involved such as bends, elbows, meters, pumps, turbines, T-junctions and many more components. All of these components will causes loss such as in pressure due to changes in momentum of flow which mainly friction then converted into heat or any energy loss due to turbulence.
. In engineering, piping design were studies especially in design to get efficient transport of gases and liquid such as oil, water, chemical liquid, oxygen, and etc. Industrial process piping can be manufacturing from many types of materials such as Cast iron pipes, fiberglass, wood, steel, aluminum, glass, plastic or pvc pipes, copper, concrete, Asbestos Cement (AC) pipes. The variety types of material is due to its demand which is increasing proportional with the rapid growth of industries.
The head loss which also known as pressure loss may different with each components happen in network, material used for pipe and type of fluid transport among network branches. Based on Vasava, (2007) head losses are of two types major and minor. Major Head losses (also called Frictional losses) are due to rough internal surface of pipe and occur over length of pipe. They are mainly due to friction.
In pipe networks, there are several types of junction or branch which is commonly used in pipe network such as Y-junction pipe, T-junction pipe and Arc junction pipe. For this research, studies about junction will be focus mainly. T-junction is a very familiar component in pipe networks, mainly used to dispense flow from main pipe to several branches of pipes and converge from many pipes to a single main pipe. These type of junction pipes have two types which is combining flow and dividing flow in pipe network. Combining flow happen when pipe from other branches transportation into two inlet and flow to one inlet vice versa with dividing flow which transportation from other branches into one inlet to two outlets. Depending on directions of inlet and outlet both flow has their own properties which in this study, combining flow will be investigated further.
1.2 Problem Statement
Pipe networks are mainly used for transportation and supply of fluids or gasses from one location to the other location. During the process it may causes loss in pressure due to change in momentum of the flow caused to friction and pipe component. Therefore, in this project the understanding of the behavior of fluid and pressure loss that occur in pipe is required. In order to get clear view of the problem simulation of fluid flow in pipe is conducted by using software. The following research questions are considered. Firstly, what is the best direction of various inlet in pipe with minimal pressure loss and best inlet velocity? Then, how to simulate the part model of fluid flow through T-junction by using HyperWorks simulation software according to parameters and condition selected in CATIA V5. After that, what are the effects of inlet velocity of fluid flow in T-junction pipe for combining flow. Lastly, what is the material used for piping.
1.3 Objective of Project
In this project, the following objectives considered; 1. To design T-junction pipes by using CATIA V5.
2. To simulate fluids flowing through T-junction pipe by using Hyperworks.
3. To investigate effect of inlet velocity towards the fluid flow properties and pressure loss at T-junction with equal diameter ratio for combining flow.
1.4 Project Scope
In this research, the following scope has been set to be notified a certain boundaries or limitation including flow of fluid are considered to be turbulent flow which is Spalart-Allmaras model. Fluid have been divided into two part which is laminar and turbulent flow. Type of fluid used for the piping is water with room temperature with neglected friction of walls. The focus of the project fluid mainly for water type rather than gases or oil. The pipeline has the same measurement diameter of 25.4 mm eventually with fixed angle at T-junction of 90º. The eddy shock existed in the corner neglected and flow is restricted to combining flow.
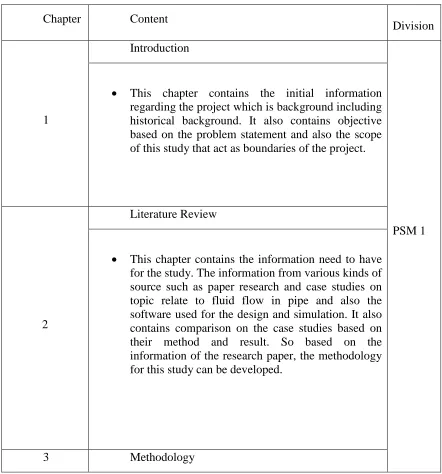
1.5 Layout of Project
Table 1.1 Chapter Organization
Chapter Content
Division
1
Introduction
PSM 1 • This chapter contains the initial information
regarding the project which is background including historical background. It also contains objective based on the problem statement and also the scope of this study that act as boundaries of the project.
2
Literature Review
• This chapter contains the information need to have for the study. The information from various kinds of source such as paper research and case studies on topic relate to fluid flow in pipe and also the software used for the design and simulation. It also contains comparison on the case studies based on their method and result. So based on the information of the research paper, the methodology for this study can be developed.
3 Methodology
• This chapter is the methodology that is done based on the finding in the literature review. The methodology is for the procedure guideline that needs to be done during the PSM 2 later. It also contains the method how to design and simulate for the particular case in this study.
PSM 2 4
Results and discussion
• This chapter is the results and discussion obtained based on the finding in the simulation that were base on design of pipe. The results has been analysed in order to find inlet velocity and pressure loss that occur.
5
Conclusion
• We can conclude that the higher velocity inlet will causes the pressure loss to drop based on Bernoulli's Principle.
1.6 Conclusion
This chapter concludes the overview of this study by stating the objective, scope of the study, and methodology. The objective has addressed the direction of the study while from the scope of study and the critical parameter was specified. Lastly the arrangement of the study was briefly explained that also act as guideline for the study done.
Chapter 2
LITERATURE REVIEW
2.1 Introduction
This chapter will discuss and explains about the fundamentals, theories and concepts of this project. In this chapter also explains about the perspective, components and method that will be used in this project. The concept of the Effects of Inlet Velocity of Fluid Flow in T-Junction Pipe for combining flow will be discussed and explain in detail.
2.2 Previous Research of Fluid Flow in Pipe
Pinho (2006) studied the edge effects on the flow characteristics in a 90 degree Tee Junction. The objective of the study is to determine whether the angle of corners effect energy and turbulence dissipation. CAD-CAM system has been used along with the K-epsilon (k-ε) and standard Reynolds stress as a turbulence model. Rounding the edge of junction lead to higher turbulence in the branch pipe which resulted in a shorter, thinner and weaker recirculation bubble region, thus reduce the loss coefficient of branch flow which justify that rounded tee is obviously more efficient for all investigated Reynolds numbers.
Comsol Multiphysics software were adopted. Result shows that the differences between observations by 2D simulations of software and classical formula were considerably larger than the difference between observations by 3D simulation of software and classical formula. FLUENT software is the best software so far in creating simulation among others.
Li-yang et al. (2008) studied the oil/water two-phase flow inside T-junctions by simulating with a 3-D two-fluid model and to find the turbulence inside the model. Kappa-epsilon (k-ε) model was used to find turbulence in the pipe. The result shows that separating performance of T-junction was massively depends on the inlet volumetric fraction and flow patterns, thus k-ε turbulence model can be used to simulate the oil/water two-phase flow in T-junction.
Nematollahi and Khonsa (2012) studied the comparison of T-junction flow pattern of water and sodium for different geometries of power plant piping systems. CAST3M code developed by CEA and Kappa-epsilon (k-ε) model is used in this study. Both the water and sodium shows very good agreement with slightly changes in flow pattern.
Xin and Shaoping (2012) studied the flow field and pressure loss analysis of junction and it structure optimization of aircraft hydraulic pipe system. The flow fields of T-junction and Y-junction is investigated using shear stress transport (SST) model. ANSYS/CFX has been used for the simulation in this process. K-epsilon (k-ε) turbulence model and SST model have been used to describe CFD simulation which used to simulate mean flow characteristics for turbulent flow conditions. The results shows that, the variation rule of the velocity peak is obtained and the eddy current does exist in the corner of T-junction.
Abdulwahhab et al. (2013) investigated the pressure loss of fluid with turbulent incompressible flow through 90 degree tee junction numerically. Kappa-epsilon model with 2 different values of area ratio between the main and branch pipe were 1.0 and 4.0 of flow rate ratios. Reconsidered simple algorithm were used to find the relationship between the pressure and velocity fields inside the pipe. CFX 5 code ANSYS FLUENT 13 software has been used to simulate three dimensional steady state flow. Result shows the pressure loss coefficient by the
numerical results is higher than theoretical and experimental results. The higher the flow rate ratio the higher difference between them.
Chen et al. (2014) studied the thermal mixing characteristic in T-junction piping. Objective of this study is to investigate the effects of flow velocity ratio on thermal mixing phenomenon are the major parameters. Reverse flow which might produce cracks in pipe mostly happen in branch flow with higher velocity than the main flow.
Selvam et al. (2014) investigated on high cycle thermal fatigue failures in a nuclear power plant T-junction piping system. It may be caused by near-wall temperature fluctuations due to the thermal mixing of hot and cold fluid streams with temperatures different of 117 Kelvin and 123 Kelvin. Large Eddy Simulation (LES) method and also ANSYS CFX 14.0 software has been used. LES result obtained will be validated with the Fluid-Structure Interaction (FSI). Mixing of fluids occurs in the lower cross sectional region of the pipe with lower Reynolds number of 3670 in the cold fluid coming from the branch pipe along with buoyancy effects in the flow due to higher inflow temperature in the main pipe.
Štigler et al. (2014) studied the characteristics of the T-junction with the equal diameters of all branches for the variable angle of the adjacent branch. The author aim to bring out the T-junctions which consists straight and adjacent branch pipe which can be inclined under various angle by numerical calculation and experiment activity. Two types of method have been used such as experiments and comparison with numerical calculations. The mathematical model can be used for solution of fluid flow in pipe systems and also for comparison of the different shapes of the T-junctions.
Poole et al. (2014) investigated the effect of fluid viscoelasticity on the symmetry-breaking bifurcations in T-channel flows. In aspect-ratio-dependent Reynolds number, flow in three-dimensional T-channel junction which is two-opposing planar channel streams joining and turning through 90 degrees angle can break symmetry which bifurcation has been proposed as a method in enchant mixing in microfluidic channels. Instability according to Maxwell and
Oldroyd-B models occur at lower Reynolds numbers for viscoelastic fluids in comparison to the Newtonian base case while Deborah higher numbers lead direct to an unsteady flow.
Holmberg et al. (2014) studied the interaction between the hydrodynamic and the acoustics field in certain duct or pipe configurations such as T-junctions which known to origins of harsh acoustics resonance in pipe networks. Method were used is CFD prediction tools and also Large Eddy Simulation (LES). For Reynolds numbers increases grazing flow speed yields more severe interaction but based on the present data the trend is not a simple proportionally.
Lam et al. (2014) studied the aeroacoustics of a combining flow with all same width but
different merging angles. Direct aeroacoustics simulation (DAS) has been used as one of the method with conservation and solution element (CE/SE). Acoustic efficiency of the merging flows increases with merging scale as expected. The data obtained also show that acoustic efficiency in the upstream branches by follow the dipole scaling law.
Matos and Oliveira (2014) investigated the influence of constitutive model and fluid elasticity begin with the main characteristics of recirculating flow pattern at the junction and also shear stress fields. Objective of this study is to examine viscosity ratio in order to find Deborah number. Some method have been used such as FENE-CR OR FENE-MCR model which are based on the non-linear finite extensibility dumbbell model but with different derivation of model equations. Other than that, numerical method with geometry and computational mesh were practiced as methodology stated above. The higher the gradient of FENE-MCR model due to re-entrant corners where shear stress gain extreme values between both models.
Mohammad et al. (2015) investigated the scour, sedimentation and the flow pattern in T-shaped spurs dike field in a 90 degree channel bend using numerical model. Method used such as Governing equations, numerical model and Kappa-epsilon (k-ε) model. In the submerged mode, the maximum scour depth decreased to 22% compared to non-submerged mode.
Kharoua et al. (2015) investigated an important phenomenon when populations of particles are split within junctions of gas piping networks. Computational fluid dynamics (CFD),
Kappa-epsilon (k-ε) model are used with Discrete Phase Model (PDM). The combination of gravitation and presence of primary vortices, with each side of junction play a major influence solid-phase split.
Chen et al. (2015) investigated the micro-droplet breakup in micro-channel T-junction. 3D Volume of Fluid (VOF) method by visual experiment is conducted to validate the numerical simulation. Flow arrangement maps under different viscosity ratio between two phases with new correlation been proposed to predict the transformation between breakup and non-breakup of droplet. Methodology used is Volume of Fluid (VOF) which to reveal the breakup mechanism of micro-droplets in a micro-channel T-Junction. The droplet breakup and non-breakup dynamics of micro-droplets in a symmetric micro-channel T-junction was numerically investigated using VOF model depend mainly on the relative dominance of surface tension represented in the Ca number and relative droplet length.
Lin et.al. (2016) investigated on thermal mixing and flow in a T-junction with different
flow rate in main pipe or branch pipe which cold water in the branch and hot water in the main pipe. CFD simulation had been used in order to validate useful data in T-junction simulation. Besides that, the particle image velocimetry (PIV) is used in order to perform temperature distribution and velocity field in a T-junction. Based on these steady-state measured temperature distributions, the thermal mixing of a T-junction can be improved by increasing the flowrate in the branch, or decreasing the flowrate in the main pipe
Lin and Ferng (2016) studied on how to resemble the thermal mixing and reverse flow characteristics in a T-junction. These process is conducted in order to find different in steady-state of turbulence model. Method that included in this process is 3-D computational fluid dynamics (CFD) and also Kappa-epsilon (k-ε) model which is used to find turbulence. Variety in turbulence model is due to temperature changes and reverse flow from the branch injection back upstream in T-junction.
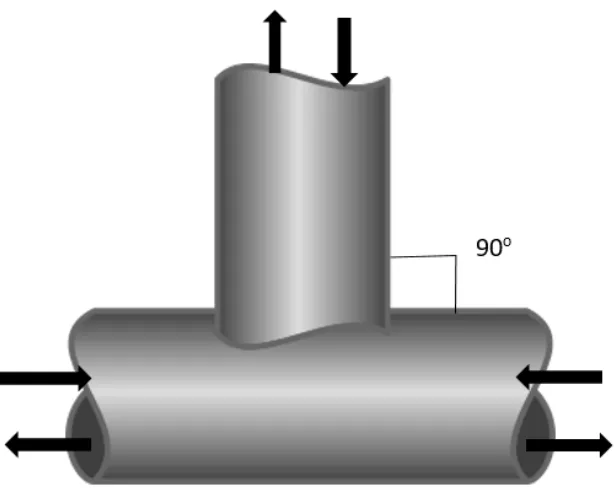
2.3 T-junction 90º Pipe
[image:24.612.175.482.358.604.2]T-junction pipe is a small, but very important part of the pipeline system and the angle of this pipeline is 90º. There are several shape of the pipe, and it is primarily used whether in dividing or combining of flow in pipeline system. T-junction is good in order for mixing two different types of liquids, gaseous, or water. Besides that, it can also act as a simple pump which is called ejector, but in this research will be list further detailed especially on how to minimize pressure loss and analyze the best diameter ratio. While the velocity during inlet and outlet of branch pipe will be investigated further in order to find most suitable T-junction. The results showed that 90º junction gave the highest efficiency. According to Xin & Shaoping, (2012) due to particular structure of the aircraft hydraulic pipelines, the traditional configuration of two flows converging is 90º.
Figure 2.1 Example of T-Junction with 900 angle