Locating adaptive diversity in the face of climate change
152
0
0
Full text
(2) Locating adaptive diversity in the face of climate change. Thesis submitted by Stewart Macdonald BSc (Hons) September 2015 Revised thesis submitted April 2016. For the degree of Doctor of Philosophy College of Marine and Environmental Sciences James Cook University Townsville, Queensland 4811 Australia.
(3) Front cover: Rainforest Sunskink (Lampropholis coggeri). These magnificent skinks are endemic to the rainforests of the Australian Wet Tropics, an area highly vulnerable to the effects of climate change. Photo by Stephen Michael Zozaya IV.. ii.
(4) Acknowledgements This project started out due to my love of adventure and my desire to explore the Kimberley before the arrival of the dreaded cane toad. Unfortunately, Ben ruined all that by moving to Townsville. However, this turned out to be a blessing in disguise, as I ended up working with one of the most charismatic and beautiful creatures in Australia: Stephen Zozaya Lampropholis coggeri.. My wonderful mother fully supported my plan to return to university. In fact, she seemed a little too supportive when I told her I was moving 1400km away from her.. This project involved a huge amount of fieldwork. Every dot on a map, every point on a graph, and every number in a table represents hundreds of hours of painstaking, and sometimes painful, work in the field and the lab. For their generous help, I extend my most heartfelt gratitude to: Solveig Apeland, Louise Barnett, Becca Brunner, Naomi Harney, Alana de Laive, Michael Lee, Vanessa Lucy, Demi McCullough, Matthew McIntosh, Marg Murray, Josh Nerboni, Jodie Nordine, Evan Pickett, April Reside, Nadiah Roslan, Chris Sanderson, Nantida Sutumnawong, Jessica Turner, Steve Wilson, Justin Wright, and Anders Zimny.. Three people in particular gave up enormous amounts of their own time, all because of their unbridled passion for Little Brown Skinks. I am indebted to Henry Cook, Jordan de Jong, and Stephen Michael Zozaya IV. This research would not have been possible without their skillful hands, because it turns out I'm rubbish at catching skinks. Extra thanks to Stephen for letting me use his photo on the front cover.. The other members of Team Cogg — John Llewelyn and Amberlee Hatcher — made sure that this project was not only possible, but thoroughly enjoyable.. Thanks also to the other members of James Cook University's Centre for Tropical Biodiversity and Climate Change and the ATSIP building. Louise Barnett, Megan Higgie, Rob Puschendorf, Juliana Rechetelo, April Reside, Nadiah Roslan, Jason Schaffer, Brett Scheffers, Joy Sutumnawong, Lin Schwarzkopf and her Lizard Lab, Stanley Tang, Justin Welbergen, and Yvette Williams: your conversation (and cake) was much appreciated. iii.
(5) Craig Moritz and the entire Moritz Lab at ANU took me under their collective wing and gave me a crash course in genetics. Special thanks to Sally Potter and her seemingly endless supply of patience, smiles, and brownies.. The good folks at CSIRO welcomed me into their fold and fed me on Tuesday mornings. In particular, it was a pleasure to work with Justin Perry, Eric Vanderduys, and Ian Watson.. I had a large and capable committee of co-supervisors. Conrad Hoskin, Jeremy VanDerWal, David Wescott, and Steve Williams did an admirable job of keeping me in line.. Finally, words cannot express the respect and admiration I have for Ben Phillips as my primary supervisor, my colleague, and my friend, so I'll instead turn to the traditional Japanese form of communication used by samurai and their sensei:. Also finally, I found great inspiration in the teachings of Drs GaGa and Cyrus, and I would encourage you, dear reader, to study their work. If I had to single out each one's greatest contribution to society, it would have to be GaGa's 2009 thesis on inappropriate affection and Cyrus's 2013 treatise on building demolition methodology.. Still finally, extra special thanks to Becca Brunner. You came late to the party, but you certainly livened it up.. Finally finally, the last four-and-a-bit years have shown me that every form of life, but particularly those littlest and brownest of skinks, can be amazingly tenacious, eking out an existence in the seemingly harshest of places. In the words of the great Dr. Ian Malcolm: "Do you think they'll have that on the tour?". Stewart Macdonald September 8, 2015 iv.
(6) Publications associated with this thesis Submitted Chapter 2 Macdonald, S.L., J. Llewelyn, C. Moritz, & B.L. Phillips (submitted) A framework for locating adaptive diversity in the face of climate change. Global Ecology and Biogeography. Chapter 3 Macdonald, S.L. & B.L. Phillips (submitted) Are less-connected rainforest patches more climatically extreme? Diversity & Distributions. In preparation Chapter 4 Macdonald, S.L., J. Llewelyn, & B.L. Phillips (in prep) Using connectivity to identify environmental drivers of local adaptation. PNAS. Chapter 5 Macdonald, S.L., J. Vanderwal, & B.L. Phillips (in prep) Identifying source and recipient populations for assisted gene flow: matching locally adapted populations across current and future climates. Nature Climate Change. Animal ethics statement This research presented and reported in this thesis was conducted in compliance with the National Health and Medical Research Council (NHMRC) Australian Code of Practice for the Care and Use of Animals for Scientific Purposes, 7th Edition, 2004 and the Qld Animal Care and Protection Act, 2001. The proposed research study received animal ethics approval from the JCU Animal Ethics Committee (approval numbers A1976 and A1726).. v.
(7) Statement of contribution of others Research funding and stipend I am indebted to the following organisations for funding both my work and me. Hopefully they feel like they got a good return on their investment. • • • • •. Australian Postgraduate Award Tropical Landscapes Joint Venture Wet Tropics Management Authority Skyrail Foundation James Cook University Centre for Tropical Biodiversity and Climate Change. Supervision • • • • •. Dr Ben Phillips, Centre for Tropical Biodiversity and Climate Change, JCU & University of Melbourne Dr Jeremy VanDerWal, Centre for Tropical Biodiversity and Climate Change, JCU Dr Conrad Hoskin, Centre for Tropical Biodiversity and Climate Change, JCU Professor Stephen Williams, Centre for Tropical Biodiversity and Climate Change, JCU Dr David Wescott, Ecosystem Sciences, CSIRO. Editorial assistance •. Clare Morrison provided proof-reading services. Dr Morrison is a conservation biologist whose primary research interest areas are terrestrial ecology and biodiversity conservation, with a particular focus on fauna in Australasia and Pacific Island countries.. Co-authorship of published manuscripts Co-authors of published manuscripts within this thesis participated in one or more of the following ways: discussions of concept and study design, advice on methods and editing of manuscripts, collation and/or generation of data. Details of contributions are included at the start of each chapter.. Every reasonable effort has been made to gain permission and acknowledge the owners of copyright material. I would be pleased to hear from any copyright owner who has been omitted or incorrectly acknowledged.. vi.
(8) Abstract Climate change will have profound and negative effects on the planet's biodiversity. Conservationists and land managers are turning to a variety of strategies with the hope of mitigating some of these effects. One such strategy is assisted gene flow (AGF): the translocation of individuals between populations with the aim of increasing genetic diversity and introducing specific 'preadapted' genes that will boost the climate change resilience of the recipient population. Assisted gene flow is already in use, and is likely to see increasing use in the coming decades, but the methods needed to deploy it effectively are still being developed. To mitigate climate change impacts, assisted gene flow will be most effective when the source populations are: 1) adapted to their local climate, and 2) close to the recipient population in future climate space.. This thesis details techniques that can be used to identify the environmental drivers of local adaptation (focusing specifically on climatic drivers), and weight them according to the degree to which they drive local adaptation. These weighted climatic axes can then be used to create a climate space that accounts for the degree to which each climatic axis is driving local adaptation; a space in which AGF source and recipient populations can be sensibly matched. These concepts and techniques are demonstrated in the following chapters using a case study of the Rainforest Sunskink (Lampropholis coggeri) from the rainforests of north-eastern Australia.. Chapter 1 reviews the threats caused by climate change and outlines some potential mitigation strategies, with particular emphasis on assisted gene flow and novel strategies to make AGF more effective. It then outlines the structure of the thesis and sets the scene for the development of these novel strategies.. vii.
(9) Chapter 2 outlines the ecological factors that should be considered when searching for potential source populations: population size, connectivity, and climate. Knowing that isolation (i.e., low connectivity) is conducive to local adaptation, a connectivity index is developed that is used in the analyses that appear in subsequent chapters.. Given that we are looking for local adaptation to extreme climates, and knowing that isolation is conducive to local adaptation, Chapter 3 then explores the relationship between climatic extremity and habitat connectivity, and finds that more isolated rainforest habitat does indeed experience more extreme climate, and that these shifts towards extremity are in the direction of climate change. As such, isolated habitats, free from gene swamping and subject to extreme climates, are likely to contain populations adapted to the sorts of climates we expect to be more widespread in the future. It is these populations that will make ideal source populations for assisted gene flow strategies.. Chapter 4 develops a method for determining which aspects of the environment most strongly drive local adaptation. It does this by recognizing that high connectivity leads to high levels of gene flow, which erodes local adaptation. This method is demonstrated by determining which aspects of climate are the strongest drivers of local adaptation in the case study system. The relationships between various climatic variables and physiological and morphological traits in the focal skink species are examined, and the degree to which gene flow erodes these relationships is assessed using the connectivity index developed in Chapter 2. In my study system, this highlighted two precipitation variables (annual mean precipitation and precipitation of. viii.
(10) the driest quarter) as those aspects of climate that appear to be the strongest drivers of local adaptation.. Chapter 5 combines the connectivity index from Chapter 2 and the climatic drivers of local adaptation from Chapter 4, and develops a technique to match potential source and recipient populations, weighting climatic axes to account for the degree to which they drive local adaptation. It uses a case study involving L. coggeri to demonstrate this technique, and then discusses the results of the case study and the generality of the technique.. Finally, Chapter 6 summarises the main findings and suggests some avenues for future research.. This thesis brings together considerations from both ecology and evolution to argue that isolated patches of habitat on the edge of a species' range are likely to contain populations that will be of great importance if we are to conserve species in the face of climate change. The same characteristics that make these isolated populations so valuable (small size and extreme climates), however, also put them at the highest risk of extinction from climate change. Given the rapid rate at which climate change is progressing, the identification and conservation of adaptive diversity present in isolates is of utmost importance.. ix.
(11) Table of contents. Acknowledgments ................................................................................................... iii Publications associated with this thesis ................................................................... v Statement of contribution of others ......................................................................... vi Abstract .................................................................................................................... vii Table of contents ..................................................................................................... x List of tables ............................................................................................................ xi List of figures........................................................................................................... xii 1 – Introduction ....................................................................................................... 1 2 – Locating adaptive diversity in the face of climate change ................................ 15 3 – Are less-connected rainforests patches more climatically extreme? ................. 49 4 – Using connectivity to identify environmental drivers of local adaptation ........ 73 5 – Identifying source and recipient populations for assisted gene flow................. 105 6 – General discussion ............................................................................................. 127. x.
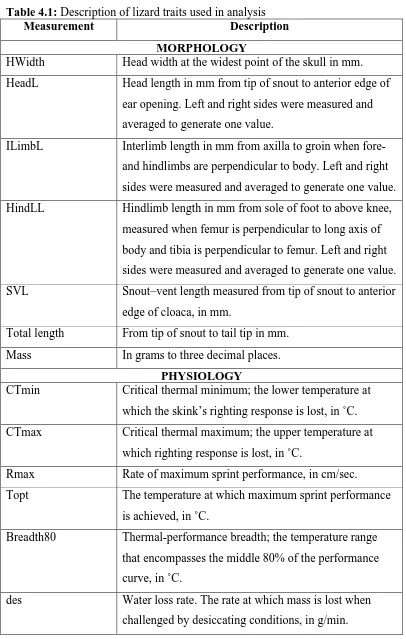
(12) List of tables. Chapter 3 – Climate and connectivity Table 3.1 – Climatic variables used in analysis....................................................... 56. Chapter 4 – Environmental drivers of local adaptation Table 4.1 – Morphological and physiological traits measured ................................ 84 Table 4.2 – Environmental variables ....................................................................... 86. Chapter 5 – Matching in climate space Table 5.1 – Environmental variables used in occupancy modeling ........................ 111 Table 5.2 – Model selection results ......................................................................... 112 Table 5.3 – Coefficients used to calculate local adaptation scores ......................... 123. xi.
(13) List of figures. Chapter 1 – Introduction 1.1 – Map ................................................................................................................. 5. Chapter 2 – Locating adaptive diversity 2.1 – Study region, connectivity, and migrant load ................................................. 21 2.2 – Climate in core vs peripheral habitat .............................................................. 23 2.3 – Climate vs habitat connectivity ...................................................................... 31 2.S1 – Migrant load at the pixel level ...................................................................... 42. Chapter 3 – Climate and connectivity 3.1 – Temperature variables vs connectivity ........................................................... 60 3.2 – Precipitation variables vs connectivity ........................................................... 61. Chapter 4 – Environmental drivers of local adaptation 4.1 – Conceptual scatterplots ................................................................................... 79 4.2 – Study region and sampling locations .............................................................. 82 4.3 – Pairwise correlations of environmental variables ........................................... 87 4.4 – Scatterplot of coefficients ............................................................................... 90 4.5 – Heatmap of coefficients and local adaptation scores...................................... 92. Chapter 5 – Matching in climate space 5.1 – Schematic representation of assisted gene flow strategy................................ 108 5.2 – Probability of occupancy map ........................................................................ 113 5.3 – Map of distance in 'adaptation space' ............................................................. 116. xii.
(14) Chapter 1 – Introduction. Chapter 1 Introduction Climate change as a threat to biodiversity Anthropogenic climate change is one of the biggest threats facing the world's biodiversity (Thomas et al. 2004). The coming century will see an increase in global mean temperatures, increases in the frequency and intensity of extreme events, and alterations to precipitation regimes (Meehl et al. 2000; Parmesan et al. 2000; IPCC 2014; Sherwood & Fu 2014). If we see a 4˚C increase in global mean temperature over the next century — a not unreasonable expectation (IPCC 2014) — the planet will be the warmest it has been in the last 40 million years, and this warming will take place up to 40 times faster than past episodes of climate change (Peters 1994). The magnitude and rate of this warming will have severe impacts on global biodiversity. Predicted or observed impacts on species include: shifts in geographical distributions, including complete turnover of some ecosystems (e.g., Parmesan & Yohe 2003; Hilbert et al. 2004; Williams et al. 2007; Freeman & Freeman 2014); population extinctions (Parmesan 2006); changes to the timing of migration (Chambers & Keatley 2010); changes to nesting regimes or habitats (Pike et al. 2006; Telemeco et al. 2009); and alterations, including extinctions, of entire montane communities (Pounds et al. 1999).. Broad strategies to account for climate change in conservation planning have been developed (Hannah et al. 2002; Heller & Zavaleta 2009), and conservation biologists are investigating a variety of specific implementations to mitigate impacts. Many techniques have been suggested or are already in use, such as habitat restoration and. 1.
(15) Chapter 1 – Introduction. modification (e.g., Naro-Maciel et al. 1999; Shoo et al. 2011a; Shoo et al. 2011b), and relocation of nests for species whose sex ratios may be skewed by increasing temperatures (e.g., Fuentes et al. 2012). Many strategies that have been used to test or mitigate other impacts may also be useful in the face of climate change, such as artificial manipulation of hydrological regimes in key habitat (e.g., Mitchell 2001; Channing et al. 2006).. One established technique is assisted colonisation (AC) — the conservation translocation and establishment of a new population outside of a species' current distribution (Peters 1994; IUCN 2013; Seddon et al. 2015). While most translocations have been in response to threats such as habitat destruction and introduced predators, the number of translocations performed in response to climate change is increasing (e.g., Marris 2009; Willis et al. 2009). Although many AC attempts have been successful, and have arguably saved a number of species from extinction (Seddon et al. 2015), the strategy is not without critics (Ricciardi & Simberloff 2009). One of the primary concerns with AC is that the translocated species will disrupt the ecosystem into which it is introduced. Given the dismal history of deliberate and accidental translocations across the planet (e.g., toads: Shine & Phillips 2014), this is a valid concern.. Another, less risky, technique that is expected to see increasing use is assisted gene flow (AGF). Instead of attempting to establish entirely new populations in climatically suitable areas, individuals are translocated from a carefully selected source population to an existing population to boost the health and resilience of the recipient population (Weeks et al. 2011; Aitken & Whitlock 2013; Frankham 2015;. 2.
(16) Chapter 1 – Introduction. Kelly & Phillips 2015). Perhaps the most famous example of AGF involves the successful reversal of inbreeding depression in the declining Florida Panther, Puma concolor coryi (Johnson et al. 2010). A recent Australian AGF example involves the genetic rescue of the Mountain Pygmy Possum, Burramys parvus (Weeks et al. 2015). This wild-to-wild translocation program was undertaken to increase the genetic diversity of a small, declining population that exhibited very low levels of genetic diversity. While these two examples were not done to mitigate against climate change, they highlight the effectiveness of the technique, and its acceptance by academic and governmental communities. In the face of climate change, the key to effective assisted gene flow efforts will be to find source populations currently experiencing climates that the recipient population will experience in the future. Importantly, however, we also require that these source populations be adapted to their current climate.. Optimal phenotypes vary through both time and space, leading to populations that have higher fitness in their home environment than an immigrant would (Reznick & Travis 1996; Kawecki & Ebert 2004). This is the basis of local adaptation, a widespread, but not ubiquitous, phenomenon (Kawecki & Ebert 2004; Hereford 2009). Local adaptation is eroded in the face of strong gene flow, so isolation can be an important pre-condition for local adaptation (Haldane 1956; Kirkpatrick & Barton 1997). Isolation by itself, however, does not lead to local adaptation. The driving force behind local adaptation is selection from the environment, and selection pressures can change over relatively short timeframes and spatial scales (Reznick & Travis 1996; Losos et al. 1997; Kawecki & Ebert 2004; Richardson et al. 2014). Past episodes of climate change have required species to shift their range or adjust in situ.. 3.
(17) Chapter 1 – Introduction. Two aspects of current climate change make these past responses inadequate: 1) severely fragmented landscapes reduce connectivity and therefore reduce the ability of a species to disperse to new areas while tracking optimal climatic conditions; and 2) the magnitude and rapid rate at which climate change is proceeding far exceeds anything species have had to contend with historically. Species and populations are vulnerable if the climate they experience changes too much or too quickly.. Across a heterogeneous landscape, different populations of the same species will experience, and therefore will likely be adapted to, different climates. Assisted gene flow exploits this variability by predicting the future climate of recipient populations and looking for source populations whose current climate matches this future. Climate, however, is multidimensional, and different aspects of climate may drive local adaptation to varying degrees. If, for example, temperature has a bigger influence on fitness than does precipitation, it is more important to match along the temperature axis than the precipitation axis. This is because, in this example, one unit of change away from the species' optimal temperature represents a larger fitness reduction than the same unit of change on the precipitation axis. When matching source and recipient populations in a multidimensional climate space, we should aim to weight the various axes according to how strongly they drive local adaptation. This, in effect, stretches the axes that are more important and compresses those climatic axes that appear to be exerting weaker selective forces. By weighting the various climate axes, we can make better matches between source and recipient populations when planning AGF implementations.. 4.
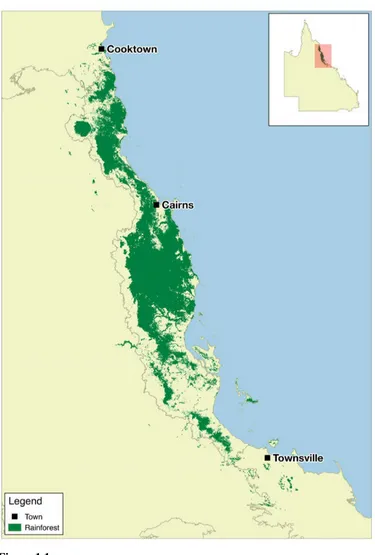
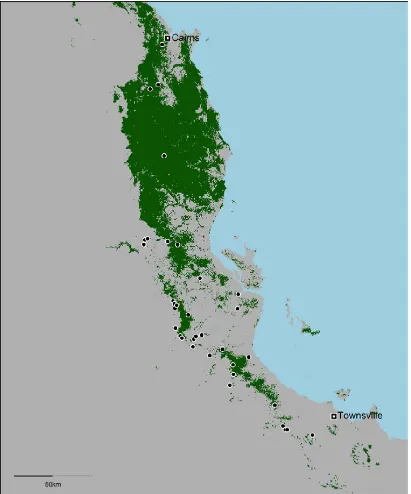
(18) Chapter 1 – Introduction. Study region The rainforests of the Australian Wet Tropics (AWT) make an ideal system in which to demonstrate these concepts and techniques. This bioregion is a mosaic of naturally occurring rainforest fragments surrounded by a matrix of drier forest (Fig. 1.1).. Figure 1.1 Pre-clearing (pre-1750) distribution of rainforest in the Australian Wet Tropics.. 5.
(19) Chapter 1 – Introduction. These rainforests are home to an extraordinary diversity of species, many of which have been highlighted as being particularly vulnerable to climate change (Williams et al. 2003). The region's vegetation has been extensively mapped (Accad & Neil 2006; DERM 2011), and this mapping was used to identify the rainforest patches that were used in my study. The AWT is mapped as having contained 7,095 discrete rainforest patches prior to European settlement (Fig. 1.1). I used the pre-clearing (pre-1750) vegetation layer, as I was interested in the isolation over thousands of years rather than more recent anthropogenic clearing-driven isolation. While patches have generally decreased in extent since European settlement because of land clearing, many patches have expanded their borders due to the decreased incidence of fire (decreased fire favours rainforest over wet sclerophyll forest, even though both habitat types share very similar climatic needs). This region spans significant elevation (0–1600 m ASL), precipitation (annual mean precipitation of 1432–8934 mm, excluding input from cloud stripping), and temperature (annual mean temperature of 16.3–25.8˚C) gradients.. The AWT rainforest contains a myriad of species distributed as numerous isolated populations that are all experiencing unique climates and are therefore potentially adapted to those climates. I focused on one species in particular, the Rainforest Sunskink (Lampropholis coggeri). This species was chosen because it is rainforestspecific, abundant, highly detectable, and because there is detailed phylogeographic information available for it (Bell et al. 2010). I collected survey data for approximately 100 rainforest patches to determine the presence or absence of this species. When present, I collected up to 20 individuals for detailed morphological and physiological analyses. I also collated temperature, precipitation, and vegetation data. 6.
(20) Chapter 1 – Introduction. layers for the entire region to characterize the climate of each rainforest patch. This dataset allowed me to assess the relationships between the environment (focusing on current and future climates); the presence, morphology, and physiology of my focal skink species; and habitat connectivity. Using these data, I addressed the fundamental aims of this study.. Aims of this study The aim of this study was to develop techniques for identifying source and recipient populations for AGF to mitigate climate change impacts. Building on evolutionary and ecological theories, this thesis makes the case that, in many systems, peripheral isolates (small, isolated patches of habitat on the periphery of a species' range) will contain populations that are ideal for use as source populations in AGF strategies. I start by detailing the broad reasoning behind this focus on peripheral isolates, then present supporting evidence, and conclude by developing and demonstrating techniques for use in AGF strategies. I answer the following four specific research questions:. 1 - Why is isolation important and how do we define connectivity? Chapter 2 introduces the ecological and evolutionary reasons why peripheral isolates are likely to house important adaptive diversity. One of the most important reasons is that isolation leads to divergence (which may or may not be adaptive). Because isolation is a central theme of this thesis, it is important that I have a robust measure of connectivity. Chapter 2 develops a connectivity index that is then used in all subsequent analyses.. 7.
(21) Chapter 1 – Introduction. 2 - Do isolated areas experience more extreme climates? Chapter 3 tests one of the major assumptions of Chapter 2; that peripheral populations experience more extreme climates. By using the connectivity index developed in Chapter 2, along with broadscale but high-resolution climate layers, I show that areas of low connectivity experience higher than average temperature extremes, and lower and more seasonal precipitation regimes. These are the types of extreme climates that are predicted to be more common in the future, and so populations currently surviving under these extreme conditions can provide important information on the capacity for a species to adapt to climate change. More practically, these extreme populations may provide the source genetic material needed for AGF strategies hoping to boost climate change resilience in the species' wider range.. 3 - How do we detect the environmental drivers of local adaptation? Chapter 4 develops a technique for identifying local adaptation, and most importantly, the environmental drivers behind that adaptation. This novel technique relies on the way in which increasing gene flow erodes local adaptation. By looking for correlations between the environment (e.g., climate) and species traits (e.g., morphological or physiological traits), and then assessing the way in which connectivity (as a proxy for gene flow) alters those correlations, we can separate environment–trait relationships that are due to local adaptation from those that arise through other processes (such as phenotypic plasticity). This technique can also be used to provide a relative measure of the strength of local adaptation, and so identifies the aspects of the environment that appear to be the strongest drivers of adaptation. In my study system, two aspects of precipitation (annual mean precipitation and. 8.
(22) Chapter 1 – Introduction. precipitation of the driest quarter) appear to be the main drivers of local adaptation in the climate-relevant physiological traits I examined.. 4 - Where will we find adaptive diversity in the landscape? Chapter 5 builds on the idea that isolation and climatic extremity lead to the development of local adaptation that will be valuable in the face of climate change, and identifies source patches that are isolated and climatically extreme, but still likely to be occupied by the focal skink species. It then takes the drivers of local adaptation from Chapter 3 and uses them to weight the axes of a climate space in which recipient populations can be matched to their ideal source populations. This enables me to identify a source patch that is likely to contain a population that is adapted to extreme climates, and then highlight the areas in the landscape that will match that climate in the future. It is to these areas that AGF efforts should translocate individuals from the source patch. This process can be repeated for numerous source patches, or reversed so that recipient populations are identified first and then matched with the best source patches.. Conservation in the face of climate change This thesis unites ecological and evolutionary theories to argue that isolated patches of habitat on the edge of a species' range are likely to contain populations that represent the absolute limits of what a species can achieve. These populations will be of great importance if we are to conserve species in the face of climate change. The same characteristics that make these isolated populations so valuable as sources for AGF (i.e., their small size, isolation, and the climatic extremity they experience), however, also put them at the greatest risk of extinction from climate change. The fact. 9.
(23) Chapter 1 – Introduction. that they are already on the precipice of climate space means that it may only take a small change to tip them over the edge. Given the rapid rate at which climate change is advancing, identifying and capturing the adaptive diversity present in isolates should be considered a high priority.. Thesis structure This thesis is made up of this introduction, four data chapters, and a general discussion. Each data chapter has been written as a standalone entity to facilitate publication in a peer-reviewed journal. Each chapter also builds on ideas and data presented in the preceding chapters. While I have attempted to minimize repetition throughout the thesis, the standalone nature of the chapters necessitates some content overlap. The general theme of climate change and AGF is repeated throughout the thesis. It is detailed in Chapter 2, and then touched on as necessary in subsequent chapters, expanding on the particular concepts that are the focus of each chapter. Chapter 2 was written with a particular focus on peripheral isolates — geographically, and often ecologically, marginal populations. This is a convenient categorization, and one that is used in much of the literature. Subsequent chapters discard this dichotomy, however, and instead focus on connectivity being a continuum, represented here by the connectivity index developed in Chapter 2. Thus, while the terms 'core' and 'peripheral' are not used extensively in the later chapters, the reader is reminded that these terms are still applicable and merely represent the two extremes of the connectivity continuum.. 10.
(24) Chapter 1 – Introduction. References 1.. Accad, A. & Neil, D.T. (2006). Modelling pre-clearing vegetation distribution using GIS-integrated statistical, ecological and data models: A case study from the wet tropics of Northeastern Australia. Ecological Modelling, 198, 85–100.. 2.. Aitken, S.N. & Whitlock, M.C. (2013). Assisted gene flow to facilitate local adaptation to climate change. Annual Review of Ecology, Evolution, and Systematics, 44, 367–388.. 3.. Bell, R.C., Parra, J.L., Tonione, M., Hoskin, C.J., Mackenzie, J.B., Williams, S.E. et al. (2010). Patterns of persistence and isolation indicate resilience to climate change in montane rainforest lizards. Molecular Ecology, 19, 2531– 2544.. 4.. Chambers, L.E. & Keatley, M.R. (2010). Australian bird phenology: a search for climate signals. Austral Ecology, 35, 969–979.. 5.. Channing, A., Finlow-Bates, K.S., Haarklau, S.E. & Hawkes, P.G. (2006). The biology and recent history of the Critically Endangered Kihansi Spray Toad Nectophrynoides asperginis in Tanzania. Journal of East African Natural History, 95, 117–138.. 6.. DERM (2011). Queensland Department of Environment and Resource Management, regional ecosystem mapping version 7.0. Available at: http://www.ehp.qld.gov.au/ecosystems/biodiversity/regionalecosystems/maps/.. 7.. Frankham, R. (2015). Genetic rescue of small inbred populations: metaanalysis reveals large and consistent benefits of gene flow. Molecular Ecology, 24, 2610-2618.. 8.. Freeman, B.G. & Freeman, A.M.C. (2014). Rapid upslope shifts in New Guinean birds illustrate strong distributional responses of tropical montane species to global warming. Proceedings of the National Academy of Sciences of the United States of America, 111, 4490–4494.. 9.. Fuentes, M.M.P.B., Fish, M.R. & Maynard, J.A. (2012). Management strategies to mitigate the impacts of climate change on sea turtle's terrestrial reproductive phase. Mitigation and Adaptation Strategies for Global Change, 17, 51–63.. 10.. Haldane, J. (1956). The relation between density regulation and natural selection. Proceedings of the Royal Society Biological Sciences Series B, 145, 306–308.. 11.. Hannah, L., Midgley, G.F., Lovejoy, T., Bond, W.J., Bush, M., Lovett, J.C. et al. (2002). Conservation of biodiversity in a changing climate. Conservation Biology, 16, 264–268.. 11.
(25) Chapter 1 – Introduction. 12.. Heller, N.E. & Zavaleta, E.S. (2009). Biodiversity management in the face of climate change: a review of 22 years of recommendations. Biological Conservation, 142, 14–32.. 13.. Hereford, J. (2009). A Quantitative Survey of Local Adaptation and Fitness Trade-Offs. American Naturalist, 173, 579–588.. 14.. Hilbert, D.W., Bradford, M., Parker, T. & Westcott, D.A. (2004). Golden bowerbird (Prionodura newtonia) habitat in past, present and future climates: predicted extinction of a vertebrate in tropical highlands due to global warming. Biological Conservation, 116, 367–377.. 15.. IPCC (2014). Climate Change 2014: Synthesis Report. Contribution of Working Groups I, II and III to the Fifth Assessment Report of the Intergovernmental Panel on Climate Change. IPCC, Geneva, Switzerland.. 16.. IUCN (2013). Guidelines for reintroductions and other conservation translocations. Gland, Switzerland: IUCN Species Survival Commission. https://portals.iucn.org/library/sites/library/files/documents/2013-009.pdf.. 17.. Johnson, W.E., Onorato, D.P., Roelke, M.E., Land, E.D., Cunningham, M., Belden, R.C. et al. (2010). Genetic Restoration of the Florida Panther. Science, 329, 1641-1645.. 18.. Kawecki, T.J. & Ebert, D. (2004). Conceptual issues in local adaptation. Ecology Letters, 7, 1225–1241.. 19.. Kelly, E. & Phillips, B.L. (2015). Targeted gene flow for conservation. Conservation Biology, 30, 259-267.. 20.. Kirkpatrick, M. & Barton, N.H. (1997). Evolution of a species' range. The American Naturalist, 150, 1–23.. 21.. Losos, J.B., Warheit, K.I. & Schoener, T.W. (1997). Adaptive differentiation following experimental island colonization in Anolis lizards. Nature, 387, 70– 73.. 22.. Marris, E. (2009). Forestry: Planting the forest of the future. Nature, 459, 906–908.. 23.. Meehl, G.A., Karl, T., Easterling, D.R., Changnon, S., Pielke, R., Changnon, D. et al. (2000). An introduction to trends in extreme weather and climate events: Observations, socioeconomic impacts, terrestrial ecological impacts, and model projections. Bulletin of the American Meteorological Society, 81, 413–416.. 24.. Mitchell, N.J. (2001). Males call more from wetter nests: effects of substrate water potential on reproductive behaviours of terrestrial toadlets. Proceedings of the Royal Society B-Biological Sciences, 268, 87–93.. 12.
(26) Chapter 1 – Introduction. 25.. Naro-Maciel, E., Mrosovsky, N. & Marcovaldi, M.A. (1999). Thermal profiles of sea turtle hatcheries and nesting areas at Praia do Forte, Brazil. Chelonian Conservation and Biology, 3, 407–413.. 26.. Parmesan, C. (2006). Ecological and evolutionary responses to recent climate change. Annual Review of Ecology, Evolution, and Systematics, 37, 637–669.. 27.. Parmesan, C., Root, T.L. & Willig, M.R. (2000). Impacts of extreme weather and climate on terrestrial biota. Bulletin of the American Meteorological Society, 81, 443–450.. 28.. Parmesan, C. & Yohe, G. (2003). A globally coherent fingerprint of climate change impacts across natural systems. Nature, 421, 37–42.. 29.. Peters, R.L. (1994). Conserving biological diversity in the face of climate change. In: Biodiversity and landscapes. Cambridge University Press, New York (eds. Kim, KC & Weaver, RD). Cambridge University Press Cambridge, United Kingdon, pp. 105–132.. 30.. Pike, D.A., Antworth, R.L. & Stiner, J.C. (2006). Earlier nesting contributes to shorter nesting seasons for the Loggerhead Seaturtle, Caretta caretta. Journal of Herpetology, 40, 91–94.. 31.. Pounds, J.A., Fogden, M.P.L. & Campbell, J.H. (1999). Biological response to climate change on a tropical mountain. Nature, 398, 611–615.. 32.. Reznick, D.N. & Travis, J. (1996). The empirical study of adaptation in natural populations. In: Adaptation. Academic Press San Diego, CA, pp. 243– 289.. 33.. Ricciardi, A. & Simberloff, D. (2009). Assisted colonization is not a viable conservation strategy. Trends in Ecology & Evolution, 24, 248–253.. 34.. Richardson, J.L., Urban, M.C., Bolnick, D.I. & Skelly, D.K. (2014). Microgeographic adaptation and the spatial scale of evolution. Trends in Ecology & Evolution, 29, 165–176.. 35.. Seddon, P., Moro, D., Mitchell, N., Chauvenet, A.L. & Mawson, P.R. (2015). Proactive conservation or planned invasion? Past, current and future use of assisted colonisation. In: Advances in Reintroduction Biology of Australian and New Zealand Fauna (eds. Armstrong, D, Hayward, M, Moro, D & Seddon, P). CSIRO Publishing Canberra.. 36.. Sherwood, S. & Fu, Q. (2014). A Drier Future? Science, 343, 737–739.. 37.. Shine, R. & Phillips, B.L. (2014). Unwelcome and unpredictable: the sorry saga of cane toads in Australia. In: Austral Ark (eds. Stow, A, Maclean, N & Holwell, GI). Cambridge University Press Cambridge, United Kingdon, pp. 83–104.. 13.
(27) Chapter 1 – Introduction. 38.. Shoo, L.P., Olson, D.H., McMenamin, S.K., Murray, K.A., Van Sluys, M., Donnelly, M.A. et al. (2011a). Engineering a future for amphibians under climate change. Journal of Applied Ecology, 48, 487–492.. 39.. Shoo, L.P., Storlie, C., Vanderwal, J., Little, J. & Williams, S.E. (2011b). Targeted protection and restoration to conserve tropical biodiversity in a warming world. Global Change Biology, 17, 186–193.. 40.. Telemeco, R.S., Elphick, M.J. & Shine, R. (2009). Nesting lizards (Bassiana duperreyi) compensate partly, but not completely, for climate change. Ecology, 90, 17–22.. 41.. Thomas, C.D., Cameron, A., Green, R.E., Bakkenes, M., Beaumont, L.J., Collingham, Y.C. et al. (2004). Extinction risk from climate change. Nature, 427, 145–148.. 42.. Weeks, A., Moro, D., Thavornkanlapachai, R., Taylor, H., White, N., Weiser, E. et al. (2015). Conserving and enhancing genetic diversity in translocation programmes. In: Advances in Reintroduction Biology of Australian and New Zealand Fauna (eds. Armstrong, D, Hayward, M, Moro, D & Seddon, P). CSIRO Publishing Canbera.. 43.. Weeks, A.R., Sgrò, C.M., Young, A.G., Frankham, R., Mitchell, N.J., Miller, K.A. et al. (2011). Assessing the benefits and risks of translocations in changing environments: a genetic perspective. Evolutionary Applications, 4, 709–725.. 44.. Williams, J.W., Jackson, S.T. & Kutzbacht, J.E. (2007). Projected distributions of novel and disappearing climates by 2100 AD. Proceedings of the National Academy of Sciences of the United States of America, 104, 5738– 5742.. 45.. Williams, S.E., Bolitho, E.E. & Fox, S. (2003). Climate change in Australian tropical rainforests: an impending environmental catastrophe. Proceedings of the Royal Society of London. Series B: Biological Sciences, 270, 1887–1892.. 46.. Willis, S.G., Hill, J.K., Thomas, C.D., Roy, D.B., Fox, R., Blakeley, D.S. et al. (2009). Assisted colonization in a changing climate: a test-study using two UK butterflies. Conservation Letters, 2, 46–52.. 14.
(28) Chapter 2 – Locating adaptive diversity. CHAPTER 2 A FRAMEWORK FOR LOCATING ADAPTIVE DIVERSITY IN THE FACE OF CLIMATE CHANGE Stewart L. Macdonald*1,2, John Llewelyn1,2, Craig Moritz3 and Ben L. Phillips4, 1 1. 2. 3. 4.. Centre for Tropical Biodiversity and Climate Change, James Cook University, Townsville, Qld, 4811, Australia. stewart.macdonald@my.jcu.edu.au, john.llewelyn@jcu.edu.au CSIRO Land and Water Flagship, Townsville, Qld, Australia Centre for Biodiversity Analysis, Australian National University, Canberra, ACT, Australia. gekkojessie@gmail.com School of Biosciences, University of Melbourne, Vic, Australia. phillipsb@unimelb.edu.au. * Author and address for correspondence. Manuscript submitted to Global Ecology and Biogeography. Statement of authorship: SLM collated data sources; SLM and BLP conceived and performed analyses; SLM wrote manuscript; BLP edited manuscript; all authors contributed substantially to ideas and revisions. 15.
(29) Chapter 2 – Locating adaptive diversity. Abstract As climate change progresses, there is increasing focus on the possibility of using assisted gene flow (the movement of pre-adapted individuals into declining populations) as a management tool. Assisted gene flow is a relatively cheap, low-risk management option and will almost certainly come into increased use over the coming decades. Before such action can be taken, however, we need to know where to find pre-adapted individuals. We present a framework for locating adaptive diversity in a landscape, and argue that, for many species, the obvious place to look for this diversity is in peripheral isolates: isolated populations at the current edges of a species’ range. Both evolutionary and ecological considerations suggest that the bulk of a species’ adaptive variation may be contained in the total set of these peripheral isolates. Moreover, by exploring both evolutionary and ecological perspectives it becomes clear that we should be able to assess the potential value of each isolate using remotely sensed data and three easily estimated axes of variation: population size, connectivity, and climatic environment. Using these axes as a springboard, and Australia’s Wet Tropics rainforests as a model system, we have developed a simple framework to guide future research aimed at locating valuable climate-related adaptive variation.. 16.
(30) Chapter 2 – Locating adaptive diversity. INTRODUCTION. The reality of anthropogenic climate change is no longer in doubt. Climatic changes have already occurred (Jones et al. 1999; Meehl et al. 2007), and in biological systems there is mounting evidence that these relatively minor changes have already resulted in altered phenology, range shifts, and population declines (e.g., Parmesan 2006; Freeman & Freeman 2014). Much greater climate change lies in our immediate future (Meehl et al. 2007), and the impacts of this impending change are likely to be manifold and complex (e.g., Atkins & Travis 2010; Norberg et al. 2012). Despite inherent uncertainties in how, exactly, climate change will play out, and how this will impact biodiversity (Moritz & Agudo 2013), there are certainly grounds for deep concern regarding the future of many species (Thomas et al. 2004).. In the last decade or so, ecologists have moved from mounting arguments as to why climate change should be minimised/avoided (e.g., Flannery 2006), to accepting the inevitability of a substantial change in climate, and pondering how the biodiversity impacts of that change might be mitigated. There now exist, for example, frameworks for assessing species’ vulnerability to climate change (e.g., Williams et al. 2008), and various decision tools for determining appropriate management options (e.g., Shoo et al. 2011; Miller et al. 2012). For species that are clearly at high risk of extinction (e.g., many range-restricted species, especially mountain-top endemics; La Sorte & Jetz 2010) it has been argued, albeit controversially, that extinction might be averted by assisted colonisation; the movement of populations to areas outside the species’ normal range (McLachlan et al. 2007; Hoegh-Guldberg et al. 2008). Although there may be a good case for assisted colonisation in some circumstances, it is not without risks (Ricciardi & Simberloff 2009). Assisted colonisation also requires the identification of suitable habitat for the focal species – potentially difficult for rare and range-restricted taxa (i.e. the species at highest risk of extinction; McLachlan et al. 2007). 17.
(31) Chapter 2 – Locating adaptive diversity. Another strategy for minimising biodiversity loss, a strategy known as genetic translocation or assisted gene flow (AGF), is to move individuals within their existing range to bolster general within-population genetic variation or introduce specific adaptive traits in the recipient population (Hoffmann & Sgrò 2011; Weeks et al. 2011; Aitken & Whitlock 2013). If we think of climate change as a velocity — the rate and direction that local climate moves across the earth’s surface (Loarie et al. 2009; Sandel et al. 2011; VanDerWal et al. 2013) — then locally adapted genes need to keep pace with this velocity. It is clear that such local adaptation is already occurring (e.g., Umina et al. 2005; Lavergne et al. 2010), but for taxa that have long generation times, low reproductive rates, and/or low levels of gene flow, it might not be happening fast enough (Quintero & Wiens 2013). Although complex to implement, AGF carries far fewer ecological risks than assisted colonisation because species are not being introduced to new areas and ecological communities; however, the genetic risks (e.g., outbreeding depression) of AGF still need to be considered.. The next several decades will likely see an increasing use of both assisted colonisation and AGF. Indeed, community groups and government agencies are already performing both actions (e.g., Marris 2009; Weeks et al. 2015), so the challenge might not be having these actions performed, but having them performed in a planned, strategic manner (e.g., Hoegh-Guldberg et al. 2008; Willis et al. 2009). Whether the intent is AGF or assisted colonisation, it is clear that the presence of appropriate adaptive variation in the source population is important. Assisted colonisation efforts risk failure if the introduced individuals are maladapted to the release locality; AGF requires the identification of adaptive variation suited to the future climate of the intended release localities. Locating adaptive variation is particularly important for AGF because this conservation strategy is based on the redistribution of adaptive variation and the subsequent evolutionary response. Here we draw on both ecological and evolutionary theory to develop a framework that identifies hotspots of climate-relevant adaptive diversity across a landscape. While the framework can be used without 18.
(32) Chapter 2 – Locating adaptive diversity. any prior assumptions regarding the location of these hotspots, we argue here that in many systems the obvious place to look for adaptive variation is in peripheral isolates: genetically isolated (through natural means, as opposed to recent anthropogenic habitat fragmentation), yet persistent, populations on the margin of the species’ existing range. In our discussion we follow Lesica and Allendorf (1995) in that these peripheral populations are always geographically marginal, and may also be ecologically marginal.. The ranges of many species are made up of large, central populations surrounded by many, smaller peripheral populations. These small, isolated populations have long been recognised as an important source of adaptive diversity (e.g., Bush 1975). Indeed, it has been twenty years since Lesica and Allendorf (1995) first highlighted the conservation value of the adaptive diversity held in such populations. Although the value of marginal populations under climate change is recognised (e.g., Hampe & Petit 2005), there has been little work done to develop a framework for assessing the value of peripheral isolates. In addition, our goalposts have shifted: from looking at peripheral isolates as places where evolutionary novelty might occur, to looking at them as potential sources for AGF or assisted colonisation. Both ecological and evolutionary theory show remarkable agreement regarding the habitat and population characteristics that determine a population's likely degree of adaptive divergence for climate-relevant traits. Both perspectives identify population size, connectivity, and climatic environment as key factors. Evolutionary considerations also point to the importance of long-term persistence in isolation. Although ecological and evolutionary perspectives agree on these fundamental axes of importance, there is less agreement about optimal positioning along each axis, and new empirical data will be critical in addressing this uncertainty.. To demonstrate our framework, we use the rainforests of Australia’s Wet Tropics as a model system. The Australian Wet Tropics bioregion is in the north-east of the continent (Fig. 2.1 inset), and consists of a complex network of rainforest patches (naturally occurring fragments of rainforest 19.
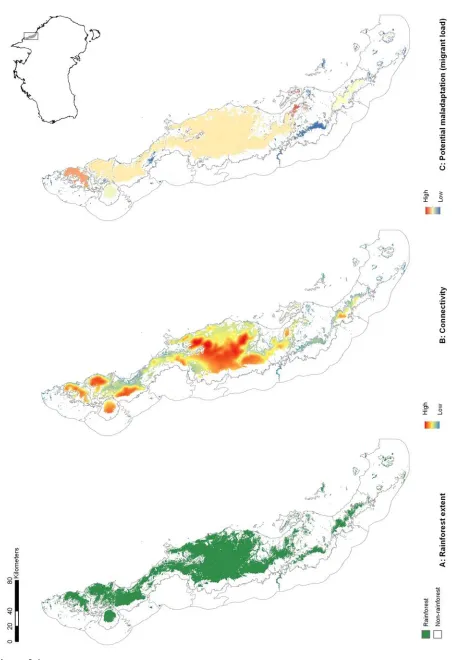
(33) Chapter 2 – Locating adaptive diversity. habitat shaped by past climate change, and continuing to be shaped by anthropogenic disturbance) in a matrix of monsoonal woodlands. The highly endemic rainforest biota has been highlighted as being sensitive to both past (Graham et al. 2006) and future (Williams et al. 2003) climate change. For rainforest-restricted species, rainforest patches represent potential habitat that can be scored according to their size, connectivity, and climate.. Following page: Figure 2.1 The Australian Wet Tropics (AWT) Bioregion is located in the north-east of the continent (inset). Here we show A) the distribution of naturally occurring rainforest patches within the AWT prior to European settlement; B) connectivity of extant rainforest (See Supp. Info. for methods), and; C) potential maladaptation (relative migrant load) at the patch level as a function of connectivity and spatial heterogeneity in annual mean temperature (see Supp. Info. for methods). Note that the connectivity in B remains high right up to the western edge of several patches. This is probably because the areas to the west are climatically suitable for rainforest, but rainforest is unable to grow there due to incompatible fire regimes. See text for further details. 20.
(34) Chapter 2 – Locating adaptive diversity. Figure 2.1. 21.
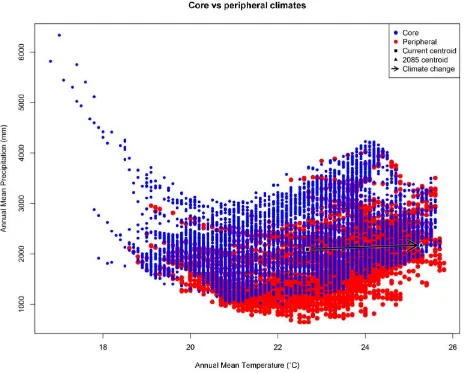
(35) Chapter 2 – Locating adaptive diversity. THE EVOLUTIONARY ECOLOGY OF ISOLATION. The geometry of isolation. Our argument for the likely importance of peripheral isolation flows from the geometric and definitional fact that peripheral isolates occupy habitat patches at the periphery of the species’ range. As such they are likely a) numerous, and b) spread across a broad range of climatic conditions. In Australia’s Wet Tropics rainforests, for example, we see a central spine of core habitat, surrounded by numerous (> 7000) naturally isolated patches of rainforest (the pre-clearing distribution of rainforest: Fig. 2.1A). Here we have defined 'core' patches as the largest patch of rainforest in each of 21 major faunal subregions within the Wet Tropics bioregion (Williams & Pearson 1997), with all other patches being classed as 'peripheral'. Note that some large, contiguous blocks of rainforest pass through several faunal subregions, so there are fewer core patches than subregions. Although the peripheral patches represent approximately 10% of the area of rainforest habitat in the region, they encompass almost all of the regional climatic variation (Fig. 2.2). The only climate spaces not sampled in peripheral patches are the most extreme wet and cool areas, found at the top of the mountain ranges around which the core areas are located. Conversely, the peripheral patches contain climate spaces (particularly the warmer, drier climates) that are not represented in the core patches (Fig. 2.2). While it is convenient to think of habitat patches as being either core or peripheral, connectivity is in reality a continuous variable, with patch connectivity ranging from low (peripheral) to high (core). Patches located in the geographic 'core' of a species' range may in fact have low connectivity if the landscape is heavily fragmented. For convenience, we continue to refer to our patches as either core or peripheral; however, all our analyses have been performed with a continuous connectivity index. Given that these peripheral patches sample most of the climate space of the region, especially at the warmer/drier end of the spectrum, the next question is whether populations inside these patches (our “peripheral isolates”) show adaptations 22.
(36) Chapter 2 – Locating adaptive diversity. matching their particular part of climate space; is this sampling of climate space matched by sampling in trait space?. Figure 2.2 Scatterplot showing spatial variation in two important axes of climate (annual mean temperature and annual mean precipitation) in Australia’s Wet Tropics (AWT). Variation is shown for random points in each of 7095 peripheral AWT rainforest patches (red); and, 7095 random points in core AWT rainforest patches (blue). In the AWT, the only climate space not represented by peripheral patches is in the extreme wet-andcool corner surrounding core patches (i.e. mountain tops in the AWT). Conversely, peripheral patches contain some climate spaces (particularly the warmer, drier climates) that are not represented in core patches. Current climate data represent the AMT and AMP BioClim layers for the 30-year period centred on 1990. The 2085 centroid has been calculated using the 2085 climate predictions for the same BioClim layers under the RCP8.5 CSIRO Mk 3.0 model.. 23.
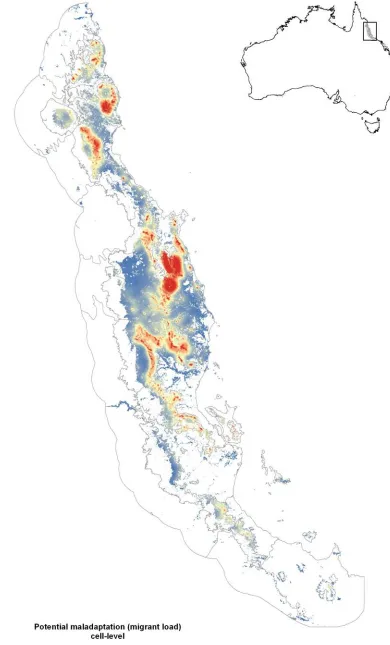
(37) Chapter 2 – Locating adaptive diversity. Consideration of evolutionary theory would suggest that, by dint of their isolation, populations in peripheral isolates should adapt more closely to their environment than core populations. The degree to which a population can adapt to its environment depends not only upon the rate of environmental change, but also on how much maladaptive gene flow a population receives (Polechová et al. 2009). This “migrant load”, M, scales directly with the interaction of the number of migrants, m, and the environmental variation, b (Kirkpatrick & Barton 1997; Polechová et al. 2009). Populations receiving many immigrants from climatically divergent areas are less likely to be closely adapted to local conditions than are populations that do not receive these migrants, or that only receive migrants from climatically similar environments.. We can map a very rough estimate of potential relative migrant load in our system by multiplying a measure of habitat connectivity (≈ m) with a measure of environmental heterogeneity (≈ b; see Appendix S1 for methods). Doing this reveals clear variation in relative migrant load through space (Fig. 2.S1 in Supp. Materials). When we average this relative migrant load back to the patch level it is clear that peripheral patches in our example tend to have far lower migrant loads than core patches (Fig. 2.1C). Thus, peripheral patches sample the climate space well, and likely suffer less from the influence of maladaptive gene flow. Together, these results suggest that peripheral patches may provide a useful source of climate-associated adaptive variation from which we can draw for management purposes. There are additional reasons that populations surviving in peripheral patches might be particularly good candidates as sources of adaptive variation under climate change, and we expand on these below. And of course, not every patch will be suitable as a source for AGF: not every patch will be occupied by the species of interest, and even those patches that are occupied might still make poor sources for reasons which we also discuss below. While there are numerous potential factors that affect a population’s suitability, ecological and evolutionary perspectives suggests that three axes of variation are critical for determining the eco-evolutionary trajectory of the population with respect to climate: population size, population connectivity, and climatic 24.
(38) Chapter 2 – Locating adaptive diversity. environment. We now briefly discuss how each of these attributes affects a population’s suitability as a source of adaptive variation.. Population size Peripheral patches and the populations they contain are, by definition, smaller than their core counterparts. In our Wet Tropics example, peripheral patches are, on average, a mere 0.47% of the size of core patches. Their small area is one of the characteristics that make them interesting; it allows many of them to be scattered across a broad sample of environmental space. The size of isolates also has other consequences — evolutionary and ecological — that will determine the likelihood of both population persistence and local adaptation.. From an ecological perspective, patch size (and, by extrapolation, population size) is seen as a critical determinant of population persistence, because small populations are more prone to extinction through demographic and environmental stochasticity (Lande 1993). From an evolutionary perspective, population size also determines the balance between genetic drift and selection. While local adaptation is common, it is by no means universal (Hereford 2009). We might, for example, expect smaller populations to be less locally adapted, due to the stronger effects of genetic drift. Because of genetic drift, small populations might be expected to have lower diversity and less standing variation on which novel selection pressures can act, than do larger contiguous populations (Weiss & Goodman 1972; Petren et al. 2005; Lopez et al. 2009). In a review of local adaptation in plants, Leimu and Fischer (2008) found that populations with fewer than 1000 flowering individuals were less likely than larger populations to show signs of local adaptation. Indeed, in sufficiently small populations, genetic drift can overwhelm selection and even deleterious mutations can drift to fixation (Kimura 1979). Thus, as populations become small they may diverge substantially from the parental population, but for reasons having nothing to do with adaptation. Finally, as populations become exceedingly small, ecological and evolutionary 25.
(39) Chapter 2 – Locating adaptive diversity. effects interact strongly; high levels of inbreeding and demographic stochasticity combine to create an ‘extinction vortex’ (Gilpin & Soulé 1986). Thus, both evolutionary and ecological theory agree that, to persist as a viable locally adapted population, patches need to be large enough to support populations that are buffered from the worst excesses of genetic drift and demographic stochasticity.. A corollary to the extinction vortex, however, is that the small isolated populations that do persist, despite the inherent challenges, will more than likely carry traits that adapt them to living in that small patch. We are not talking here about sink populations that persist only because they are constantly bolstered by immigration (see next section); rather, we are talking about populations that persist largely on their own merit. Such persistent isolates will be locally adapted either because of selection in situ or because, through selective extinction of less resilient populations through time, the only populations still present are those resilient to living in isolates (Balmford 1996); a kind of group selection. One way, therefore, to measure the likelihood of local adaptation in a patch is to consider the population dynamics in that patch; populations that show genetic signatures of longterm isolation and demographic stability (e.g., Leblois et al. 2014) likely are composed of individuals well adapted to local conditions. Although there is scant work on this issue at the individual-trait level, there is clear evidence at the species-trait level. For example, the most obvious solution to living in small patches is to live at high density (to pack many individuals into a small space), and small species that occur at high density are often particularly well represented in isolates (see Reif et al. 2006).. Resilience to environmental variation is also likely to be important for the persistence of small isolates. This resilience is important because populations restricted to small patches cannot migrate to track preferred conditions when the environment changes. If they are to survive, they must contend with the changed conditions in their isolate. Consequently, populations that have persisted 26.
(40) Chapter 2 – Locating adaptive diversity. in small isolates are likely to be resilient to environmental variation. This resilience might be achieved through high rates of population increase (allowing rapid recovery), but also through resilient life histories: high degrees of phenotypic plasticity, overlapping generations, and/or longlived adults. For example, and at the species-trait level again, asexual species have high rates of population increase by avoiding the production of males, and this form of reproduction is particularly prevalent in isolates (Kawecki 2008). Similarly, long-lived species of plants tend to be resilient to change, and these species are also more prevalent in isolates (Hampe & Jump 2011).. Small isolates, therefore, select at both individual and group levels for resilience to demographic and environmental stochasticity. If we were to look for populations pre-adapted to the increasing regime of extreme events resulting from anthropogenic climate change, peripheral isolates offer a promising target. Thus, perhaps the most interesting populations from an AGF perspective are those that are small, but not too small. Or to put it another way, populations that are small but which, nonetheless, show evidence of persistence despite long-term isolation.. Population connectivity As well as its size, an isolate’s physical proximity to other isolates will greatly influence its immigration rate. This, in turn, has implications for population size and stability, with wellconnected patches typically having more persistent, stable populations (Levin et al. 1984). Thus, ecological theory generally sees high connectivity as beneficial because of its stabilising influence on demographics. Evolutionary theory, however, takes a more dichotomous view. On one hand connectivity increases gene flow, which, even at low levels, increases genetic variance and evolutionary potential (Polechová et al. 2009). On the other hand, high connectivity increases migrant load, and when maladaptive gene flow is high enough it can overwhelm (or swamp) local adaptation (Haldane 1956; Kirkpatrick & Barton 1997). Not only is the level of gene flow critical, but so too is its source. Sexton et al. (2011), for example, found that cross-pollination of a plant 27.
(41) Chapter 2 – Locating adaptive diversity. between warm-edge peripheral populations increased fitness, whereas cross-pollination between a peripheral and a core population decreased fitness. This highlights the need to choose source populations carefully to ensure they come from the climate space the recipient population is likely to experience in the future.. This concept of migrant load swamping the effect of natural selection is the reason that isolation is considered so important for adaptation (García-Ramos & Kirkpatrick 1997). If an isolated population has sufficient genetic variation, it will adapt to its local conditions, and this adaptation can occur rapidly. For example, the work of Losos et al. (1997) on experimentally isolated Caribbean Anolis lizards showed that morphological divergence driven by differences in habitat appeared within 10–14 years. In the face of strong gene flow from environmentally distinct populations, however, theory suggests that adaptation to local conditions will likely take substantially longer, if it occurs at all (Holt & Gomulkiewicz 1997; Bridle et al. 2009; Polechová et al. 2009; Phillips 2012).. Therefore, because they receive some influx of genetic diversity but not enough to swamp local adaptation, weakly connected populations should be very well adapted to local conditions. Choosing populations that do not experience strong gene flow also ensures that we avoid ecological-sink populations; those maintained purely by immigration.. An additional consideration here is that evidence of some gene flow suggests that a population has not developed coadapted gene complexes that work against successful admixture by reducing fitness of admixed individuals: “outbreeding depression”. For AGF to be successful, the genes from translocated individuals need to introgress into the recipient population, and this may be less successful when a population has been reproductively isolated for very long periods of time (Coyne & Orr 1998; Singhal & Moritz 2013). These genetic barriers to introgression have likely been 28.
(42) Chapter 2 – Locating adaptive diversity. greatly overstated (Weeks et al. 2011) and are only likely to be relevant where there are very long divergence times in which incompatibilities have developed across large sections of the genome. Despite no morphological differences, genetic data for our focal species (a small lizard: Lampropholis coggeri, see Appendix S1) show two deeply divergent lineages: a northern and a southern lineage that likely represent different species (Bell et al. 2010), and whose hybrids exhibit substantial reductions in fitness (Singhal & Moritz 2013). In this example, AGF should be restricted to within each lineage. Without this extensive distribution of incompatibilities, we would expect advantageous (but not disadvantageous) alleles to introgress into the recipient population relatively unimpeded (Barton 1979; Aitken & Whitlock 2013). In summary, evolutionary theory, in contrast to ecological theory, suggests that low connectivity is optimal for isolates that may act as a source for AGF.. Although connectivity is not necessarily easy to measure – it can vary over time, as well as space – there are numerous simple proxy measures of connectivity, using geospatial data that perform adequately against genetic metrics (e.g., Palmer et al. 2011). Using modelled habitat suitability in the Wet Tropics, and integrating these suitabilities over space (using species-specific dispersal expectations, see Appendix S1), we generated both point- and patch-level indices of connectivity for the Wet Tropics. When we score connectivity in this way we get the unsurprising result that connectivity declines towards the edges of large habitat blocks, and is generally much lower in isolated patches than in larger habitat blocks (Fig 2.1B). The exception to these generalities in the Wet Tropics is the western extent of the larger blocks, in which connectivity (premised on climatic suitability) remains high even to the edge of the larger blocks. This result reflects the effect of fire in this system: the western rainforest edge of the Wet Tropics is highly dynamic, expanding and contracting around fire events (Harrington & Sanderson 1994). This dynamism probably does lead to connectivity through time above what might be expected from a simple map of the habitat. Thus, many of the peripheral patches in our region – particularly along the western edge – have likely 29.
(43) Chapter 2 – Locating adaptive diversity. experienced much stronger connectivity than their current static configuration would suggest. Of course, genetic data on immigration rates between patches would be useful to ground-truth such landscape connectivity measures, and available evidence for our focal species does suggest longterm isolation in peripheral patches in the Wet Tropics (Bell et al. 2010). In the absence of these data, useful measures of relative predicted/potential connectivity can be derived from readily available GIS data.. While partial isolation facilitates evolution, it is not a driver of adaptation; it simply provides ideal conditions under which populations can respond to selection pressures without undue migrant load (Dawson & Hamner 2005). Those selection pressures come from the environment, which brings us to our third important axis: the climatic environment.. Climatic environment Geographic variation in climate is ubiquitous. Factors such as latitude, vegetation cover, elevation, and distance from the coastline can all create substantial spatial variation in climate (e.g., Shoo et al. 2010; Shoo et al. 2011). Indeed, microclimate may differ over even very small landscape scales (e.g., Pinto et al. 2010). For all of these reasons, isolates at the geographic edge of a species’ range will likely experience a different climate (both in mean and extreme values) from the climate at the centre of the species' range (Lesica & Allendorf 1995) that is, geographic marginality may often correlate with ecological marginality, particularly for climate. In the Wet Tropics, for example, it is clear that isolated patches have more extreme climates (Fig. 2.3).. 30.
(44) Chapter 2 – Locating adaptive diversity. Figure 2.3 In our study system there is a negative correlation (r2 = -0.38; p < 0.001) between rainforest patch connectivity and climatic extremity (see Appendix S1 for details of how climatic extremity was calculated): isolated patches have more extreme, less suitable climates for our focal lizard species.. 31.
(45) Chapter 2 – Locating adaptive diversity. One of our rationales for focussing on peripheral isolates as a source of adaptive diversity is precisely because they likely sample these extreme climates and, subject to persistence, are more than likely adapted to the climatic conditions in their habitat patch. Given the current trajectory of climate change (we are tracking towards a > 4˚C increase in mean global temperature by 2100; Meehl et al. 2007), it is inevitable that source populations of interest to managers will tend to be at the extremes of the sampled climate space. Insofar as species distributional limits are associated with climate (and they often are: Kearney & Porter 2004; Gaston 2009), these extremes of climate space will tend to be found in isolates, at the extremes of geographic space. If we examine patches that are too far into extreme climate spaces, however, it is unlikely that the species will be present. If we do not go far enough, it is likely that we will ineffectively sample the adaptive diversity contained within the species’ range. Thus, we are searching for populations that exist on the borderline (in climate space) between extinction and persistence through adaptation.. If we examine this edge (in climate space) between population persistence and extinction, we not only survey the locations containing important adaptive diversity, but we also learn about the limits of adaptation to climate. Because these peripheral isolates are naturally occurring and have often been in existence for at least several thousand years (many could be early Holocene relicts, sensu Hampe and Jump (2011)), they provide a good snapshot of the adaptive capacity of a species. If, based on size and connectivity, a species should be present in a patch but is not, then there might be a case that the environment in that location is too extreme, and beyond the limits of that species’ capacity to adapt.. Given the breadth of environmental sampling by peripheral patches, it is likely that a subset of isolates are currently in climate space beyond that occupied by core populations. This appears true in the Wet Tropics, where warmer, drier climates are better represented in peripheral patches than in the core patches (Fig. 2.2). Some of these isolates are already in a climate space that will manifest 32.
Figure

+7


Related documents
Speaking a Java idiom, methods are synchronized, that is each method of the same object is executed in mutual exclusion, and method invocations are asynchronous, that is the
During missionary James Watkin’s time in New Zealand from 1840 to 1855, he laboured to diffuse the Christian gospel and thereby he encouraged the cause of physical and moral peace
Key policy drivers (IOM Health Professions Education: A Bridge to Quality (2003); Lancet Commission (Frenk et al., 2010), Framework for Action on Interprofessional Education
Any provider in green has been approved to give the mandatory course and/or the pre- licensing course in addition to the regular continuing education courses... Cramer Home
In this research, using the exchange rate of the dollar against the euro proved from the start that applying the ARIMA model cannot give reliable future
All of the participants were faculty members, currently working in a higher education setting, teaching adapted physical activity / education courses and, finally, were
Todavia, nos anos 1800, essas práticas já não eram vistas com tanta naturalidade, pelos menos pelas instâncias de poder, pois não estava de acordo com uma sociedade que se
© 2013 – 2014 CommonWell Health Alliance Inc. All rights reserved.
