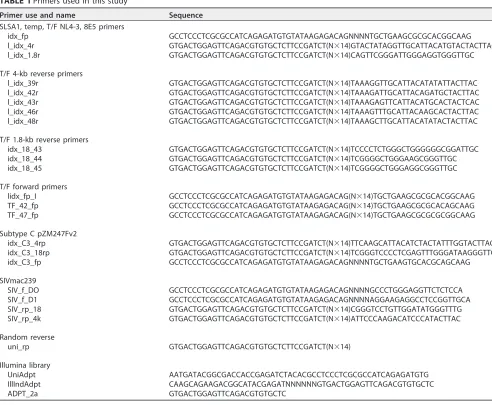
Characterizing HIV-1 Splicing by Using
Next-Generation Sequencing
Ann Emery,aShuntai Zhou,bElizabeth Pollom,c*Ronald Swanstromb,c,d
Curriculum in Genetics and Molecular Biology,aUNC Lineberger Comprehensive Cancer Center,bDepartment
of Biochemistry and Biophysics,cand UNC Center for AIDS Research,dUniversity of North Carolina at Chapel
Hill, Chapel Hill, North Carolina, USA
ABSTRACT Full-length human immunodeficiency virus type 1 (HIV-1) RNA serves as the genome or as an mRNA, or this RNA undergoes splicing using four donors and 10 acceptors to create over 50 physiologically relevant transcripts in two size classes (1.8 kb and 4 kb). We developed an assay using Primer ID-tagged deep sequencing to quantify HIV-1 splicing. Using the lab strain NL4-3, we found that A5 (env/nef) is the most commonly used acceptor (about 50%) and A3 (tat) the least used (about 3%). Two small exons are made when a splice to acceptor A1 or A2 is followed by activation of donor D2 or D3, and the high-level use of D2 and D3 dramatically re-duces the amount of vif andvprtranscripts. We observed distinct patterns of tem-perature sensitivity of splicing to acceptors A1 and A2. In addition, disruption of a conserved structure proximal to A1 caused a 10-fold reduction in all transcripts that utilized A1. Analysis of a panel of subtype B transmitted/founder viruses showed that splicing patterns are conserved, but with surprising variability of usage. A sub-type C isolate was similar, while a simian immunodeficiency virus (SIV) isolate showed significant differences. We also observed transsplicing from a downstream donor on one transcript to an upstream acceptor on a different transcript, which we detected in 0.3% of 1.8-kb RNA reads. There were several examples of splicing sup-pression when theenvintron was retained in the 4-kb size class. These results dem-onstrate the utility of this assay and identify new examples of HIV-1 splicing regula-tion.
IMPORTANCE During HIV-1 replication, over 50 conserved spliced RNA variants are generated. The splicing assay described here uses new developments in deep-sequencing technology combined with Primer ID-tagged cDNA primers to efficiently quantify HIV-1 splicing at a depth that allows even low-frequency splice variants to be monitored. We have used this assay to examine several features of HIV-1 splicing and to identify new examples of different mechanisms of regulation of these splic-ing patterns. This splicsplic-ing assay can be used to explore in detail how HIV-1 splicsplic-ing is regulated and, with moderate throughput, could be used to screen for structural elements, small molecules, and host factors that alter these relatively conserved splicing patterns.
KEYWORDS HIV-1, RNA splicing, next-generation sequencing, primer ID, simian immunodeficiency virus
H
uman immunodeficiency virus type 1 (HIV-1) is a plus-stranded RNA virus that replicates through an obligatory integrated DNA intermediate. The virus carries 10 genes and uses several different strategies to allow expression of these genes, given that eukaryotes typically translate only the first open reading frame (ORF) of an mRNA. Unspliced full-length transcripts code for the Gag and Gag-Pro-Pol polyproteins. The remaining seven viral proteins are translated from over 50 mRNA variants generated by the host cell splicing machinery (1).Received3 January 2017Accepted4 January 2017
Accepted manuscript posted online11 January 2017
CitationEmery A, Zhou S, Pollom E, Swanstrom R. 2017. Characterizing HIV-1 splicing by using next-generation sequencing. J Virol 91:e02515-16.https://doi.org/10.1128/ JVI.02515-16.
EditorKaren L. Beemon, Johns Hopkins University
Copyright© 2017 American Society for Microbiology.All Rights Reserved.
Address correspondence to Ronald Swanstrom, [email protected]. *Present address: Elizabeth Pollom, Department of Chemistry, San Jose State University, San Jose, California, USA.
GENOME REPLICATION AND REGULATION OF VIRAL GENE EXPRESSION
crossm
on November 7, 2019 by guest
http://jvi.asm.org/
HIV-1 splicing has been extensively studied and the splice variants and splice regulatory sequences have been well characterized (2, 3), most often using the labo-ratory strain NL4-3. Approximately one-half of the initial full-length transcripts remain unspliced and serve either as genomic RNA or as mRNA for the Gag and Gag-Pro-Pol polyproteins (Fig. 1). The remaining half of the full-length transcripts are spliced (1). All spliced RNAs use donor site 1 (D1) in the 5=noncoding region and 1 of 10 downstream acceptor sites (A1, A2, A3, A4a, A4b, A4c, A4d, A5, A5b, A7) (2, 4). About half of the spliced RNAs also undergo further splicing to remove the D4-A7envintron (2). These smaller RNAs are referred to as the completely spliced or 1.8-kb size class. Spliced RNAs that retain the D4-A7 intron are known as the incompletely spliced or 4-kb size class. Completely spliced transcripts are exported from the nucleus via cellular mRNA path-ways; however, the incompletely spliced and full-length transcripts require a viral protein, Rev, for nuclear export. The D4-A7 intron contains the Rev binding sequence RRE (Rev response element). With increasing concentrations of Rev, the expression pattern is altered by allowing incompletely spliced RNAs to exit the nucleus (5, 6). As a rule, the major splice products are produced from a direct splicing event between D1 and one of the acceptor sites (Fig. 1). The ensuing transcript is generally translated from the first ORF downstream of this direct splice junction. Thus, D1-A1 splicing makes avif
transcript, D1-A2 avprtranscript, and so on. The facts that D1 is engaged as a splice donor in only a fraction of the full-length transcripts, that D1 splicing must singly engage a number of different downstream splice acceptor sites, and that splicing of the D4-A7 intron is itself regulated all point to a highly orchestrated pattern of splicing to allow adequate expression of each of the viral proteins.
Even greater splicing complexity comes from the use of two additional donor sites, D2 and D3, that create two small exons, A1-D2 and A2-D3, one or both of which may be included in splice variants for the downstream genes (2). The purpose of these small exons is unknown, and they are present in only a small fraction of RNAs. They do not code for any known regulatory elements or alternative proteins, and mutations that prevent their use have shown contradictory results regarding fitness, transcript stability, and splicing effects (1, 7–10). Other studies have searched for regulatory sequence elements around the major splice acceptors, and different types of regulatory elements that control the utilization of splice sites have been identified (10–13). Sequence elements outside the specific splice site sequences bind cellular factors that enhance or suppress donor or acceptor usage, often in a concerted or competitive manner (14, 15). Mutations in these elements have been reported to alter splicing (1, 2).
The major splicing elements of HIV-1 subtypes B and C were originally defined using assays that require reverse transcription (RT)-PCR amplification of splice variants fol-lowed by cloning and sequencing of clones. Another approach to assaying splicing has been to identify the RT-PCR products of the individual splice variants by size (2, 16).
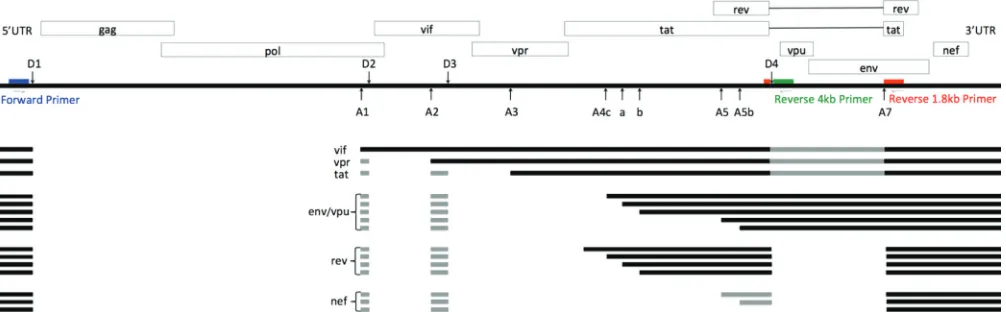
FIG 1HIV-1 splice patterns and primer locations. Blue, forward primer; red, 1.8-kb class Primer ID-tagged reverse primer; green, 4-kb class Primer ID-tagged reverse primer. Gray boxes are small exons or sequences that may or may not be present in the respective transcripts. Adapted from Purcell and Martin (2).
on November 7, 2019 by guest
http://jvi.asm.org/
[image:2.585.43.546.73.229.2]Studies assessing the effects of control element mutations on splicing have often been done using incomplete viral RNAs, such as single-intron minigenes, simplifying the analysis but placing splicing outside the context of the entire viral genome. More recently, a deep-sequencing approach used the PacBio platform with its long read capability to characterize HIV-1 splicing in extensive detail. This approach confirmed the previously described splice variants and discovered new ones (3).
Here we report a new assay to analyze HIV-1 splicing based on the Illumina MiSeq deep-sequencing platform. We used the assay to quantify the splicing patterns within each mRNA size class in HIV-1NL4-3 infection and after transfection of an infectious clone. We quantified acceptor usage and the differential usage of minor splice donors D2 and D3 in the two mRNA size classes, one of several examples in which splicing was differentially regulated between the two size classes. We observed that two silent mutations designed to disrupt a conserved element of secondary structure, SLSA1 (stem-loop containing splice acceptor A1), caused a 10-fold decrease in splicing to A1, linking this feature of secondary structure to regulation of A1 usage. We examined the stability of splicing as a function of temperature and observed two distinct patterns of temperature sensitivity, with splicing to A2 increased at the lower temperature but inhibited at the higher temperature while splicing to A1 was just inhibited at the higher temperature. We found that the combined effects of the SLSA1 mutation and temper-ature were additive in their effects on A1. We also examined the extent to which complex splicing patterns are conserved by assaying splicing in a panel of transmitted/ founder (T/F) viruses, which showed that most features of HIV-1 splicing are highly conserved, although examples of variability in the frequency of use were seen. We adapted the assay to quantify splicing in a subtype C isolate and found high conser-vation compared to subtype B. Analysis of splicing in a simian immunodeficiency virus (SIV) isolate revealed many conserved features but also significant differences. We detected transsplicing between different transcripts and even between transcripts from different proviruses. Collectively, these results provide greatly enhanced quantification of splicing in the context of viral infection and offer new insights into HIV-1 splicing and its regulation.
RESULTS
Description of a new splicing assay.We developed a new HIV-1 splicing assay that combines deep sequencing with the previously developed Primer ID technology (17). In this assay, total cellular RNA from infected or transfected cells is extracted and used in two different cDNA reactions, each one specific to the two viral mRNA size classes (1.8 kb and 4 kb). The 3=end of the cDNA primer used to capture the 4-kb size class of viral RNAs is placed near the 5=end of the D4-A7envintron (Fig. 1, shown in green). This intron is removed from the 1.8-kb size class RNAs, so this primer is specific for the 4-kb class. The cDNA primer for the 1.8-kb class is shown in red. The 3= end of this primer spans the D4-A7 splice junction, which forms only in the 1.8-kb RNAs. Each of the cDNA primers includes a common sequence at its 5= end that serves as the sequence of the reverse primer in PCR. The forward PCR primer, shown in blue in Fig. 1, is upstream of D1 and is used in the PCR amplification of both size classes.
The Primer ID portion of the cDNA primer is an internal random sequence tag in the primer that is used to identify and quantify individual viral RNA templates. The cDNA primers are synthesized with this internal random nucleotide sequence block. This creates random combinations of primer tags. Given a sufficient excess of random sequence tags relative to sample templates, any one viral RNA template will be primed with a unique random sequence in the cDNA primer that is then incorporated into the cDNA. The same sequence tag, present in the cDNA primer, will be present on all PCR products that come from this one viral RNA template. The cDNAs are then PCR amplified, made into an Illumina library, and sequenced using Miseq paired-end sequencing. Each sample produces millions of sequence reads. In the Illumina paired-end method, each read contains approximately 300 bases starting from the forward primer and, similarly, a corresponding 300-base reverse sequence beginning with the
HIV-1 Splicing with Next-Generation Sequencing Journal of Virology
on November 7, 2019 by guest
http://jvi.asm.org/
in the sequencing output, each unique Primer ID tag is counted as a single observation of an mRNA molecule. For the reported experiments, the sequencing depth typically ranged from 100,000 to 500,000 unique Primer IDs, indicating that this number of independent mRNA templates were queried, allowing the accurate quantification of the normal viral spliced RNAs and the reliable detection of rare or cryptic events.
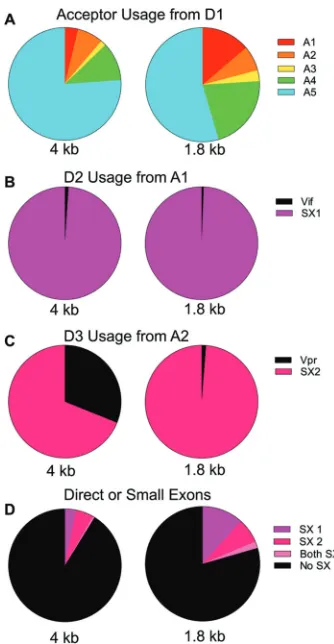
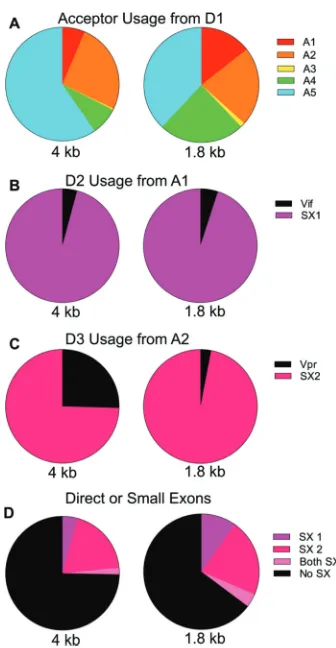
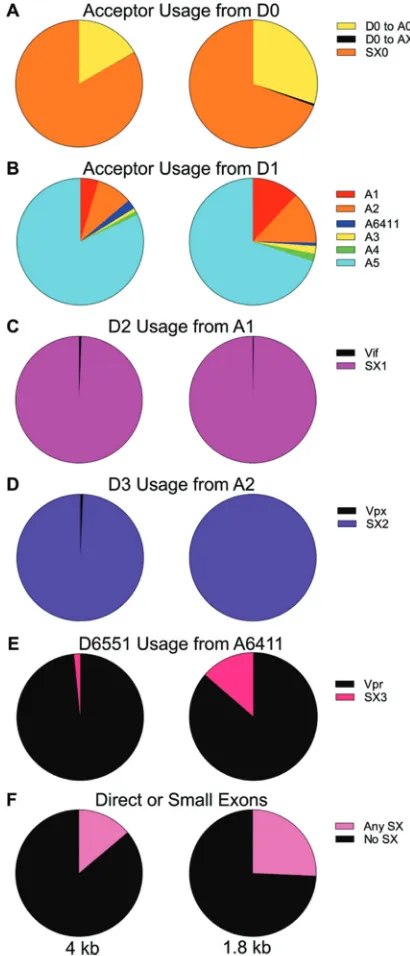
Quantification of acceptor splice site usage in NL4-3.CEMx174 cells were in-fected with HIV-1NL4-3, and the cells were grown in culture until syncytia formed, as evidence of a robust but asynchronous infection. Total cellular RNA was extracted and used as input for the sequencing and quantification of spliced viral mRNAs. An overview of the data is as follows. Essentially, all spliced viral transcripts use D1 and splice to a downstream acceptor site. Although there are multiple A4 and A5 acceptors, they are grouped together (as A4 or A5) in the figures. The relative usage of each acceptor for both size classes is shown in Fig. 2A. The patterns are somewhat similar in the two size classes, withenvA5 as the most commonly used acceptor andtatA3 the least used acceptor. A previous study suggested that HIV-1 splicing is sequential (18), and the relative proportions in each size class suggests that the choice of upstream splice acceptor site differentially influences downstream splicing (i.e., of the D4-A7 intron). A transcript spliced from D1 to A1, A3, or A4 has an increased probability of splicing from D4 to A7 and so of being a 1.8-kb transcript. In contrast, a splice between D1 and A2 does not affect the use of D4 and A7, while splicing from D1 to A5 skews toward suppressing the use of D4 and A7, thereby including the envintron (a 4-kb transcript). Thus, the use of D4 and A7 appears to be differentially impacted by the choice of the upstream splice acceptor by D1.
Splicing events from D1 to A1 or A2 initially make aviforvprmRNA, respectively. However, a splice to A1 most often splices again by utilizing the nearby downstream donor D2 to create small exon 1 (SX1), with D2 splicing to one of the other downstream acceptor sites, A2 to A5 (Fig. 2B). Thus, the initial splicing to A1 results in a relatively low number ofviftranscripts in both size classes, with the use of D2 reducing the potential number ofviftranscripts by over 95%.
The splicing events from D1 to A2 have a different outcome in the two size classes with respect to the utilization of the adjacent D3 donor to generate SX2 (Fig. 2C). In the 1.8-kb class, most A2 splices utilize D3 to create small exon 2 and then splice again to A3, A4, or A5; however, in the 4-kb class, 31% of splices to A2 remain asvprtranscripts. This suggests that D3 usage affects downstream D4 usage, such that the inclusion of SX2 (i.e., the use of D3) increases the probability of splicing from D4 to A7 with removal of theenvintron. Alternatively, the same mechanism that suppresses D4 utilization to create the 4-kbenvmRNA may also suppress utilization of D3.
Transcripts with either or both of the small exons are present at twice the frequency in 1.8-kb transcripts compared to 4-kb transcripts (Fig. 2D), an observation that is partially driven by the disproportionate inclusion of small exon 2 in the 1.8-kb mRNAs (Fig. 2C) but primarily driven by the increased use of A1 (and the small exon from A1-D2) in the 1.8-kb mRNAs (Fig. 2A and B). This suggests that inclusion of small exons upregulates splicing from D4-A7. It is curious that in the vast majority of cases, splicing to A1/vifand A2/vprare followed by subsequent splicing at D2 and D3, respectively;
on November 7, 2019 by guest
http://jvi.asm.org/
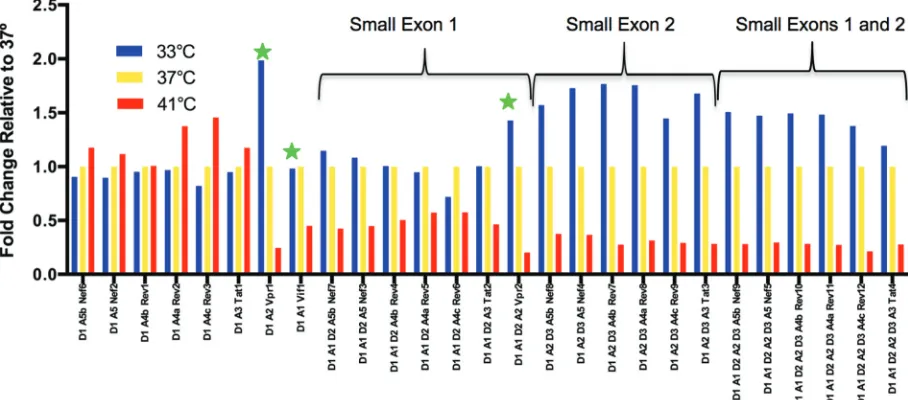
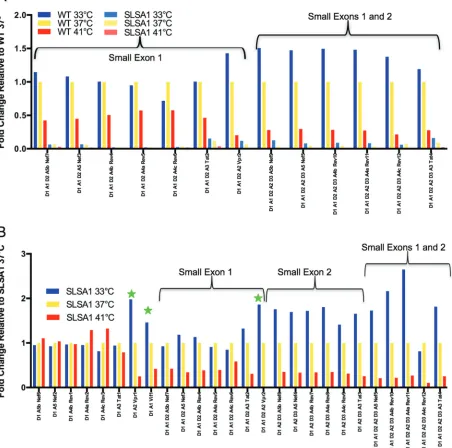
however, the majority of the A3-A5 transcripts are the result of a direct splice from D1 and do not include the small exons (Fig. 2D). This suggests that the main functions of D2 and D3 are to downregulate the expression of vifandvprbeyond what can be accomplished through differential splicing among the splice acceptor sites. The high-frequency use of D2 and D3 would also be expected in exon definition (discussed below); however, this highlights the unexpected difference in D3 use between the size classes. In this analysis, we have likely underestimated A1 and A2 usage due to differences in the length of cDNA product needed to see splicing to the proximal splice acceptor sites A3-A5 (within 300 nucleotides) compared to the distance from the cDNA primer to A1 (1,100 nucleotides); however, the use of Primer ID corrects for any subsequent skewing in amplification efficiency of longer versus shorter PCR products. Differential effects of temperature on splicing. HIV-1 splicing must function through the presence of suboptimal splice donor and acceptor sites to allow a vast array of splicing outcomes. Inefficient pairing of these suboptimal sites with the cellular splicing machinery has been shown to affect donor and acceptor usage (10, 15, 19–21). We reasoned that some of these interactions with the cellular splicing machinery could be temperature sensitive. Temperature changes might also affect the stability of RNA secondary structures that work in cis to regulate splicing. To test the effects of temperature, a culture of CEMx174 cells infected with HIV-1NL4-3was split into 3 flasks that were then incubated for 6 h at 33°, 37°, or 41°C. At the end of 6 h, RNA was extracted from the cells and the viral splice products were measured (Fig. 3). In general, increasing temperature modestly upregulated splice variants without small exons 1 or
FIG 2Quantification of HIV-1 splicing patterns. (A) Acceptor usage from D1 in the two size classes. Circles represent all transcripts in the size class. (B) Circles represent the total splices from D1 to A1. Shown are proportions that splice again at D2 and those that remainviftranscripts. (C) Circles represent the total splices to A2 and the proportions that splice again at D3 compared to those that remainvprtranscripts. (D) Circles represent all transcripts in the size class. Shown are proportions of transcripts that contain either one, both, or no small exons. SX1, small exon 1; SX2, small exon 2.
HIV-1 Splicing with Next-Generation Sequencing Journal of Virology
on November 7, 2019 by guest
http://jvi.asm.org/
[image:5.585.120.287.69.391.2]2. However, splice acceptors A1 and A2 were very sensitive to temperature and showed different responses to temperature changes. Splicing to A1 decreased with increasing temperature, and this was seen for both theviftranscript and all transcripts that include SX1 defined by A1 and D2 usage. Similarly, all splices to A2 also decreased with increasing temperature but were additionally significantly upregulated at lower tem-perature, includingvprtranscripts and transcripts including SX2 between A2 and D3. Transcripts that use both A1 and A2 showed the more dominant effect of A2 alone. Thus, we see distinctive temperature sensitivities of the splice acceptor sites, with the most sensitive being the sites associated with the generation of the small exons.
Changes in secondary structure can affect splicing. HIV-1 RNA has regions of highly conserved secondary structure, and many of these structures have functional relevance (19, 20, 22–27). These include the TAR binding site in the 5= untranslated region (UTR), which binds the viral Tat protein and is required for processive transcrip-tional elongation (28). The major splice donor D1 is also in this region as well as a structure that regulates genome packaging (24) and the dimerization sequence. The Rev response (binding) element (RRE), located in theenv intron, also has features of highly conserved secondary structure (29). Some splicing elements are contained in, or are in close proximity to, conserved structural elements, and some of these structures are well characterized (19, 21, 22, 26). This raises important questions about the role of RNA structural elements in controlling splicing during viral infection and the impor-tance of such structures for correct splicing.
A previous comparison of RNA secondary structure between HIV-1NL4-3 and SIVmac239 revealed regions of highly conserved structure (22), one of which was a stem-loop structure termed SLSA1 that contains thevifsplice acceptor site A1 in the loop. We previously engineered two silent point mutations to disrupt the SLSA1 stem without changing the A1 splice acceptor sequence or nearby reported splice regulatory sequences and noted a change in downstream splicing using an older, PCR product size-based assay (22). We have reevaluated this mutant with the new deep-sequencing assay and confirm an effect on splicing but can now identify it as an effect on the proximalvifA1 splice acceptor site. RNA from CEMx174 cells infected with the SLSA1 mutant virus was processed in parallel with the RNA from cells infected with the wild-type (WT)/parental strain NL4-3. These two point mutations resulted in an
approx-FIG 3Temperature-dependent splicing regulation. Cells were infected with HIV-1 strain NL4-3, and after several days the culture was divided and placed at the indicated temperatures for the last 6 h. Whole-cell RNA was extracted and viral RNA assessed for splicing. The histogram shows the ratio of the percentage of each 1.8-kb transcript type relative to the 37°C sample (always at a 1:1 ratio with itself). Splice variants are grouped by direct splice to the final acceptor or small exon inclusion. Stars indicate splices to A1 that makeviftranscripts or splices to A2 that makevpr. Thexaxis labels show the splice donors and acceptors used and the protein product of the transcript.
on November 7, 2019 by guest
http://jvi.asm.org/
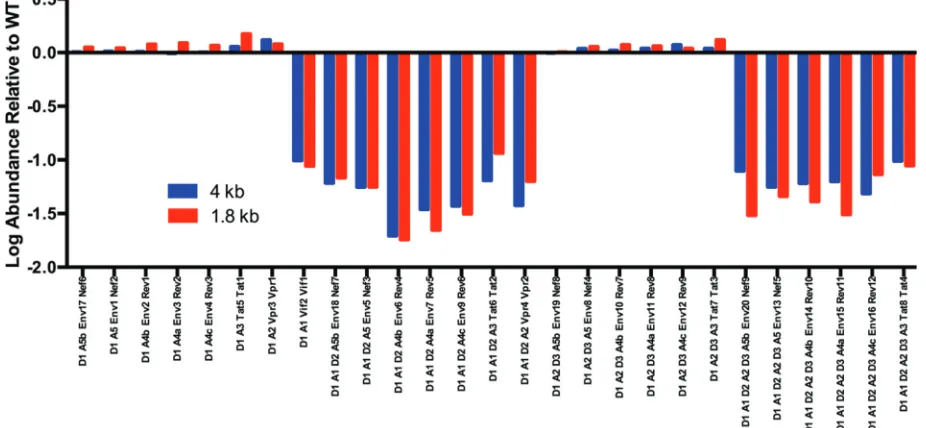
[image:6.585.42.496.74.274.2]imately 10-fold decrease in the utilization of A1 relative to the control, which was reflected in the decrease of the direct splice to createvifmRNA and in RNAs containing the first small exon from A1 to D2 (Fig. 4). Thus, the conserved SLSA1 stem-loop structure containing the A1 splice site plays an important role in regulating the utilization of that site.
Combined effects of temperature and structure. We next reasoned that the temperature sensitivity of A1 might be related to the melting of the proximal conserved stem-loop structure (SLSA1). This would predict that the SLSA1 mutant would not be temperature sensitive for splicing to A1. To test this, we compared splicing across the temperature range in the SLSA1 mutant with that in WT NL4-3, using the same strategy as in the temperature gradient experiment. We saw that the effects of temperature and the SLSA1 mutations were additive compared to the wild-type virus at 37°C, reducing splicing to A1 to very low levels (Fig. 5A). When we focused on the effects of the different temperatures within the context of reduced splicing of the SLSA1 mutant, we saw that the patterns of increases and decreases of splice site usage as a function of temperature were the same as those seen with wild-type virus (Fig. 5B). This suggests that there are two separate mechanisms giving rise to the SLSA1 and temperature-sensitive phenotypes for splicing to A1. We have also noted enhanced accumulation of APOBEC3 G/F mutations in the deep-sequencing data set with the SLSA1 mutant, consistent with reducedvifmRNA resulting in reduced levels of Vif (data not shown). Splicing in transfected cells.The comparison between the SLSA1 mutant and WT NL4-3 was repeated using transfected 293T cells, and essentially identical splicing patterns were observed (data not shown). This and other experiments showed that the splicing quantification assay for HIV-1 gives similar results in comparing asynchronous viral replication in CEMx174 cells or after transfection of 293T cells. Performing the assay in transfected cells has the potential to allow splicing analysis of mutant viral genomes that are incapable of infection and replication in a permissive cell line.
Comparison of splicing in T/F viruses.Most HIV-1 splicing studies have used strain NL4-3, a subtype B chimeric virus and a laboratory strain (30). We asked if splicing in HIV-1NL4-3is representative of splicing in clinical isolates and if conserved splicing is critical for infection and spread of HIV-1. To address these questions, we analyzed splicing in a panel of subtype B transmitted/founder (T/F) viruses (31–33). We found that overall the splicing patterns were similar among all the isolates in that the same
FIG 4Effects of SLSA1 structural mutations on splicing. Theyaxis is a log scale of the fold change of splice type abundance of SLSA1 mutant relative to WT NL4-3; thexaxis shows the pattern of splice donors and acceptors and the transcript type in the 4-kb and 1.8-kb class with that pattern. A missing bar indicates that the splice type did not occur in the SLSA1 mutant.
HIV-1 Splicing with Next-Generation Sequencing Journal of Virology
on November 7, 2019 by guest
http://jvi.asm.org/
[image:7.585.39.502.77.291.2]splice site acceptors and donors were used, including for the small exons, but with examples of surprising ranges of variability. In these analyses, we used values obtained from three different experiments with strain NL4-3 to account for experimental vari-ability.
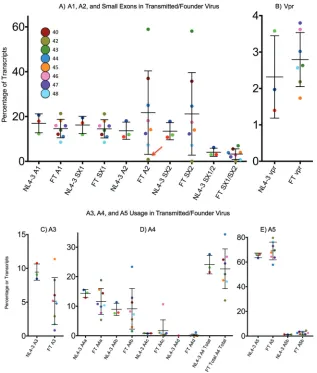
The range of A1 usage in the T/F viruses is comparable to that in NL4-3, while splicing from D1 to A2 varies from near 0 to about 60 percent of total transcripts (Fig. 6A). D2 and D3 are utilized in proportions comparable to those seen with NL4-3 and in percentages that correlate closely with the use of upstream A1 or A2. Thus, the high-frequency use of D3 results in most of the high A2 utilization turning into downstream transcripts, with the level of residualvprtranscripts showing only modest variability in spite of the variability in the use of A2 (Fig. 6B).
One isolate, sample 42, indicated by the red arrow in Fig. 6A, has a G-to-A transition at the donor site D3 that disrupts the donor consensus sequence. It would be expected
FIG 5Combined effects of temperature and SLSA1 mutation. (A) The histogram shows the ratio of the percentage of each 1.8-kb transcript that utilizes A1 relative to the 37°C WT sample. (B) Ratio of the percentage of all 1.8-kb transcripts from SLSA1 mutant samples relative to the 37°C SLSA1 mutant sample.
on November 7, 2019 by guest
http://jvi.asm.org/
[image:8.585.45.497.83.531.2]that with the knockdown of D3 usage, transcripts spliced to A2 would accumulate, resulting in increased vpr transcripts and very few transcripts with small exon 2. However, this was not the case. The change to D3 corresponded with greatly decreased splicing to A2 (Fig. 6A). There are no obvious sequence changes in this virus that would explain reduced use of A2. This suggests either that there is a connection between the recognition of D3 as a splice donor and the use of A2 as a splice acceptor, as predicted by the concept of exon definition, or that some unrecognized sequence change has independently downregulated A2 use in this isolate. Thus, in spite of a mutated D3 site and low usage of A2 in this virus,vprtranscript levels are near a normal level (Fig. 6B). Splicing to A3/tatspanned a range from less than 1% to greater than 11% (Fig. 6C). There are four A4 splice acceptors, named A4a to A4d (Fig. 6D). There was greater variety in A4 usage than in any other acceptor, and different viruses showed different A4 splice site preferences. There was also a higher degree of sequence variability around these acceptors. The differences in use were partly compensatory in that total A4 usage varied only around 3-fold while the use of any one site varied up to 10-fold. The relative usage of the two A5 acceptors (A5 much greater than A5b) was similar between the different strains, with A5 always being the predominant splice acceptor but varying from less than 60% to more than 80% (Fig. 6E). Thus, the relative amounts
FIG 6Splicing in transmitted/founder viruses. (A) Ranges of A1, A2, and small exon usage in eight transmitted/founder viruses compared to NL4-3. SX1, small exon 1; SX2, small exon 2. NL4-3 samples are from three separate experiments; the red dot indicates the sample run in the transmitted/founder experiment. Results shown are for 1.8-kb transcripts. The red arrow indicates sample 42, which has a mutated D3 sequence. (B)vprtranscripts in transmitted/founder. (C to E) Usage of A3, A5, and A4 variants in transmitted/founder virus, 1.8-kb transcript class.
HIV-1 Splicing with Next-Generation Sequencing Journal of Virology
on November 7, 2019 by guest
http://jvi.asm.org/
[image:9.585.48.365.70.443.2]of the mRNAs for the different viral proteins were generally similar, with the RNAs for Tat and Rev showing the greatest variability. These results confirm that there is a core set of just over 50 major spliced RNA products that define the conserved HIV-1 RNA expression program.
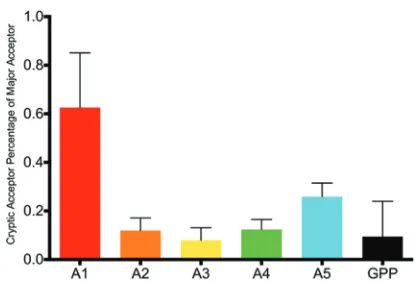
Detection of cryptic/rare splicing events.While the main donor and acceptor sites are well defined, we identified missplicing, particularly to the nearby bases around all of the major donor and acceptor sites. In addition, there was a low-level background of rarely used acceptor sites across the genome, interspersed with hot spots. It has been reported previously that blocking a canonical splice acceptor or donor site leads to activation of cryptic sites (2, 34, 35). While we did not test this phenomenon directly, we note that the virus with the defective D3 donor site (sample 42) did not activate a substitute donor site for D3 or an alternative acceptor for A2. Even the T/F viruses in the extremes of low or high acceptor usage did not activate significant cryptic donor or acceptor sites. A scan for rarely used acceptor sites in all of the T/F viruses identified sites used at various frequencies, and the proportions of proximal alternative acceptor sites compared to use of the canonical acceptor sites for each of the transcripts for viral proteins are shown in Fig. 7. Rare acceptors within the normally unsplicedgag-pro-pol
(GPP) sequence were also compared to total transcripts. Transcripts with rare splice sites made up a very small proportion (less than 1%) of total transcripts both in NL4-3 and in this panel of T/F viruses.
An unusual set of rare splicing events was observed in both NL4-3 and all T/F viruses, in which the apparent order of splicing was reversed. Splicing from D2 to A1 and from D3 to A1 or A2 was observed, as well as from D4 to all upstream acceptors. This out-of-order acceptor use suggests transsplicing, where a donor from one transcript splices to an acceptor in a different transcript. In the 1.8-kb size class of the NL4-3 isolate, transsplicing to A1 made up 0.006% of total transcripts, and 0.3% of all reads had a D4 transsplice to an upstream acceptor. Acceptor usage in these D4 transsplices was similar to acceptor usage from D1, as shown in Fig. 2A. In these cases, the region between A5 and D4 becomes yet another small exon. These additional small exons skew toward the 1.8-kb transcript class, at a frequency six times greater than that of the 4-kb transcripts for transsplices from D2 or D3 to A1 and three times greater for transsplices from D4. Remarkably, consecutive transsplicing events could also be detected in rare transcripts, such as D4 to A2 followed by D3 to A2.
It has been observed that reverse transcriptase and/or PCR template switching can create transsplicing artifacts between regions of sequence identity (36, 37). We do not believe this is the cause of the transsplices we have observed between these canonical splice sites. We looked for evidence of artifactual apparent transsplicing. There are regions of exact identity to portions of several canonical acceptor and donor sites in some of the T/F viruses. Isolates 43 and 47 have a duplicate post-A1 sequence 166
FIG 7Cryptic acceptor usage as a percentage of major acceptor usage in transmitted/founder viruses and NL4-3. Transcripts with cryptic acceptor sites are shown as a percentage of noncryptic transcripts using the comparable major acceptor site with the same open reading frame. Cryptic acceptors in the
gag-pro-pol(GPP) sequence are compared to total transcripts.
on November 7, 2019 by guest
http://jvi.asm.org/
[image:10.585.101.311.68.210.2]nucleotides upstream of the actual A1 site. In addition, isolate 42 has a duplicate pre-D2 sequence 24 nucleotides upstream. All have 10 nucleotides of exact sequence identity, and yet they were never found in combination with a canonical splice donor or acceptor. Thus, the transsplicing is linked to the functional donor and acceptor sites and not regions sharing sequence identity with these sites. Additionally, we reasoned that if template switching were random in regions of sequence similarity, we should see a high proportion of other random events near the transspliced sites; however, when we scanned for nearby transsplices, we found none. Taken together, this leads us to conclude that the transsplicing that we observed is not artifactual but rather a measure of errors in splicing by the host cell machinery.
We asked if transsplicing occurs only in cis, i.e., between transcripts in close proximity as they are consecutively transcribed from a single provirus, or if it could occur in trans between transcripts from proviruses at different integration sites. To address this question, we pseudotyped HIV-1 subtype C Δenv particles with the vesicular stomatitis virus (VSV) G envelope protein and used this virus to infect 8E5 cells. 8E5 cells have a single stably integrated HIV-1 subtype B genome. 8E5 and the subtype C virus generated from pZM247Fv2 have sequence dissimilarities that can identify a change from a donor of one viral RNA to an acceptor of another viral RNA. We harvested total cellular RNA from the dually infected 8E5 cells and used it in the splicing assay, with forward and reverse primers specific for 8E5 and pZM247Fv2. Our results found transsplicing from both the 8E5 virus to the pZM247Fv2 virus and vice versa, suggesting that trans-transsplicing between transcripts from different proviruses is possible.
Splicing in subtype C.We adapted the assay to quantify splicing in this subtype C strain and found that splicing for virus generated from the pZM247Fv2 clone is very similar to virus generated from the pNL4-3 clone (subtype B). Donor and acceptor sites were precisely conserved. The relative abundance of splice acceptor usage is also very similar (Fig. 8), as is usage of the small exons. The splicing differences seen between the 4-kb and 1.8-kb sizes in NL4-3 are also seen in pZM247Fv2. A previous study found high variation in A4 splice site usage among subtypes and samples (16, 38). In this single sample, we did not see any new splice site usage, although the pZM247Fv2 sequence has a point mutation that completely inactivates A4d.
Splicing quantification in SIVmac239. We next adapted the assay to quantify splicing in SIVmac239. SIVmac239 has a more complicated splicing pattern than HIV-1 (Fig. 9). Though generally very similar to HIV-1, SIVmac239 includes an expanded 5=UTR with an optional intron upstream of D1, here called small exon 0 (SX0). We began by using a random reverse primer to find the splice junctions and then designed primers that would pick up the 1.8- and 4-kb size class equivalents, as in the HIV-1 assay. Like the HIV-1 assay, the SIVmac239 assay uses Primer ID-tagged reverse primers specific to each size class and a forward primer 5= of D1, which is also the major splice donor. Additionally, a second forward primer 5=of D0 was used in separate reactions with each reverse primer to quantify splicing from D0.
Most SIVmac239 acceptors and donors align with and act analogously to HIV-1 acceptors and donors (Fig. 10). The relative acceptor usage is mostly similar to that of HIV-1, except that in SIVmac239, A5 was used even more frequently in both size classes, such that most spliced transcripts use A5 as the final acceptor, whether by direct splicing from D1 or by including the small exons (Fig. 10B).
The two small exons SX1 and SX2 are conserved, though in SIVmac239 additional donors and acceptors create a third small exon (called here SX3) due to the presence of the extra genevpx. Two of these small exons overlap SX1 (using A1 and either D2 or a donor at position 5514) and SX2 (using either A2 or an acceptor at 6018 and D3). The third small exon spans positions 6411 to 6551. Thus, an SIVmac239 transcript can have up to three of these small exons, and all possible combinations of the three small exons are observed. In SIVmac239, A2 (and SX2) is linked tovpx, a gene not present in HIV-1 and placed betweenvifandvpr. An additional splice acceptor site, A6411, is used
HIV-1 Splicing with Next-Generation Sequencing Journal of Virology
on November 7, 2019 by guest
http://jvi.asm.org/
to makevprtranscripts, and this splicing event activates D6551 to make SX3. In both SIVmac239 and HIV-1, a greater fraction of splices to thevpracceptor remain asvpr
transcripts in the 4-kb class, while in the 1.8-kb size class use of A6411 more often activates D6551 to make SX3; however, in contrast to the high use of D3 to make SX2 in HIV-1, in SIVmac239 SX3 is seldom made even in the 1.8-kb class—most splices to A6411 remainvprtranscripts (compare Fig. 10E and 2C). It is worth noting that splicing tovpxis similar to the upstreamvifand not the downstreamvprin the high use of the proximal donor site (D3) in both size classes, leaving littlevpxmRNA (Fig. 10C and D). There is no splicing analog to SX0 in HIV-1. In contrast to the creation of the small exons SX1 and SX2, which are generated after splicing to A1 or A2 followed by splicing from D2 and D3 (respectively), inclusion of SX0 results from not splicing. Quantification using the primer upstream of D0 shows that the 85-nucleotide-long D0-A0 intron is
FIG 9SIVmac239 splice patterns and primer locations. Light blue, D0 forward primer; blue, D1 forward primer; red, 1.8-kb class Primer ID-tagged reverse primer; green, 4-kb class Primer ID-tagged reverse primer. Gray boxes are small exons or sequences that may or may not be present in the respective transcripts. The image is not drawn to scale, but relative locations are correct.
FIG 8Quantification of splicing in subtype C strain pZM247Fv2. (A) Acceptor usage from D1 in the two size classes. Circles represent all transcripts in the size class. (B) Circles represent the total splices from D1 to A1. Shown are proportions that splice again at D2 and those that remainviftranscripts. (C) Circles represent the total splices to A2 and the proportions that splice again at D3 compared to those that remain vprtranscripts. (D) Circles represent all transcripts in size class. Shown are proportions of transcripts that contain either one, both, or no small exons. SX1, small exon 1; SX2, small exon 2.
on November 7, 2019 by guest
http://jvi.asm.org/
[image:12.585.120.288.67.391.2] [image:12.585.49.542.639.709.2]retained in most transcripts: 73.6% in the 1.8-kb class and 84.6% in the 4-kb class (Fig. 10A). Although D0 can splice to acceptors other than A0, it only rarely does so (0.51% in the 1.8-kb class, 0.075% in the 4-kb class). This suggests that activation of D0, unlike D1, is tightly coupled to the use of the proximal splice acceptor A0.
There are some quantification limitations in the SIVmac239 splicing assay due to the limited read length of the MiSeq platform. Although quantification of splicing from D1
FIG 10Quantification of splicing in SIVmac239. (A) Acceptor usage from D0 in the two size classes. Yellow represents the proportion of transcripts that splice from D0 to A0; black represents the proportion of transcripts that splice directly from D0 to an acceptor other than A0; orange represents the transcripts that do not splice from D0 to A0. (B) Acceptor usage from D1 in the two size classes. Circles represent all transcripts in the size class. (C) Circles represent the total splices from D1 to A1. Shown are proportions that splice again at D2 and those that remainviftranscripts. (D) Circles represent the total splices to A2 and the proportions that splice again at D3 compared to those that remainvpxtranscripts. (E) Circles represent the total splices to A6411. Shown are proportions that splice again at D6551 compared to those that remain vpr transcripts. (F) Circles represent all transcripts in the size class. Shown are proportions of transcripts that contain any small exons compared to those that splice directly to the final acceptor.
HIV-1 Splicing with Next-Generation Sequencing Journal of Virology
on November 7, 2019 by guest
http://jvi.asm.org/
[image:13.585.101.306.72.550.2]DISCUSSION
We have developed a new HIV-1 splicing assay that utilizes the MiSeq deep sequencing platform and Primer ID technology to efficiently and accurately quantify HIV-1 splicing. The depth of sequencing data combined with template indexing (Primer ID) makes it possible to identify and quantify even low-abundance variants. This assay is unique in its ability to simultaneously quantify multiple splicing events in HIV-1 RNA transcripts in the context of viral infection with a total of just three primers. It is noteworthy that this assay also works in transfected 293T cells, allowing quantification of mutated viral genomes that are incapable of productive infection. The assay has been used to measure splicing in infected primary T cells and dendritic cells, and the results were comparable to the splicing seen in CEMx174 cells (C. Miller, R. Gummuluru, A. Emery, and R. Swanstrom, unpublished data), validating the cell line model. This is a moderate-throughput assay—24 samples can be multiplexed in a single deep-sequencing reaction—that will allow it to be used to screen and compare the activities of mutations or compounds for their effects on splicing.
It is useful to compare this new assay using the MiSeq platform to previously described assays. Given the complexity of HIV-1 splicing, we will limit this comparison to assays that are capable of capturing most of that complexity, specifically the original RT-PCR/gel sizing assay of Purcell and Martin (2) and the more recent use of the PacBio next-generation sequencing platform described by Ocwieja et al. (3). While the RT-PCR/ gel sizing assay is the simplest, it relies on size for the identification of the splicing events, some of which can comigrate, and has limited sensitivity to detect minor variants. Also, the number of mRNA templates queried is not known, making the procedure prone to PCR skewing. For these reasons, next-generation sequencing platforms offer the opportunity to capture much more information about splicing and represent a natural evolution whereby new technology allows the reexamination of longstanding questions to gain a greater depth of understanding.
The MiSeq assay and the PacBio assay share the features of an initial cDNA synthesis reaction followed by amplification and sequence analysis. MiSeq sequencing is suffi-ciently accurate to allow the use of Primer ID, which allows correction for PCR skewing and determines the number of mRNA templates actually sequenced. PacBio is not yet amenable to Primer ID due to its high level of error, and therefore it is necessary to do endpoint dilution PCR of isolated templates (in droplets) to avoid PCR skewing. However, this system cannot account for the number of mRNA templates that are sequenced, which results in PCR resampling during sequencing. Both systems suffer from the low processivity of RT, which results in an underestimation of splicing events that are detected based on a longer cDNA; in our assay, cDNA products range from about 300 to 1,100 nucleotides. We have focused our assay on the large majority of splicing events that we detected with just three primers; the PacBio assay included the use of more primers, which allowed the detection of an unusual 1-kb size class of spliced RNAs (discussed below).
Within the individual 1.8- and 4-kb size classes, relative transcript abundance is similar in the two assays, but they share two important weaknesses: the inability to quantify the 1.8-kb transcript class relative to the 4-kb transcript class or to quantify
on November 7, 2019 by guest
http://jvi.asm.org/
spliced transcripts versus unspliced transcripts. Size class quantification is a compli-cated problem, as there are no sequences in the 4-kb class of transcripts that are not also present in either the 1.8-kb class and/or unspliced transcripts. Given the inherent, but different, limitations of the MiSeq and PacBio platforms, it has been necessary to add a complementary assay to each data set to obtain a more complete view of viral populations. The PacBio approach has been linked to a transcriptome sequencing (RNA-seq) data set in which oligo(dT)-primed cDNAs of whole-cell RNA are analyzed by short reads over their entire length (3, 39). A feature of using RNA-seq is that the lack of processivity in the cDNA synthesis step by reverse transcriptase requires a correction of observed to calculated frequency of the longer cDNAs (up to 9 kb), making it difficult to measure small differences with confidence. To complement the use of the MiSeq platform, we have explored the use of a random cDNA primer linked to amplification with the same upstream primer just 5=to D1. This allows a comparison of all transcripts, spliced or unspliced. In this analysis, we estimate that about 22% of the spliced transcripts are in the 1.8-kb size class and 78% in the 4-kb size class (unpublished observation). Estimation of the ratio of unspliced to spliced viral RNA appears to be confounded in this system by abortive or incompletely transcribed and processed reads (40, 41), giving a higher-than-expected size of the unspliced population. It is likely that the estimation of the ratio of different size classes and spliced to unspliced will be sensitive to the bias of whatever method is used, in which case it will be important to compare several methods or to focus on the use of a sensitive and reproducible method that allows the detection of differences as experimental conditions are changed.
In its current form, the MiSeq assay relies on just three primers; we have chosen not to include another primer to detect either the direct splice from D1 to A7/nefor to look for the 1-kb spliced RNA size class, although additional primers could be included to capture these events. Regarding direct splicing from D1 to A7/nef, these are splicing events that are part of the canonical splicing program but that occur at a low percentage. Our data obtained with the random reverse primer suggest that D1 to A7 splices represent only about 0.4% of all spliced transcripts. Therefore, we conclude that while not exhaustively inclusive, this new MiSeq assay captures virtually all essential canonical splicing events and can be used to sensitively measure changes in splicing. Similarly, we have chosen not to use an additional primer to probe for the 1-kb spliced RNA. These smaller RNAs have been previously described (42, 43) and were seen with the HIV-189.6isolate but generally thought not to be conserved among isolates (3). We did not detect similar spliced RNAs either in the NL4-3 isolate or in the SIVmac239 isolate using the random reverse primer approach. For this reason, we have chosen not to include another primer (which would require a separate amplification) to detect what appears to be poorly conserved splicing events outside the canonical splicing program. However, the existence of the previously uncharacterized 1-kb RNAs does suggest that using an approach like the random reverse primer would allow a more systematic examination of the question of any as-yet-undetected conserved splicing events, which must exist at a low level if at all.
Using our assay, we quantified splicing patterns in the laboratory strain NL4-3 and observed that usage of splice acceptors A1 and A2 is temperature sensitive. We linked a specific RNA secondary structure, SLSA1, to the efficiency of splicing at its proximal acceptor site (A1). Finally, we used this new assay to analyze splicing in a panel of subtype B transmitted/founder viruses, a subtype C isolate, and an SIVmac isolate and found that splice donor and acceptor sites are well conserved, though frequency of use varied. Following, we discuss observations and issues raised given these very precise measures, based not on the total number of sequence reads but rather on the actual number of mRNA templates sequenced, of relative splice site usage.
We quantified splice acceptor site usage in NL4-3 and found that of the two small exons made by using D2 or D3, D2 usage was consistent in both transcript size classes but D3 (D6551 in SIVmac239) was not: in the 1.8-kb size class most splices to A2 activate splicing from the adjacent D3, but in the 4-kb size class about one-half of the D1-A2
HIV-1 Splicing with Next-Generation Sequencing Journal of Virology
on November 7, 2019 by guest
http://jvi.asm.org/
from D4 (allowing the formation of the 4-kb size class) may also influence the use of the proximal upstream donor site in both HIV-1 and SIV. There are several other examples in which splicing is differentially suppressed in the 4-kb size class that support this notion (see below).
The purpose of the conserved small exons remains to be clearly elucidated. They are conserved across subtypes and in SIVmac239, including for the additionalvpxgene (Fig. 1 and 9) (45, 46), as well as in the T/F viruses analyzed (Fig. 6), consistent with strong selective pressure for their presence. Previously cited studies to define their functional importance are, as mentioned earlier, inconclusive (1, 6–9). It is not clear whether donors D2 and D3 exist to downregulate the amount ofvifandvprmRNAs or if D2 and D3 are required for exon definition (47) to activate A1 and A2, respectively. The transmitted/founder virus isolate 42 with the mutant D3 argues for exon definition, i.e., knockdown of D3 reduced A2 usage, a result that has also been seen in model systems (10, 14, 48); however, in another study with a different HIV-1 isolate, we saw that a reduction in D3 usage led to accumulation ofvprtranscripts (data not shown). Viruses that differ dramatically in their use ofvpr/A2 still produce similar levels ofvprmRNA (Fig. 5A), consistent with the idea that splicing regulation can be accomplished by different mechanisms even for the same site. More work is needed to clarify the roles of D2 and D3 and the purpose of the small exons given their conservation across clades and in at least some nonhuman primate lentiviruses.
There are 62 spliced mRNA species that are well conserved among the different isolates. Given the conservation of these alternative splicing pathways for HIV-1, we were interested in using temperature shifts to probe features of their control and found that the use of A1 and A2 are each, but differentially, sensitive to temperature changes. The differential responses to temperature in the use of A1 and A2 are consistent with suboptimal interactions of these splice acceptor sites with the host cell splicing machinery, but in different ways. It is worth noting that these two splice sites are indirectly downregulated with the high-frequency use of D2 and D3, suggesting that A1 and A2 have been selected to be suboptimal for interactions near the point of instability. A secondary structure proximal to A1 was seen to be critical to splicing based on the observation that two mutations designed to decrease its structural stability reduced splicing in a way that was additive with the effect of temperature (Fig. 5). These data do not rule out the possibility that the mutations affect other features of splicing, such as binding by an unknown factor, and further work is required to fully understand the role of this hairpin in regulating A1 usage. It would also be interesting to use deep-sequencing technologies to see if temperature shifts reveal similar changes among alternative splicing pathways of cellular RNAs.
Our data suggest that the SLSA1 structure is important to A1 usage; other splice acceptors and splice control elements are also located in or near structural features, and many of these regions have been studied for their ability to bind cellular splice factors (49, 50). It will be informative to continue to characterize the roles that these and other structures play in splicing regulation by creating mutations that alter either structure or cellular factor binding sites. One such study has involved the knockdown of the cellular factor heterogeneous nuclear RNP (hnRNP) H1 with the observation that splicing to
on November 7, 2019 by guest
http://jvi.asm.org/
A1/vif is most affected by limiting this factor (S. Kutluay, P. Bieniasz, A. Emery, R. Swanstrom, unpublished data).
As most previous HIV-1 splicing studies have used HIV-1 strain NL4-3 as a model, it is significant that we observed NL4-3 splicing to be comparable to the mean splicing patterns seen in the T/F virus panel and in a subtype C isolate (Fig. 6 and 8). This finding validates the use of NL4-3 in other studies of splicing regulation. In addition, some general conclusions can be drawn from the T/F virus splicing data. Overall, splicing patterns are the same. Acceptors and donors remain constant, but there is surprisingly high variability in their usage. In addition, there are examples of splicing events within a strain that are not conserved between strains, with some examples being the reported 1-kb size class in strain 89.6 (3), the SX0 exon in strain SIVmac239, and greater than 50% tat transcripts in strain NDK (data not shown). The idea that splicing is a tightly regulated and carefully balanced process (1) needs reexamination. The variance in transcripts in these different strains of virus suggests that if a virus meets a threshold level for each transcript type, it can be transmitted and continue to replicate.
Previous studies suggested that cryptic splicing will be activated if/when usage of a regular acceptor is changed or blocked (1, 2, 34, 35). Our data do not support this concept. Cryptic splicing remained negligible across the entire panel of T/F viruses, in spite of functionally important changes in acceptor and donor consensus sequences. In no case was a cryptic donor or acceptor substitute activated above background levels. HIV-1 acceptors have been classified as weak (51, 52), and clearly they diverge from the cellular splicing consensus sequence and branch point rules (1, 53, 54); however, they are still consistently recognized as major splice sites above the background noise. This suggests that many as-yet-unexplained factors contribute to HIV-1 splicing regulation. We found evidence of transsplicing in NL4-3 and all the transmitted/founder viruses. Our assay can detect transsplicing up to a maximum length of four small exons, so the full extent of transsplicing may be greater than what we have seen. The overall frequency of transsplicing was surprisingly high. At a frequency of 0.3% in the 1.8-kb class, total transsplicing occurred more often than several of the canonical spliced transcript types. Transsplicing in HIV-1 has been previously reported (55, 56), though not between HIV-1 RNAs, which we infer must have occurred given the altered order of the exon segments and between transcripts of different proviruses. Whether the cryptic splicing that we observed here has biological significance or is merely a stochastic occurrence between two viral transcripts in close proximity is unknown. By observing transsplicing between transcripts from two different proviruses, we were able to show that this phenomenon occurs beyond a flurry of cotranscriptional splicing between adjacent transcripts. Also, the greater level of transsplicing in the 1.8-kb class than in the 4-kb class provides yet another example in which splicing is partially suppressed in the context of retaining the D4/A7 intron. The effects on suppressing the use of these viral splice donor sequences are reminiscent of the observation that there is a general suppression of splicing (i.e., intron retention) in cellular transcripts during HIV-1 infection (39). One model to explain these phenomena is that binding of the RNA by Rev to move the RNA to the Crm1 export pathway may suppress proximal splice donor activation and that Rev may fortuitously bind to some cellular pre-RNAs.
In conclusion, developments in deep-sequencing technology now make it possible to quantify the complexity of HIV-1 splicing in depth and to study the effectors of splicing with greater precision than previously possible. Here we report some examples of its utility and suggest potential uses in further studies.
MATERIALS AND METHODS
Viruses.A panel of full-length transmitted/founder (T/F) HIV-1 infectious molecular clones was obtained through the NIH AIDS Reagent Program, Division of AIDS, NIAID, NIH, from John Kappes (31–33, 57). Clones are identified by the last two digits of their identification number. The infectious clone pNL4-3 was obtained through the NIH AIDS Reagent Program, Division of AIDS, NIAID, NIH, from Malcolm Martin (30), and the SLSA1 mutant virus was made as described by Pollom et al. (22). Virus was produced by transfecting 293T cells using 4g of a viral DNA clone/well of a 6-well plate for the SLSA1 experiment and 1g/well for the T/F viruses, using FuGene (Promega) transfection reagent as per the FuGene protocol database. At 48 h after transfection, the medium was removed and filtered through a 45-m
HIV-1 Splicing with Next-Generation Sequencing Journal of Virology
on November 7, 2019 by guest
http://jvi.asm.org/
filter and then frozen in aliquots at⫺80°C for later use. pZM247Fv2 was obtained through the NIH AIDS Reagent Program, Division of AIDS, NIAID, NIH, from Beatrice Hahn (57). A partialenvdeletion of this clone, pZM247v2Δenv, was obtained from Sarah Joseph. VSV G-pseudotyped pZM247v2Δenv virus was produced by cotransfecting 293T cells with 5g each of the pZM247v2Δenv plasmid and a VSV G expression plasmid in a T75 flask, as per the FuGene protocol database, and harvested and filtered as described above. A molecular clone of SIVmac239 was obtained from Ronald Desrosiers (58) and used to produce virus by transfection.
Cells.CEMx174 cells were used for HIV-1 infections. Cells were cultured in RPMI plus 10% fetal bovine serum (FBS) with added penicillin and streptomycin. For the SLSA1 mutant/temperature gradient experiment, 2⫻106cells were pelleted and resuspended in 800l of medium with either the SLSA1 or
NL4-3 virus, incubated for 45 min, and then brought to a total volume of 50 ml of RPMI with FBS. The cells were then incubated at 37°C for 4 days, until syncytia were evident. An aliquot of 10 ml of each culture (with cells) was put into each of 3 flasks and incubated for 6 h at 33°C, 37°C, or 41°C, and then the cells were harvested for RNA extraction. The T/F virus molecular clones were transfected into 293T cells plated the day before at 5 ⫻ 105 cells/well of a six-well plate. Cells were harvested 48 h
posttransfection for RNA extraction. 8E5 cells (8E5 cells were obtained through the NIH AIDS Reagent Program, Division of AIDS, NIAID, NIH, 8E5/LAV, from Thomas Folks [59]), a clonal cell line producing virus from a single defective provirus, were superinfected with VSV G-pseudotyped subtype C pZM247v2Δenv virus. A total of 5 ⫻ 107 8E5 cells were pelleted and resuspended in 40 ml of medium with the
pseudotyped virus, and aliquots were harvested between 1 and 3 days postsuperinfection.
RNA extraction, cDNA synthesis, and Illumina MiSeq library preparation.Total cellular RNA was extracted using the RNeasy Plus minikit (Qiagen), with the QIAshredder to homogenize cell lysates (Qiagen) and including 1%-mercaptoethanol in the lysis buffer. Primers used for cDNA synthesis for NL4-3 and 8E5 cells, the T/F strains, pZM247v2Δenv, and SIVmac239 are shown in Tables 1 and 2. All primers were resuspended at a concentration of 10 mM. Indexed primers were obtained from Integrated
T/F 1.8-kb reverse primers
idx_18_43 GTGACTGGAGTTCAGACGTGTGCTCTTCCGATCT(N⫻14)TCCCCTCTGGGCTGGGGGGCGGATTGC idx_18_44 GTGACTGGAGTTCAGACGTGTGCTCTTCCGATCT(N⫻14)TCGGGGCTGGGAAGCGGGTTGC idx_18_45 GTGACTGGAGTTCAGACGTGTGCTCTTCCGATCT(N⫻14)TCGGGGCTGGGAGGCGGGTTGC T/F forward primers
lidx_fp_I GCCTCCCTCGCGCCATCAGAGATGTGTATAAGAGACAG(N⫻14)TGCTGAAGCGCGCACGGCAAG TF_42_fp GCCTCCCTCGCGCCATCAGAGATGTGTATAAGAGACAG(N⫻14)TGCTGAAGCGCGCACAGCAAG TF_47_fp GCCTCCCTCGCGCCATCAGAGATGTGTATAAGAGACAG(N⫻14)TGCTGAAGCGCGCGCGGCAAG Subtype C pZM247Fv2
idx_C3_4rp GTGACTGGAGTTCAGACGTGTGCTCTTCCGATCT(N⫻14)TTCAAGCATTACATCTACTATTTGGTACTTAC idx_C3_18rp GTGACTGGAGTTCAGACGTGTGCTCTTCCGATCT(N⫻14)TCGGGTCCCCTCGAGTTTGGGATAAGGGTTGC idx_C3_fp GCCTCCCTCGCGCCATCAGAGATGTGTATAAGAGACAGNNNNTGCTGAAGTGCACGCAGCAAG SIVmac239
SIV_f_DO GCCTCCCTCGCGCCATCAGAGATGTGTATAAGAGACAGNNNNGCCCTGGGAGGTTCTCTCCA SIV_f_D1 GCCTCCCTCGCGCCATCAGAGATGTGTATAAGAGACAGNNNNAGGAAGAGGCCTCCGGTTGCA SIV_rp_18 GTGACTGGAGTTCAGACGTGTGCTCTTCCGATCT(N⫻14)CGGGTCCTGTTGGATATGGGTTTG SIV_rp_4k GTGACTGGAGTTCAGACGTGTGCTCTTCCGATCT(N⫻14)ATTCCCAAGACATCCCATACTTAC Random reverse
uni_rp GTGACTGGAGTTCAGACGTGTGCTCTTCCGATCT(N⫻14) Illumina library
UniAdpt AATGATACGGCGACCACCGAGATCTACACGCCTCCCTCGCGCCATCAGAGATGTG IllIndAdpt CAAGCAGAAGACGGCATACGAGATNNNNNNGTGACTGGAGTTCAGACGTGTGCTC ADPT_2a GTGACTGGAGTTCAGACGTGTGCTC
on November 7, 2019 by guest
http://jvi.asm.org/
[image:18.585.42.534.75.480.2]DNA Technologies Custom Oligos, with hand mixing to optimize random base incorporation. For the SLSA1 and temperature experiments, 2g of total cellular RNA from each sample was mixed with 1l of 10 mM deoxynucleoside triphosphates (dNTPs), 0.5l of the indicated reverse primer, and distilled water (dH2O) to 13l. The samples were heated to 65°C for 5 min and then held at 4°C. To each tube
was added 1l of 0.1 M dithiothreitol, 1l RNaseOUT (ThermoFisher), 4l of 5⫻SuperScript III RT buffer, and 1l SuperScript III Reverse Transcriptase (ThermoFisher), and then the tubes were heated to 55°C for 1 h followed by 70°C for 15 min. An aliquot of 1l RNase H (ThermoFisher) was added to each sample, which was then incubated at 37°C for 20 min. cDNA synthesis for the T/F virus samples and SIVmac239 was the same, except that 4g of total cellular RNA was used. cDNA synthesis for the pZM247v2Δenv-infected 8E5 cells was done using two reverse primers for each size class, one specific to the 8E5 virus (the NL4-3 primers) and one specific to the pZM247Fv2 virus. cDNAs were purified, and the Primer ID cDNA primer was removed using Agencourt RNAClean XP beads (Beckman Coulter) as per the protocol with a 2:1 ratio of beads to sample volume. Illumina libraries for the SLSA1 mutant and temperature gradient samples, VSV G-pseudotyped pZM247v2Δenv, and SIVmac239 were made using two successive rounds of PCR amplification. For the first PCR, 1g cDNA template, 1l dNTPs, 2.5l ADPT_2a reverse primer, 2.5l idx_fp forward primer, 0.4l KAPA Robust Hot Start Polymerase (KAPA Biosystems), 7.5% dimethyl sulfoxide (DMSO), 10l KAPA A buffer, 10l KAPA Enhancer 1, and dH2O to 50l were
combined and cycled with an initial denaturation at 95°C for 5 min, followed by 3 cycles each consisting of 95°C for 30 s, progressively decreasing annealing temperatures of 64°C, 61°C, 58°C, 55°C, and 52°C for 15 s, and 72°C for 2 min, and then 5 more cycles with an annealing temperature at 50°C. The final extension was at 72°C for 10 min. PCR products were purified and primers removed using AMPure XP Beads (Beckman Coulter) as per the protocol, using a 1.6:1 ratio of beads/PCR volume. An aliquot of 3l of the cleaned product from this first PCR was used as the template for the second PCR, added to 10l KAPA A buffer, 1l dNTPs, 2.5l UniAdpt forward primer, 2.5l IllIndAdpt forward primer, 0.4l KAPA Robust Hot Start Polymerase, 5% DMSO, 10l KAPA Enhancer 1, and dH2O to 50l. Cycling conditions
were as for the first PCR but with annealing temperatures of 66°C, 63°C, and 60°C each for 3 cycles, followed by 25 cycles with an annealing temperature of 58°C. “N”s in the IllIndAdpt forward primer are specific sequences that bar code each sample to allow multiplexing in the Illumina sequencing reaction. PCR products were visualized on a 2% agarose gel and then cleaned as before using AMPure XP Beads. For T/F virus samples, 4g of total cellular RNA was used as input to the cDNA reaction mixtures as described above. cDNAs were forward tagged as follows. Samples containing an aliquot of 1g of purified cDNA, 0.5l forward primer lidx_fp_I (or the appropriate sample-specific forward primer), 1l dNTPs, and dH2O to 14.8l were heated to 75°C and then cooled in 1°C increments for 30 s until
reaching 45°C. To each sample were added 0.2l Phusion HF, 4l Phusion 5⫻buffer, and 1l DMSO. Samples were then heated to 45°C, and the temperature was increased in 1-degree increments every 10 s until reaching 72°C, where it was held for 10 min. Following forward tagging, the samples were purified using DNA XP beads as described above but eluted in 23l. An aliquot of 21.1l of the purified tagged forward strand was input into a second PCR mixture as above, with the following cycle changes: initial denaturation at 95°C for 5 min; then, 3 times each touchdown cycle using progressively cooler annealing temperatures, 95°C for 30 s, annealing at 64°C, 61°C, 58°C, 55°C, and 52°C for 15 s, extension for 2 min at 72°C; then, 20 cycles with annealing temperature at 50°C; and a final extension at 72°C for 10 min.
Sequencing.Libraries were mixed/multiplexed and sequenced using the 300-base paired-end read Illumina Miseq platform. Reads were sorted using the Illumina bcl2fastq pipeline (v.1.8.4) to separate the multiplexed samples. All samples were loaded at a concentration of 8 pM with 15% PhiX double-stranded DNA fragments to optimize cluster formation. Because of quality control features that are intrinsic to each sequencing run, comparisons of relative abundance of spliced RNAs between samples are most reliably accomplished when the samples are multiplexed in the same sequencing run.
[image:19.585.40.376.82.204.2]Splicing analysis.Data analysis and splicing quantification were done using an in-house pipeline written in Ruby. Using the combined data from the forward and reverse reads, this program identifies the specific splice variant for each paired-end read and bins the reads by Primer ID to prevent skewing from PCR resampling. The same sorting program was used for both SLSA1 mutant and temperature gradient experiments. Separate programs were adapted to the specific primers and sequence of each T/F virus, as well as for pZM247Fv2 and SIVmac239. Rare alternative donor and acceptor splice sites were identified using a program that compares data reads to a reference sequence and identifies the base where a splice TABLE 2Primers used for each sample
Sample type or ID no. Forward primer Reverse 1.8-kb primer Reverse 4-kb primer
SLSA1 and temp expt idx_fp idx_1.8rp idx_4rp T/F NL4-3 lidx_fp_I l_idx_1.8r l_idx_4r 40 lidx_fp_I l_idx_1.8r l_idx_39r 42 TF_42_fp l_idx_1.8r l_idx_42r 43 lidx_fp_I idx_18_43 l_idx_43r 44 lidx_fp_I idx_18_44 l_idx_4r 45 lidx_fp_I idx_18_45 l_idx_4r 46 lidx_fp_I l_idx_1.8r l_idx_46r 47 TF_47_fp l_idx_1.8r l_idx_4r 48 lidx_fp_I idx_18_45 l_idx_48r 56 lidx_fp_I idx_18_45 l_idx_39r
HIV-1 Splicing with Next-Generation Sequencing Journal of Virology
on November 7, 2019 by guest
http://jvi.asm.org/
This work was supported by NIH grants P50 GM103297 (the Center for HIV RNA Studies), F31 AI116406 (to A.E.), and R37 AI44667 (to R.S.). The work was also supported by the UNC Center for AIDS Research (NIH award P30 AI50410) and the UNC Lineberger Comprehensive Cancer Center (NIH award P30 CA16068).
REFERENCES
1. Stoltzfus CM. 2009. Chapter 1. Regulation of HIV-1 alternative RNA splicing and its role in virus replication. Adv Virus Res 74:1– 40.https:// doi.org/10.1016/S0065-3527(09)74001-1.
2. Purcell DF, Martin MA. 1993. Alternative splicing of human immunode-ficiency virus type 1 mRNA modulates viral protein expression, replica-tion, and infectivity. J Virol 67:6365– 6378.
3. Ocwieja KE, Sherrill-Mix S, Mukherjee R, Custers-Allen R, David P, Brown M, Wang S, Link DR, Olson J, Travers K, Schadt E, Bushman FD. 2012. Dynamic regulation of HIV-1 mRNA populations analyzed by single-molecule enrichment and long-read sequencing. Nucleic Acids Res 40: 10345–10355.https://doi.org/10.1093/nar/gks753.
4. Cullen BR, Greene WC. 1990. Functions of the auxiliary gene products of the human immunodeficiency virus type 1. Virology 178:1–5.https:// doi.org/10.1016/0042-6822(90)90373-Y.
5. Fischer U, Huber J, Boelens WC, Mattaj IW, Luhrmann R. 1995. The HIV-1 Rev activation domain is a nuclear export signal that accesses an export pathway used by specific cellular RNAs. Cell 82:475– 483.https://doi.org/ 10.1016/0092-8674(95)90436-0.
6. Chang DD, Sharp PA. 1989. Regulation by HIV Rev depends upon recognition of splice sites. Cell 59:789 –795.https://doi.org/10.1016/0092 -8674(89)90602-8.
7. Krummheuer J, Lenz C, Kammler S, Scheid A, Schaal H. 2001. Influence of the small leader exons 2 and 3 on human immunodeficiency virus type 1 gene expression. Virology 286:276 –289. https://doi.org/10.1006/ viro.2001.0974.
8. Schwartz S, Felber BK, Benko DM, Fenyo EM, Pavlakis GN. 1990. Cloning and functional analysis of multiply spliced mRNA species of human immunodeficiency virus type 1. J Virol 64:2519 –2529.
9. Muesing MA, Smith DH, Capon DJ. 1987. Regulation of mRNA accumu-lation by a human immunodeficiency virus transactivator protein. Cell 48:691–701.https://doi.org/10.1016/0092-8674(87)90247-9.
10. Madsen JM, Stoltzfus CM. 2005. An exonic splicing silencer downstream of the 3=splice site A2 is required for efficient human immunodeficiency virus type 1 replication. J Virol 79:10478 –10486.https://doi.org/10.1128/ JVI.79.16.10478-10486.2005.
11. Amendt BA, Hesslein D, Chang LJ, Stoltzfus CM. 1994. Presence of negative and positive cis-acting RNA splicing elements within and flank-ing the first tat codflank-ing exon of human immunodeficiency virus type 1. Mol Cell Biol 14:3960 –3970.https://doi.org/10.1128/MCB.14.6.3960. 12. Amendt BA, Si ZH, Stoltzfus CM. 1995. Presence of exon splicing silencers
within human immunodeficiency virus type 1 tat exon 2 and tat-rev exon 3: evidence for inhibition mediated by cellular factors. Mol Cell Biol 15:4606 – 4615.https://doi.org/10.1128/MCB.15.8.4606.
13. Asang C, Hauber I, Schaal H. 2008. Insights into the selective activation of alternatively used splice acceptors by the human immunodeficiency virus type-1 bidirectional splicing enhancer. Nucleic Acids Res 36: 1450 –1463.https://doi.org/10.1093/nar/gkm1147.
14. Bilodeau PS, Domsic JK, Mayeda A, Krainer AR, Stoltzfus CM. 2001. RNA splicing at human immunodeficiency virus type 1 3= splice site A2 is regulated by binding of hnRNP A/B proteins to an exonic splicing silencer
element. J Virol 75:8487– 8497.https://doi.org/10.1128/JVI.75.18.8487-8497. 2001.
15. O’Reilly MM, McNally MT, Beemon KL. 1995. Two strong 5=splice sites and competing, suboptimal 3=splice sites involved in alternative splic-ing of human immunodeficiency virus type 1 RNA. Virology 213: 373–385.https://doi.org/10.1006/viro.1995.0010.
16. Delgado E, Carrera C, Nebreda P, Fernandez-Garcia A, Pinilla M, Garcia V, Perez-Alvarez L, Thomson MM. 2012. Identification of new splice sites used for generation of rev transcripts in human immunodeficiency virus type 1 subtype C primary isolates. PLoS One 7:e30574.https://doi.org/ 10.1371/journal.pone.0030574.
17. Jabara CB, Jones CD, Roach J, Anderson JA, Swanstrom R. 2011. Accurate sampling and deep sequencing of the HIV-1 protease gene using a Primer ID. Proc Natl Acad Sci U S A 108:20166 –20171.https://doi.org/ 10.1073/pnas.1110064108.
18. Bohne J, Wodrich H, Krausslich HG. 2005. Splicing of human immuno-deficiency virus RNA is position-dependent suggesting sequential re-moval of introns from the 5=end. Nucleic Acids Res 33:825– 837.https:// doi.org/10.1093/nar/gki185.
19. Jain N, Morgan CE, Rife BD, Salemi M, Tolbert BS. 2016. Solution structure of the HIV-1 intron splicing silencer and its interactions with the UP1 domain of heterogeneous nuclear ribonucleoprotein (hnRNP) A1. J Biol Chem 291:2331–2344.https://doi.org/10.1074/jbc.M115.674564. 20. Ajamian L, Abrahamyan L, Milev M, Ivanov PV, Kulozik AE, Gehring NH,
Mouland AJ. 2008. Unexpected roles for UPF1 in HIV-1 RNA metabolism and translation. RNA 14:914 –927.https://doi.org/10.1261/rna.829208. 21. Rollins C, Levengood JD, Rife BD, Salemi M, Tolbert BS. 2014.
Thermo-dynamic and phylogenetic insights into hnRNP A1 recognition of the HIV-1 exon splicing silencer 3 element. Biochemistry 53:2172–2184.
https://doi.org/10.1021/bi500180p.
22. Pollom E, Dang KK, Potter EL, Gorelick RJ, Burch CL, Weeks KM, Swan-strom R. 2013. Comparison of SIV and HIV-1 genomic RNA structures reveals impact of sequence evolution on conserved and non-conserved structural motifs. PLoS Pathog 9:e1003294. https://doi.org/10.1371/ journal.ppat.1003294.
23. Watts JM, Dang KK, Gorelick RJ, Leonard CW, Bess JW, Jr, Swanstrom R, Burch CL, Weeks KM. 2009. Architecture and secondary structure of an entire HIV-1 RNA genome. Nature 460:711–716.https://doi.org/10.1038/ nature08237.
24. Lu K, Heng X, Garyu L, Monti S, Garcia EL, Kharytonchyk S, Dorjsuren B, Kulandaivel G, Jones S, Hiremath A, Divakaruni SS, LaCotti C, Barton S, Tummillo D, Hosic A, Edme K, Albrecht S, Telesnitsky A, Summers MF. 2011. NMR detection of structures in the HIV-1 5=-leader RNA that regulate genome packaging. Science 334:242–245. https://doi.org/ 10.1126/science.1210460.
25. Keane SC, Heng X, Lu K, Kharytonchyk S, Ramakrishnan V, Carter G, Barton S, Hosic A, Florwick A, Santos J, Bolden NC, McCowin S, Case DA, Johnson BA, Salemi M, Telesnitsky A, Summers MF. 2015. RNA structure. Structure of the HIV-1 RNA packaging signal. Science 348:917–921. 26. Levengood JD, Rollins C, Mishler CH, Johnson CA, Miner G, Rajan P, Znosko