City, University of London Institutional Repository
Citation
:
Andrienko, G., Andrienko, N., Budziak, G., Von Landesberger, T. & Weber, H.
(2016). Coordinate transformations for characterization and cluster analysis of spatial
configurations in football. Lecture Notes in Computer Science (including subseries Lecture
Notes in Artificial Intelligence and Lecture Notes in Bioinformatics), 9853, pp. 27-31. doi:
10.1007/978-3-319-46131-1_6
This is the accepted version of the paper.
This version of the publication may differ from the final published
version.
Permanent repository link:
http://openaccess.city.ac.uk/15469/
Link to published version
:
http://dx.doi.org/10.1007/978-3-319-46131-1_6
Copyright and reuse:
City Research Online aims to make research
outputs of City, University of London available to a wider audience.
Copyright and Moral Rights remain with the author(s) and/or copyright
holders. URLs from City Research Online may be freely distributed and
linked to.
City Research Online:
http://openaccess.city.ac.uk/
publications@city.ac.uk
adfa, p. 1, 2011.
© Springer-Verlag Berlin Heidelberg 2011
Coordinate transformations for characterization and
cluster analysis of spatial configurations in football
Gennady Andrienko1, Natalia Andrienko1, Guido Budziak2, Tatiana von Landesberger3, Hendrik Weber4
1
Fraunhofer Institute IAIS, Sankt Augustin, Germany and City University London, UK {gennady|natalia}.andrienko@iais.fraunhofer.de
2
TU Eindhoven, the Netherlands
3
TU Darmstadt, Germany
4
DFL Deutsche Fussball Liga GmbH, Germany
Abstract. Current technologies allow movements of the players and the ball in football matches to be tracked and recorded with high accuracy and temporal frequency. We demonstrate an approach to analyzing football data with the aim to find typical patterns of spatial arrangement of the field players. It involves transformation of original coordinates to relative positions of the players and the ball with respect to the center and attack vector of each team. From these relative positions, we derive features for characterizing spatial configurations in different time steps during a football game. We apply clustering to these fea-tures, which groups the spatial configurations by similarity. By summarizing groups of similar configurations, we obtain representation of spatial arrange-ment patterns practiced by each team. The patterns are represented visually by density maps built in the teams’ relative coordinate systems. Using additional displays, we can investigate under what conditions each pattern was applied.
1
Introduction
Current tracking technologies enable measuring and recording of the spatial positions and movements of the players and the ball in football (a.k.a. soccer) games with high accuracy and temporal frequency. Analysis of the resulting trajectories can bring val-uable knowledge about the movement behaviors of the players and teams and interac-tions between the players and between the teams. A lot of research has been done on analyzing various aspects of a football game, such as players’ performance (e.g. [4]), passes (e.g. [3]) and pass opportunities (e.g. [5]), team formations (e.g. [2]), and oth-ers. Analysis of formations mostly focuses on identifying long- and short-term roles of individual players [2] or typical geometric configurations of tactical groups [6].
2
Characterization and analysis of spatial configurations
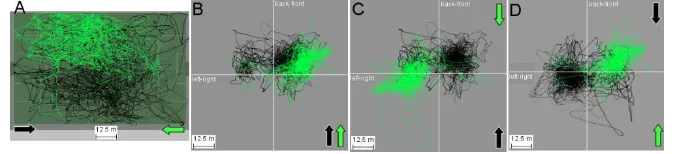
[image:3.595.129.467.324.401.2]We use the term spatial configuration for the relative arrangement of the field players in one time moment. A spatial configuration can be characterized by the coordinates of the players in “team spaces”. The team space of one team is defined in each mo-ment by the team centroid (i.e., the mean position of all field players of this team) and the direction towards the opponents’ goal (attack direction). The team centroid is taken as the origin of the coordinates. The vertical axis of the team space corresponds to the attack direction, and the horizontal axis is perpendicular to it. Such coordinate system is created for each team. For each moment of the game, the positions of the players of both teams and the positions of the ball are transformed to the coordinate system of each team. The horizontal coordinate shows the relative position in the left or right side of the team, and the vertical coordinate shows the relative position in the back or front side of the team.
Fig. 1. Transformation of coordinates is shown by example of trajectories of two players from opposing teams. A: original trajectories in the space of the pitch; B, C, D: the trajectories
trans-formed to the spaces of the own teams (B), black team (C) and green team (D).
The transformation is illustrated in Fig. 1 by example of trajectories of two players from opposing teams (black and green). Fig. 1A shows the original trajectories in the space of the pitch. The goal of the black team is on the left and the goal of the green team is on the right. The attack directions of the teams are indicated by colored ar-rows at the bottom of the image. In Fig.1B, the trajectories are composed from the relative positions of the players in their own teams. The image represents simultane-ously the spaces of both teams, i.e., their coordinate systems are aligned. We see that, despite quite strong separation of the two trajectories in the field space (Fig. 1A), they cover similar regions in their team spaces, i.e., they have similar roles in their teams. Image 1C represents the space of the black team. The green trajectory shows how the green team player was positioned in relation to the opponent team. Likewise, image 1D represents the space of the green team and the positioning of the black team player with respect to the opponents.
of players and changes of players’ roles, we apply ordering from left to right when the vertical difference is below a threshold (e.g., 2 meters).
The full feature vector of a spatial configuration consists of the coordinates of the field players of each team in their own team space and in the team space of the oppo-nents plus the coordinates of the ball in the spaces of both teams. On demand, a subset of features can be used for clustering, e.g., features of only one team.
By summarizing the clusters of spatial configurations produced by a clustering al-gorithm (e.g., k-means or EM), we obtain a representation of typical spatial arrange-ment patterns. Since each spatial configuration is basically a set of points (which rep-resent players’ positions), we summarize a cluster of configurations by computing joint point density fields in the team and field spaces using kernel density estimation.
In the demonstration, we show interactive clustering of spatial configurations and visual exploration of spatial arrangement patterns supported by interactive tools.
3
Example
In this example, we use data collected during the German Bundesliga game of Borus-sia Dortmund against VfL Wolfsburg on 10/12/2015. Our analysis focus is the ar-rangement patterns of the field players of Dortmund in relation to the opponents. For clustering, we use a subset of features consisting of the relative positions of the Dort-mund’s players in the space of Wolfsburg. Figure 2 shows the results for k-means clustering with k=8. The density maps represent the Dortmund’s configuration pat-terns in the Wolfsburg’s team space. Here we use a color scale from light blue for low densities to red for high densities. The movements of the ball during the times when the configurations took place are represented by semi-transparent black lines.
[image:4.595.138.459.462.603.2]
Fig. 2. Density maps represent clustered arrangements of the players of Dortmund in relation to the opponent team (i.e., in the team space of Wolfsburg).
(black). The uppermost pair of bars correspond to the whole game, excluding the time when the ball was out of play. The remaining rows correspond to the clusters of the spatial configurations. We see that the pattern of cluster 1 was used almost exclusive-ly under ball possession by Dortmund, whereas the patterns of clusters 5 and 6 were mostly applied under ball possession by Wolfsburg. The remaining patterns are not so clearly related to the ball possession by either of the teams. In Fig. 4, we see how the patterns are related to the positions of the Dortmund’s players and the ball in the field.
[image:5.595.177.427.237.308.2]
Fig. 3. Distribution of the time moments with ball possession by VfL Wolfsburg (green) and Borussia Dortmund (black) across the clusters of the spatial configurations.
Fig. 4. Relation of the configuration patterns to the players’ positions in the field.
References
1. N. Andrienko, G. Andrienko, L. Barrett, M. Dostie, P. Henzi. Space Transformation for Understanding Group Movement. IEEE Transactions on Visualization and Computer Graphics, 19(12): 2169-2178, Dec. 2013
2. A. Bialkowski, P. Lucey, P. Carr, Y. Yue, S. Sridharan, and I. A. Matthews. Large-scale analysis of soccer matches using spatiotemporal tracking data. In: IEEE ICDM 2014 (Int. Conf. on Data Mining), pp. 725-730, IEEE, 2014.
3. P. Cintia, S. Rinzivillo, L. Pappalardo. A network-based approach to evaluate the perfor-mance of football teams. In: Machine Learning and Data Mining for Sports Analytics Workshop, Porto, Portugal, 2015.
4. V. Di Salvo, R. Baron, H. Tschan, F. Calderon Montero, N. Bachl, and F. Pigozzi. Perfor-mance characteristics according to playing position in elite soccer. International Journal of Sports Medicine, 28(3): 222-227, 2007.
5. J. Gudmundsson and T. Wolle. Football analysis using spatio-temporal tools. Computers, Environment and Urban Systems, 47: 16-27, 2014.
[image:5.595.126.471.345.456.2]