City, University of London Institutional Repository
Citation
:
Lavelle, F., McGowan, L., Hollywood, L., Surgenor, D., McCloat, A., Mooney, E.,
Caraher, M., Raats, M. & Dean, M. (2017). The development and validation of measures to
assess cooking skills and food skills. International Journal of Behavioral Nutrition and
Physical Activity, 14(1), 118.. doi: 10.1186/s12966-017-0575-y
This is the published version of the paper.
This version of the publication may differ from the final published
version.
Permanent repository link:
http://openaccess.city.ac.uk/18189/
Link to published version
:
http://dx.doi.org/10.1186/s12966-017-0575-y
Copyright and reuse:
City Research Online aims to make research
outputs of City, University of London available to a wider audience.
Copyright and Moral Rights remain with the author(s) and/or copyright
holders. URLs from City Research Online may be freely distributed and
linked to.
R E S E A R C H
Open Access
The development and validation of
measures to assess cooking skills and
food skills
Fiona Lavelle
1, Laura McGowan
2, Lynsey Hollywood
3, Dawn Surgenor
3, Amanda McCloat
4, Elaine Mooney
4,
Martin Caraher
5, Monique Raats
6and Moira Dean
1*Abstract
Background:With the increase use of convenience food and eating outside the home environment being linked to the obesity epidemic, the need to assess and monitor individuals cooking and food skills is key to help intervene where necessary to promote the usage of these skills. Therefore, this research aimed to develop and validate a measure for cooking skills and one for food skills, that are clearly described, relatable, user-friendly, suitable for different types of studies, and applicable across all sociodemographic levels.
Methods:Two measures were developed in light of the literature and expert opinion and piloted for clarity and ease of use. Following this, four studies were undertaken across different cohorts (including a sample of students, both‘Food preparation novices’and‘Experienced food preparers’, and a nationally representative sample) to assess temporal stability, psychometrics, internal consistency reliability and construct validity of both measures. Analysis included T-tests, Pearson’s correlations, factor analysis, and Cronbach’s alphas, with a significance level of 0.05. Results:Both measures were found to have a significant level of temporal stability (P< 0.001). Factor analysis revealed three factors with eigenvalues over 1, with two items in a third factor outside the two suggested measures. The internal consistency reliability for the cooking skills confidence measure ranged from 0.78 to 0.93 across all cohorts. The food skills confidence measure’s Cronbach’s alpha’s ranged from 0.85 to 0.94. The two measures also showed a high discriminate validity as there were significant differences (P< 0.05 for cooking skills confidence andP< 0.01 for food skills confidence) between Food preparation novices’and‘Experienced food preparers.’
Conclusions:The cooking skills confidence measure and the food skills confidence measure have been shown to have a very satisfactory reliability, validity and are consistent over time. Their user-friendly applicability make both measures highly suitable for large scale cross-sectional, longitudinal and intervention studies to assess or monitor cooking and food skills levels and confidence.
Keywords:Cooking skills, Food skills, Development, Validation, Cross-sectional, Intervention, Measure, Obesity
* Correspondence:moira.dean@qub.ac.uk
1Institute for Global Food Security, School of Biological Sciences, Queen’s
University Belfast, Belfast BT9 5AG, UK
Full list of author information is available at the end of the article
Background
The consumption of food prepared in the home environ-ment has been associated with an improved diet quality and better weight control [1, 2]. As obesity is increas-ingly becoming a worldwide epidemic, any methods that can contribute to its reduction must be considered and all measures should be taken to help their implementa-tion. The promotion and increase of home meal prepar-ation is one strategy in a multidisciplinary approach to tackling this issue [3], however, a culinary transition has been reported within the literature [4]. This transition explores the possibility that individuals may not have the necessary skill level to prepare a meal [5, 6]. In addition, numerous other barriers have been proposed for home meal preparation and cooking from scratch including; lack of time (real and perceived), perceived affordability of healthy foods versus convenience products, longer working hours, a dislike for cooking or the effect of negative previous experiences, enjoying eating out and take-away foods, accessibility and considering it too much effort [7–10]. In a possible attempt to overcome this lack of skills or as a means to facilitate the con-sumption of food without cooking, the use of conveni-ence and processed food has increased, thereby reducing the need for cooking skills. The increase in the use of these products may in fact contribute to the obesity epidemic as these products are typically high in fats and sugars [11–14]. In light of this, there is a need to assess the level of cooking skills within the popula-tion, and intervene where necessary.
Cooking skills have been defined as a set of physical or mechanical skills used in the production of a meal encompassing cooking methods (e.g. boiling) and food preparation techniques (e.g. peeling a vegetable), in addition to this they are also said to include conceptual and perceptual skills such as understanding the trans-formation food undergoes when heat is applied, i.e. knowing that chicken is fully cooked from its colour [15, 16]. Aside from the cooking skills needed to pre-pare a meal, there is a wider set of skills involved in the entirety of the meal preparation process known as Food skills [17, 18]. Food skills include the knowledge and skills to be able to select and prepare food with the available resources, to produce a nutritionally balanced, age appropriate and satisfying meals for those that are consuming it, this includes meal planning, shopping, budgeting, resourcefulness, and label reading [17, 19]. These skills are essential to prepare a meal in the home environment [17].
While some measures for cooking and food skills currently exist, they have some limitations. A key issue is that food skills tend to be encompassed in existing measures and not considered as a stand-alone set of skills and therefore all necessary elements may not be
included [20]. Other limitations of previous measures include: the specific mention of certain foods which may not be transferable to all cultures, developed for specific intervention groups, and not having succinct definitions of the skills being measured [20, 21]. Some of the measures also had issues with their validations including using mainly female samples, small sample sizes, test-retest biased sample, self-selection bias and highly educated samples [21, 22].
In recognition of these limitations, the current research aimed to develop and validate two separate measures (one for cooking skills and one for food skills) that are clearly described, relatable, user-friendly, suitable for different types of studies, and applicable across all sociodemographic levels.
Methods
Tool construction
A review of cooking related literature was undertaken prior to tool development. This focused on the relation-ships between cooking and food skills and their impact on the healthiness of diets (for more details see [23]). The results of the critical appraisal of these articles in combination with the results from Safefood’s publication regarding food skills [24] underpinned the development of the measures. In addition, four semi-structured qualitative interviews with experts working in the area of health promotion including cooking and food skills interventions and education were conducted to validate the literature findings and to investigate whether anything missing from the literature that needed to be included. All experts had an undergraduate degree in Home Economics with either a masters or PhD in Home Economics, Nutrition, Food Science or related discipline. The interviews questioned areas such as diet quality influ-encers, the role of cooking and food skills on diet and their perceptions on what encompasses cooking and food skills. A template analysis (a form of thematic analysis used in qualitative research, emphasising the use of hier-archical coding and the development of a coding template that is continuously refined [25]) was used to assess the relevant information for the measures and the overall sur-vey, including the need for clear terminology.
poor and 7 means very good, please say how good you are at… [substitute each one they stated they used in previous question],” and only the skills that were previ-ously stated as in use are rated and this creates the con-fidence measure. The concon-fidence score is the sum of the 1 to 7 ratings for the skills that were stated as used. This process is repeated for both the cooking skills and food skills measures. If a skill is not used, it is scored a zero for that skill. There is also no classification of the confi-dence measures. For the paper and pen presentation, the participant is asked to “say how good you are at each task on a scale of 1-7, where 1 is very poor and 7 very good,” with a ‘Never/rarely do it’ option also given. The scoring of the measure is the same as the CAPI, where the confidence measure is a sum of the ratings of the items and a zero if a participant ticked that they‘Never/ rarely did it.’
[image:4.595.58.290.104.473.2]The data for the present research was collected as part of the‘Impact of cooking and related food skills on the healthiness of diets’ project, a research project car-ried out on the island of Ireland (IOI) and funded by Safefood Ireland, The Food Safety Promotion Board. Ethical approval for this research was received from Queen’s University Belfast Research Ethics Committee and each study was conducted in line with the guidance given in the Declaration of Helsinki. Participants con-sented to partake in the research and were aware they could remove themselves at any point. The measures were included in a larger survey assessing diet quality, psychological components, and demographic details (further information on other elements assessed in the overall survey can be seen in Lavelle et al. [26] and McGowan et al. [27]). Approximately 40 internal pilot surveys (convenience sampling of contacts of the research team across the collaborating universities on the IOI) took place; and 14 pilot survey field based interviews took place with SMR (data collection sub-contractors) during the Table 1Cooking skills and food skills items
Cooking skillsa
Cooking Method
1.‘Chop, mix and stir foods, for example chopping vegetables, dicing an onion, cubing meat, mixing and stirring food together in a pot/ bowl’
2.‘Blend foods to make them smooth, like soups or sauces’(using a whisk/blender/food processor etc.)
3. Steam food (where the food doesn’t touch the water but gets cooked by the steam)
4. Boil or simmer food (cooking it in a pan of hot, boiling/bubbling water)
5. Stew food (cooking it for a long time (usually more than an hour) in a liquid or sauce at a medium heat, not boiling) e.g. beef stew
6. Roast food in the oven, for example raw meat/chicken, fish, vegetables etc.
7. Fry/stir-fry food in a frying pan/wok with oil or fat using the hob/ gas rings/hot plates
8. Microwave food (not drinks/liquid) including heating ready-meals
Food Preparation Techniques
9. Bake goods such as cakes, buns, cupcakes, scones, bread etc., using basic/raw ingredients or mixes
10. Peel and chop vegetables (including potatoes, carrots, onions, broccoli)
11. Prepare and cook raw meat/poultry
12. Prepare and cook raw fish
13. Make sauces and gravy from scratch (no ready-made jars, pastes or granules)
14. Use herbs and spices to flavour dishes
Food skillsb
Meal Planning and Preparing
1…plan meals ahead? (e.g. for the day/week ahead)
2…prepare meals in advance? e.g. packed lunch, partly preparing a meal in advance
3…follow recipes when cooking?
Shopping
4…shop with a grocery list?
5…shop with specific meals in mind?
6…plan how much food to buy?
Budgeting
7…compare prices before you buy food?
8…know what budget you have to spend on food?
9…buy food in season to save money?
10…buy cheaper cuts of meat to save money?
Resourcefulness
11…cook more or double recipes which can be used for another meal?
12…prepare or cook a healthy meal with only few ingredients on hand?
13…prepare or cook a meal with limited time?
14…use leftovers to create another meal?
15…keep basic items in your cupboard for putting meals together? e.g. herbs/spices, dried/tinned goods?
Table 1Cooking skills and food skills items(Continued)
Label reading/consumer awareness
16…read the best-before date on food?
17…read the storage and use-by information on food packets?
18…read the nutrition information on food labels?
19…balance meals based on nutrition advice on what is healthy?
Source: a
Devised from National Diet and Nutrition Survey (NDNS) Year 1 [35], Barton et al. [20], Condrasky et al. [21], Chun & Worsley [36] and by the research team. Participants asked to rate how good they are at each skill, on a scale of 1–7, where 1 is very poor and 7 is very good. If a skill is not used, an option of
‘never/rarely do it’is available for participants to tick. b
Devised from National Diet and Nutrition Survey (NDNS) Year 1 cooking items [35], Barton et al. [20], Condrasky et al. [21], and by the research team Participants asked to rate how good they are at each skill, on a scale of 1–7, where 1 is very poor and 7 is very good. If a skill is not used, an option of
refinement of the survey tool. These pilots assessed the clarity of the questions and how easy participants found the measures to complete and resulted in minor amendments to the wording of questions in the survey. The pilot data collected was not used in the statistical validation of the measures, however, readability and us-ability was assessed in these pilots. At this piloting phase, after minor amendments to language, partici-pants at the various stages of piloting, verbally reported that they found the measures clear in meaning and not time consuming. After piloting, there were four studies which together assed the reliability and validity of the two measures. As missing data was scattered randomly through the datasets (assessed by creating dummy vari-ables and running independent t-tests), missing data was handled using listwise deletion [28]. All data were analysed using SPSS version 22 (IBM Corporation, 2013) and a significance level was set at 0.05 for all analysis.
Study 1
Study 1 was conducted to assess whether the skills were appropriately classified into ‘cooking skills’ and ‘food skills,’ as the skills included in the measures were derived both from previous literature and expert opinion. In addition, this study investigated the con-vergent validity of the measures, to assess whether the two measures of cooking skills and food skills are related but not a single factor, as they theoretically should be related yet distinct.
A nationally representative sample of 1049 adults be-tween the ages of 20–60 years, responsible for preparing a main meal at least once per week was collected. All sam-pling was completed by SMR, a market research company (in line with their sampling procedures). An overview of demographic characteristics can be seen in Table 2. Fur-ther details on sampling and procedure can be found in previous publications [26, 27]. Briefly, the measures were completed in this sample as part of the larger survey by Computer Assisted Personal Interviewing and were con-ducted by fully trained interviewers in participants’homes between October and December 2014. In total, 1172 po-tential participants were approached to partake in the sur-vey. One hundred and twenty-three participants did not participate in the survey (this represents 10.50% of po-tential participants approached) due to ineligibility or for other reported reasons including no interest, no time, did not feel comfortable having the interviewer in their home, etc.
Results from this sample were used to conduct fac-tor analysis using oblique rotation (direct oblimin) to assess the item classification into the two measures, interpreting both the Pattern Matrix and the Structure Matrix. Correlations were used for the investigation of
the convergent validity. In addition, the internal consistency reliability of the measures was tested using Cronbach’s alpha.
Study 2
[image:5.595.304.538.109.433.2]This study measured the test-retest reliability of the measures to assess their temporal stability. This sample was also used to examine the internal consistency reliability of the measures in the P/P format. Study 2 consisted of a sample of 23 ‘Food preparation novices’ students from Ulster University, recruited by the re-search team. Students were classified as ‘Food prepar-ation novices’ if they were enrolled on a course that consisted of no nutrition, hospitality, food marketing or food product and innovation orientated modules. The participants were made aware that they could withdraw at any time and that their details would remain confi-dential. The students were aged 18–27. Their demo-graphic characteristics can be seen in Table 3. These participants completed a pen and paper version of the two measures and two weeks later completed the mea-sures again. Of the students recruited; 56.5% (13 students) completed both measures at both time points, 30.4% (7 students) had partial completion of both measures Table 2Sociodemographic characteristics of nationally representative sample in Study 1
Characteristic M SD
Age 39.72 11.84
N %
Jurisdiction of Residence
Northern Ireland 312 29.7
Republic of Ireland 737 70.3
Gender
Female 590 56.2
Male 459 43.8
Level of Education
None 3 0.3
Primary School 11 1.0
Secondary School (Junior Cert/GCSE–age 15/16) 121 11.5
Secondary School (Leaving Cert/A Level–age 17/18) 351 33.5
Additional Training (e.g. NVQ, BTEC, FETAC, FAS) 305 29.1
University Undergraduate 153 14.6
University Postgraduate 105 10.0
Perceived Weight Status
Very underweight 5 0.5
Slightly underweight 58 5.5
About the right weight 601 57.3
Slightly overweight 334 31.8
at both time points (some element was missing, for example a section of one of the measures) and 13% (3 students) completed both measures at only one time point. Mean differences and Pearson correlations were used to verify the consistency of the results over time. Again, Cronbach’s Alpha’s were used to assess the internal consistency reliability of the P/P measures.
Study 3
Study 3 was used to test the discriminate validity of the measures between those with high levels of cooking and food skills, and those with low levels. In addition, this sample was used to further assess the internal consistency reliability of the P/P measures. This study consisted of a sample of 57 students. This sample completed a modified version of the larger survey (some questions regarding dietary intake, sources of learning etc. were removed to re-duce the time needed for completion) as the overall aim was to test the discriminant validity of the two measures.
The student sample consisted of students from the Ulster University, Northern Ireland and St. Angela’s College Sligo, Ireland, recruited by the researchers. All students were made aware that they could withdraw at any time and that their confidentiality would be kept in-tact. The students were either studying a Business-related degree or were studying Home Economics in their second year and were classified as ‘Food preparation novices’ (same classification as Study 2) and‘Experienced food pre-parers’ (each year required to complete a minimum of 80 h of practical cooking externally to any completed within class time, in addition to studying food science and
nutrition). The‘Experienced food preparers’sample were aged 18–26 and the‘Food preparation novices’were aged 19–24. Their characteristics can be seen in Table 4. This sample also completed a pen and paper version of the survey.
[image:6.595.56.291.108.348.2]The discriminate validity was tested between the ‘Experienced food preparers’and the ‘Food preparation novices’students using T-tests. Internal consistency re-liability was investigated using Cronbach’s Alpha. Table 3Sociodemographic characteristics of student sample in
Study 2
Characteristic M SD
Age 19.22 1.91
N %
Jurisdiction of Residence
Northern Ireland 23 100
Gender
Female 17 73.90
Male 6 26.10
Level of Education
Secondary School (Leaving Cert/A Level–age 17/18) 19 82.6
Additional Training (e.g. NVQ, BTEC, FETAC, FAS) 2 8.7
University Undergraduate 2 8.7
Perceived Weight Status
Slightly underweight 1 4.3
About the right weight 15 65.2
Slightly overweight 5 21.7
[image:6.595.303.539.244.728.2]Very overweight 1 4.3
Table 4Sociodemographic Characteristics of Student sample in Study 3
Characteristic M SD
Experienced Food Preparers
Age 19.70 1.27
N %
Jurisdiction of Residence
Republic of Ireland 40 100
Gender
Female 39 97.5
Male 1 2.5
Level of Education
Secondary School (Leaving Cert/A Level–age 17/18) 34 85.0
Additional Training (e.g. NVQ, BTEC, FETAC, FAS) 1 2.5
University Undergraduate 4 10.0
University Postgraduate 1 2.5
Perceived Weight Status
About the right weight 19 47.5
Slightly overweight 16 40.0
Very overweight 2 5.0
Characteristic M SD
Food preparation novices
Age 21.35 1.41
N %
Jurisdiction of Residence
Northern Ireland 17 100
Gender
Female 11 64.7
Male 6 35.3
Level of Education
Secondary School (Leaving Cert/A Level–age 17/18) 4 23.0
Additional Training (e.g. NVQ, BTEC, FETAC, FAS) 1 6.0
University Undergraduate 11 65.0
Perceived Weight Status
Slightly underweight 1 5.9
About the right weight 6 35.3
Study 4
Study 4 was conducted to assess differences between the CAPI and the P/P method in relation to the confidence scores of the measures. This study sample consisted of a combination of the samples in study 2 and study 3 (keeping the Home Economics students as a separate group as they have greater skills and this could inflate the scores and introduce bias), representing the P/P method, and due to sample size differences, a randomly selected 38 participants from the IOI sample in Study 1, representing the CAPI method. Here three groups were compared two P/P method groups (Home Economic students and a combination of the non-Home Econom-ics students from studies 2 and 3) and one CAPI method group (random selection from the IOI cohort). As the scoring is the same for both methods, one-way ANOVAs were conducted with Bonferroni post hoc analysis, to in-vestigate differences in the cooking skills confidence measure and the food skills confidence measure between the two methods of presentation.
Results
Psychometrics and internal consistency reliability
Participants’ cooking and food skills confidence were measured using the following 14 items and 19 items re-spectively in Table 5 and their mean scores on each item can be seen. For the psychometric testing, three factors with eigenvalues over 1 were found - one main component accounts for 65.26% variance, then the sec-ond one 8.2% of the variance and component 3 just 3.2% of the variance. All factor loadings were above the minimum criterion. The pattern matrix indicated the original cooking skills and food skills measures with some minor exceptions (see Table 6). The items falling into this third component consisted of the items: ‘Bake goods such as cakes, buns, cupcakes, scones, bread etc., using basic/raw ingredients or mixes’ and ‘Microwave food (not drinks/liquid) including heating ready-meals.’
In the Structure Matrix both the microwaving (Factor 1 = 0.656, Factor 2 = 0.557, Factor 3 =−0.537) and Bak-ing (Factor 1 = 0.677, Factor 2 = 0.477) had highest loading in Factor 1 (Cooking skills). Four ‘food skill’ items had higher loadings in Factor 1 (Cooking Skills); Buying in Season, using leftovers to create another meal, Keeping Basics in the cupboard and Reading the best before date. In the Structure Matrix, Buying in Season had higher loading onto Factor 2 (Factor 1 = 0.758, Factor 2 = 0.764) and using leftovers to cre-ate another meal had the same loading on both Factors (Factor 1 and 2 = 0.798). Keeping basics in a cupboard and reading the best before date had higher loadings on Factor 1 in the Structure Matrix (Factor 1 = 0.789, Factor 2 = 0.731 and Factor 1 = 0.793 and Factor 2 = 0.758, respectively). The internal consistency
reliability measured by Cronbach’s Alpha for the cook-ing skills confidence measure ranged from 0.78 (Study 3 Food preparation novices/Experienced food preparer students) to 0.93 (Study 1 IOI cohort), please see Table 7 for each cohorts Cronbach alpha. The food skills confidence measure’s Cronbach’s alpha’s ranged from 0.89 (Study 2 student cohort) to 0.94 (Study 1 IOI cohort) (see Table 7).
Temporal stability
The temporal stability of the measures was assessed using the test re-test approach in study 2. As there was a large number of missing cases in the food skills confi-dence measure test re-test scores, a dummy variable was created and showed there was no significant differences (P = .902) between those that reported on both time points and those that were missing data on food skills confidence on the initial time. The results show (see Table 8) that both measures have acceptable temporal stability as there were no significant differences between the two mean confidence scores from the first time (T1) and the two weeks repeated measure (T2). In addition, a further assessment of temporal stability was conducted using correlations between the cooking skills confidence measure and the food skills confidence measure scores at T1 and T2. A significant correlation was found be-tween cooking skills measures at T1 and T2 (r= .815,
P< 0.001) and food skills measures (r= .872,P < 0.001) again illustrating the consistency of the measures over time.
Construct validity
A strong positive correlation was found between cooking skills confidence and food skills confidence (r = 0.76,
p< 0.001) which indicates that the measures are measur-ing highly related components. In addition, there was a significant difference between the mean scores on both the cooking and food skills confidence measures between ‘Food preparation novices’ and ‘Experienced food pre-parers’from study 3. Table 5 shows that the‘Experienced food preparers’home economics students scored had con-sistently higher mean confidence scores on the individual items than the ‘Food preparation novices’students, with the exception of 3 items (stewing, making sauces, and comparing prices before buying). ‘Experienced food pre-parers’ had significantly better cooking skills confidence (F = 4.63, P< 0.05) and food skills confidence (F = 7.95,
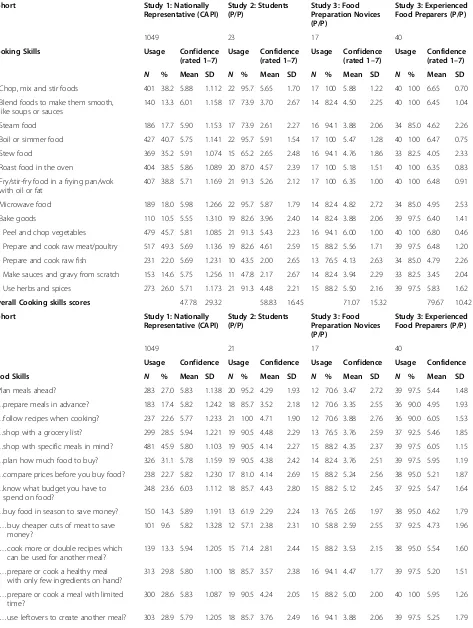
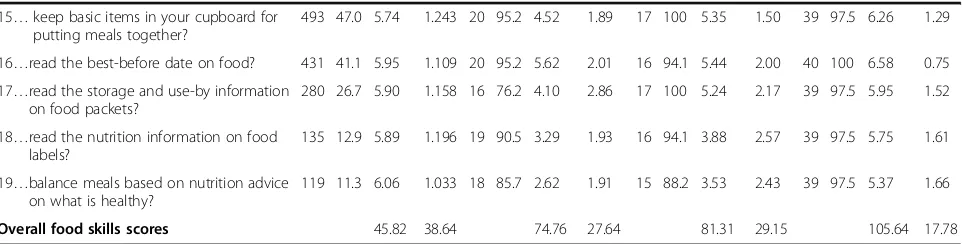
Table 5Cooking skills and food skills measures use, mean and standard deviations
Cohort Study 1: Nationally
Representative (CAPI)
Study 2: Students (P/P)
Study 3: Food Preparation Novices (P/P)
Study 3: Experienced Food Preparers (P/P)
N 1049 23 17 40
Cooking Skills Usage Confidence
(rated 1–7)
Usage Confidence (rated 1–7)
Usage Confidence (rated 1–7)
Usage Confidence (rated 1–7)
N % Mean SD N % Mean SD N % Mean SD N % Mean SD
1. Chop, mix and stir foods 401 38.2 5.88 1.112 22 95.7 5.65 1.70 17 100 5.88 1.22 40 100 6.65 0.70
2. Blend foods to make them smooth, like soups or sauces
140 13.3 6.01 1.158 17 73.9 3.70 2.67 14 82.4 4.50 2.25 40 100 6.45 1.04
3. Steam food 186 17.7 5.90 1.153 17 73.9 2.61 2.27 16 94.1 3.88 2.06 34 85.0 4.62 2.26
4. Boil or simmer food 427 40.7 5.75 1.141 22 95.7 5.91 1.54 17 100 5.47 1.28 40 100 6.47 0.75
5. Stew food 369 35.2 5.91 1.074 15 65.2 2.65 2.48 16 94.1 4.76 1.86 33 82.5 4.05 2.33
6. Roast food in the oven 404 38.5 5.86 1.089 20 87.0 4.57 2.39 17 100 5.18 1.51 40 100 6.35 0.83
7. Fry/stir-fry food in a frying pan/wok with oil or fat
407 38.8 5.71 1.169 21 91.3 5.26 2.12 17 100 6.35 1.00 40 100 6.48 0.91
8. Microwave food 189 18.0 5.98 1.266 22 95.7 5.87 1.79 14 82.4 4.82 2.72 34 85.0 4.95 2.53
9. Bake goods 110 10.5 5.55 1.310 19 82.6 3.96 2.40 14 82.4 3.88 2.06 39 97.5 6.40 1.41
10. Peel and chop vegetables 479 45.7 5.81 1.085 21 91.3 5.43 2.23 16 94.1 6.00 1.00 40 100 6.80 0.46
11. Prepare and cook raw meat/poultry 517 49.3 5.69 1.136 19 82.6 4.61 2.59 15 88.2 5.56 1.71 39 97.5 6.48 1.20
12. Prepare and cook raw fish 231 22.0 5.69 1.231 10 43.5 2.00 2.65 13 76.5 4.13 2.63 34 85.0 4.79 2.26
13. Make sauces and gravy from scratch 153 14.6 5.75 1.256 11 47.8 2.17 2.67 14 82.4 3.94 2.29 33 82.5 3.45 2.04
14. Use herbs and spices 273 26.0 5.71 1.173 21 91.3 4.48 2.21 15 88.2 5.50 2.16 39 97.5 5.83 1.62
Overall Cooking skills scores 47.78 29.32 58.83 16.45 71.07 15.32 79.67 10.42
Cohort Study 1: Nationally
Representative (CAPI)
Study 2: Students (P/P)
Study 3: Food Preparation Novices (P/P)
Study 3: Experienced Food Preparers (P/P)
N 1049 21 17 40
Usage Confidence Usage Confidence Usage Confidence Usage Confidence
Food Skills N % Mean SD N % Mean SD N % Mean SD N % Mean SD
1.Plan meals ahead? 283 27.0 5.83 1.138 20 95.2 4.29 1.93 12 70.6 3.47 2.72 39 97.5 5.44 1.48
2…prepare meals in advance? 183 17.4 5.82 1.242 18 85.7 3.52 2.18 12 70.6 3.35 2.55 36 90.0 4.95 1.93
3…follow recipes when cooking? 237 22.6 5.77 1.233 21 100 4.71 1.90 12 70.6 3.88 2.76 36 90.0 6.05 1.53
4…shop with a grocery list? 299 28.5 5.94 1.221 19 90.5 4.48 2.29 13 76.5 3.76 2.59 37 92.5 5.46 1.85
5…shop with specific meals in mind? 481 45.9 5.80 1.103 19 90.5 4.14 2.27 15 88.2 4.35 2.37 39 97.5 6.05 1.15
6…plan how much food to buy? 326 31.1 5.78 1.159 19 90.5 4.38 2.42 14 82.4 3.76 2.51 39 97.5 5.95 1.19
7…compare prices before you buy food? 238 22.7 5.82 1.230 17 81.0 4.14 2.69 15 88.2 5.24 2.56 38 95.0 5.21 1.87
8…know what budget you have to spend on food?
248 23.6 6.03 1.112 18 85.7 4.43 2.80 15 88.2 5.12 2.45 37 92.5 5.47 1.64
9…buy food in season to save money? 150 14.3 5.89 1.191 13 61.9 2.29 2.24 13 76.5 2.65 1.97 38 95.0 4.62 1.79
10…buy cheaper cuts of meat to save money?
101 9.6 5.82 1.328 12 57.1 2.38 2.31 10 58.8 2.59 2.55 37 92.5 4.73 1.96
11…cook more or double recipes which can be used for another meal?
139 13.3 5.94 1.205 15 71.4 2.81 2.44 15 88.2 3.53 2.15 38 95.0 5.54 1.60
12…prepare or cook a healthy meal with only few ingredients on hand?
313 29.8 5.80 1.100 18 85.7 3.57 2.38 16 94.1 4.47 1.77 39 97.5 5.20 1.51
13…prepare or cook a meal with limited time?
300 28.6 5.83 1.087 19 90.5 4.24 2.05 15 88.2 5.00 2.00 40 100 5.95 1.26
Differences between CAPI and P/P methods of presentation of measures
Results show that on both the cooking skills confidence and the food skills confidence measures there is a sig-nificant difference in scores between the two different methods (P< 0.005) (see Table 10). As seen in usage and confidence rating in Table 5 and discriminate validity in Table 9, Experienced Food preparers are consistently higher for their scoring, this difference is also seen in the comparison of the three groups in Table 10.
Frequency of usage of skills
Table 5 shows an overview of the reported frequency of usage and mean confidence score of all items for each group and following is the top reported used skills in each group. For the study 1 cohort, Preparing and cook-ing raw meat/poultry was the top reported skill (49.3%), followed by Peel and chopping vegetables (45.7%), Boiling or simmering food (40.7%), Frying/Stir-frying (38.8%), and Roasting/Baking food in the oven (38.5%). The Study 2 sample reported using Microwaving, Chopping, and Boil-ing (95.7%) and FryBoil-ing/stir-fryBoil-ing, PeelBoil-ing and choppBoil-ing vegetables/using herbs and spices (91.3%). In Study 3, the ‘Food preparation Novices’reported using Chopping, Boil-ing, RoastBoil-ing, and frying/stir-frying (100%). In comparison to the ‘Experienced Food Preparers’ who reported using Peeling, Frying/stir-frying, Roasting, Boiling, Blending and chopping (100%) and Baking, preparing and cooking raw meat/poultry, and using herbs and spices (97.5%). In addition, for this groups reported usages for any cooking skill was not below 82.5%.
For the food skills Study 1 reported usage of keeping basics in the cupboard (47.0%), shopping with specific meals in mind (45.9%), and reading the best before (41.1%) as the top three. Study 2’s sample stated their usage of following a recipe (100%), keeping basics in the cupboard, reading the best before, and planning ahead (all 95.2%). In Study 3, the ‘Food Preparation Novices’ reported keeping basics in the cupboard and reading the use-by (100%) and reading the nutrition in-formation, reading the best before, using leftovers to
create another meal, and creating a meal from few ingredients (94.1%). Comparatively, the ‘Experienced Food Preparers’ had no reported usage below 90%, all of the sample reported reading the best before and be-ing able to create a meal with limited time. 97.5% of this sample reported the usage of Planning ahead, shop-ping with specific meals in mind, planning how much to buy, preparing a meal with few ingredients, creating a meal using leftovers, keeping basic ingredients in the cupboard, reading the use-by date, reading the nutrition information and balancing meals based on nutrition advice.
Discussion
This paper describes the development and validation of two measurements to assess cooking skills confidence and food skills confidence. The measures were devel-oped to include a full range of skills for both cooking (cooking method and food preparation techniques) and wider food skills (meal planning, shopping, budgeting, resourcefulness and label reading) through a literature re-view, expert interviews and piloting. The results indicate that both measures have substantial internal consistency reliability, construct and convergent validity and temporal stability, as well as being easy to complete and user-friendly measures.
[image:9.595.58.539.100.222.2]Both measures were highly correlated with each other which showed that they are related but also psychomet-ric testing indicated that they were two distinct mea-sures. The psychometric testing showed that two items did not only fit into the two factors (cooking skills and food skills) but also into a third factor, however they were left in the cooking skills measure as the third factor consisted of only these two items and explained a small variance. In addition, in the Structure Matrix both these items had higher loadings in the Cooking skills Factor (Factor 1). Furthermore, as Nunnally and Bernstein [29] argue the intention of factor analysis is to reduce variables to‘more substantive’underlying fac-tors and the use of a cut-off point of an eigenvalue of 1 for factor extraction (as recommended by Kaiser [30])
Table 5Cooking skills and food skills measures use, mean and standard deviations(Continued)
15…keep basic items in your cupboard for putting meals together?
493 47.0 5.74 1.243 20 95.2 4.52 1.89 17 100 5.35 1.50 39 97.5 6.26 1.29
16…read the best-before date on food? 431 41.1 5.95 1.109 20 95.2 5.62 2.01 16 94.1 5.44 2.00 40 100 6.58 0.75
17…read the storage and use-by information on food packets?
280 26.7 5.90 1.158 16 76.2 4.10 2.86 17 100 5.24 2.17 39 97.5 5.95 1.52
18…read the nutrition information on food labels?
135 12.9 5.89 1.196 19 90.5 3.29 1.93 16 94.1 3.88 2.57 39 97.5 5.75 1.61
19…balance meals based on nutrition advice on what is healthy?
119 11.3 6.06 1.033 18 85.7 2.62 1.91 15 88.2 3.53 2.43 39 97.5 5.37 1.66
is over simplified and fundamentally flawed. Therefore, as recommended in Field [31], a scree plot was used to assess factors for extraction and only the initial two fac-tors were to the left of the point of inflection. The two items that fell into the third factor were microwaving food and baking goods such as cakes. It is suggested
[image:10.595.61.535.103.630.2]that although microwaving may be used in meal prepar-ation, for example microwaving a ready meal, it is not seen as a cooking skill and therefore participants did not rate this as they did not use it in cooking a meal. However, as a wide range of cooking abilities were recruited for, includ-ing those with very limited skill, participants had to be Table 6Study 1: Summary of Exploratory Factor Analysis for cooking and food skills measures using direct oblimin oblique rotation and the pattern matrix (N= 1049)
Factor Loadings
Item Factor 1: Cooking Skills Factor 2: Food Skills Factor 3: Other
1) Chopping, mixing, stirring 0.82
2) Blending 0.80
3) Steaming 0.90
4) Boiling 0.95
5) Stewing 0.89
6) Roasting 0.84
7) Frying/Stir-frying 0.86
8) Microwaving 0.55 −0.48
9) Baking 0.61 0.46
10) Peeling 0.92
11) Preparing/cooking raw meat/poultry 0.83
12) Preparing/cooking raw fish 0.83
13) Making sauces 0.88
14) Using herbs/spices 0.82
1) Planning ahead 0.74
2) Preparing in advance 0.61
3) Following recipes 0.76
4) Grocery List 1.01
5) Specific meals 0.76
6) Planning how much to buy 0.78
7) Comparing prices 1.07
8) Knowing food budget 0.88
9) Buying in season 0.46 0.43
10) Buying cheaper cuts 0.89
11) Doubling recipes 0.75
12) Cooking healthy with a few ingredients 0.57
13) Cooking with limited time 0.47 0.49
14) Using leftovers 0.50 0.43
15) Keeping basics in cupboard 0.56
16) Reading best before 0.53
17) Reading storage/use-by 0.42 0.45
18) Reading nutrition information on labels 0.70
19) Balancing meals based on nutrition advice 0.67
Eigenvalues 21.54 2.72 1.07
% of Variance 65.26 8.23 3.24
responsible for preparing a main meal at least once a week which could include heating a ready meal. By re-moving microwaving as a skill it may have excluded some participants that potentially use microwaving as their only skill or in combination with one or two others and therefore it was decided to keep microwav-ing as part of the scale. The other item that was ques-tionable but that was kept was baking. Baking may be seen as different to cooking in itself, with its own separ-ate skills, however, there is a certain amount of overlap and there are elements of baking that may be used in meal preparation including making fresh bread or mak-ing pastry for pies. Therefore, the item was included in the cooking skills confidence measure, however, future studies may consider developing and validating a bak-ing skills confidence measure in itself. Additionally, the two items ‘Keeping basic ingredients in the cupboards,’ and ‘Reading the best before date’ had higher loadings on the Cooking Skills Factor. As the two measures are correlated, it is understandable that some items would load on both measures, however, as conceptually these items are not considered‘cooking skills’and have been identified as food skills in previous literature [17], they were left in the food skills measure and further testing of these items is needed.
The temporal stability of the measures, assessed using a test-retest approach, was found to be highly correlated with both measures having no differences in their mean scores between both time points and with the correla-tions between the time points for both measures being significant. This highlights that scores remain consistent
over time in a non-biased sample as the sample con-sisted of ‘Food preparation novices’that had no previous experience of the measures or cooking/food education. Previous research has had problems with test re-test samples being biased due to their involvement in the de-velopment and testing of the measures [21].
The internal consistency reliability of both measures was >0.70 in all cohorts. Cronbach’s alpha’s > 0.70 have been established as satisfactory for non-clinical measures [32, 33]. Therefore, both the cooking skills confidence measure and the food skills confidence measure can be seen as highly reliable and they are measuring coherent concepts.
The two measures also showed a high discriminate validity as there were significant differences (P < 0.05 for cooking skills confidence andP< 0.01 for food skills confidence) between‘Experienced food preparers’(Home Economics students), proposed as high skilled students, and ‘Food preparation novices’, proposed as lower skilled students. Therefore, these measures would be able to dis-tinguish between higher and lower skilled individuals and could potentially be used for pre-screening for cooking in-terventions aimed at low skilled individuals. This supports the overall high construct validity of both measures [33].
[image:11.595.55.541.99.224.2]A difference in both the cooking skills confidence meas-ure and food skills confidence measmeas-ure scores were seen between the different methods of presenting the questions to the participants. This is an important factor to consider when choosing the method of presenting the measures to participants in future studies, as those that complete a P/P version of the scale may report inflated scores. If possible it is recommended using a tablet/computer to replicate the system used in CAPI where participants are presented with all the skills and choose which they use and then after completing this, they are then asked to rate their confidence on only the skills they stated they used. When presented with the question of usage and rating confi-dence at the same time, participants were more likely to give a rating for a skill even if they did not use it. There-fore, if using the P/P version of the measures this inflation Table 7Internal Consistency reliability of the cooking skills and food skills confidence measures
Cohort No. of items Range Mean Scorea SD n α
Cooking Skills
Study 1: Island of Ireland (N= 1049, CAPI) 14 0–98 47.78 29.32 1049 .93
Study 2: Test/Re-test Students (N= 23, P/P) 14 27–89 58.83 16.45 23 .79
Study 3: Experienced/Novice food preparers (N= 57, P/P) 14 46–98 71.1 15.3 15 .78
Food Skills
Study 1: Island of Ireland (N= 1049, CAPI) 19 0–133 45.82 38.64 1049 .94
Study 2: Test/Re-test Students (N= 23, P/P) 19 18–134 74.76 27.64 21 .89
Study 3: Experienced/Novice Food Preparers (N= 57, P/P) 19 32–127 81.3 29.2 16 .93
a
NB the paper and pencil version meant that participants rated their ability on almost all CS and FS items. The national survey means are lower as participants were first asked to highlight the CS and FS they used and only rated their confidence of those items
Table 8Study 2 (P/P): Temporal Stability of both cooking and food skills confidence measures
Measure N Time point Mean SD T df Sig
Cooking Skills Confidence
20 T1 58.25 17.26
T2 59.00 19.75 −0.292 19 0.774
Food Skills Confidence
13 T1 74.15 28.34
[image:11.595.56.291.660.732.2]of scores must be taken into account. Further when study-ing change in cookstudy-ing skills the method used must be the same. In addition, the representativeness of the measures may be considered to be accurate considering the reported usage. For the cooking skills items, the top reported cooking skills may be considered reflective of the eating patterns of that group, the Study 1 group top skills could be considered to correspond with a traditional diet on the IOI, meat and vegetables, roasts, casseroles (that are still reported as the most common main meals on the IOI – data not reported here). The student samples report chop-ping, frying/stir-fry, boiling, peeling, microwaving, roast-ing in the oven, these skills could be considered fundamental to the quick, easy meals associated with a student diet. In addition, the top reported food skills across the different cohorts show a number of consisten-cies, such as keeping basic ingredients in cupboards and reading best before dates. This shows learned behaviours across the different groups or perhaps adherence to con-sistent health messages (checking the best before date).
Additionally, some interesting differences between the ‘Food preparation novices’and the‘Experienced food pre-parers’can be seen. Experienced food preparers tended to use a higher number of skills more frequently than the food preparation novices. The high frequency use of skills such as peeling, blending and preparing or cooking raw meat/ poultry may indicate a greater use of basic ingredients in this group. Future interventions should focus on increasing the number of skills used by lower skilled individuals to en-able the use of more basic ingredients. Additionally, future research could investigate correlations between the use of different skills and the type of ingredients used in meal preparation. Furthermore, differences can be seen between usage of food skills among these groups. Experienced food preparers had a greater use of preparing a meal with limited time, as time has been identified as key barrier to home
meal preparation [8], future research should investigate whether their use of more skills more frequently or that they have a greater confidence in a range of skills enables meal preparation in a limited time.
Strengths and limitations
[image:12.595.57.538.99.169.2]The new measures were developed in light of the litera-ture and expert opinion and were found to be highly reliable and valid. In addition, the items do not revolve around specific foods, which increases the generalisability of the measures outside UK and Irish populations, although further studies to assess the validity of these measures in other populations are needed. In addition, al-though there were a large number of male respondents completing the measures, the majority were female. This may be reflective that women remain responsible for the meal preparation of most households [34]. However, this must be taken into consideration when generalising the results to men. A limitation of the test re-test study was the format in which the measures were presented, the question was split over two pages and some participants did not turn the page to complete the second half of the measure and therefore those measures could not be in-cluded in the analysis resulting in the lower response rate for the food skills confidence measure. Due to different answering formats, P/P versions of the measures were found to inflate the scores on both measures. Thus, inter-viewer led or computer based applications (where partici-pants are only provided the opportunity to rate the skills they said they use) may provide the most accurate scores for these measures. However, to use as part of a paper based large scale cross-sectional survey, longitudinal research or as screeners/measures for interventions, rearranging the question to put“if you don’t do a skill”tick ‘Never/rarely do it’first followed by confidence rating may help to make this version similar to the CAPI version. Table 9Study 3 (P/P): Discriminant validity of both cooking and food skills confidence measures
Measure Student Type N Mean SD F Sig
Cooking Skills Confidence Food Preparation Novices 15 71.07 15.32
Experienced Food Preparers 39 79.67 10.42 4.63 .036
Food Skills Confidence Food Preparation Novices 16 81.31 29.15
Experienced Food Preparers 34 105.64 17.78 7.95 .007
Table 10Study 4: Differences between the different methods of presentation of the measures Range F (df) Significance Non-Home Ec Students
(P/P,N= 38)
Home Ec Students (P/P,N= 39)
Random Selection from IOI (CAPI,N= 38)
P M (SD) M (SD) M (SD)
Cooking skills Confidence 0–98 28.63 (2112) .000 63.66 (16.93)a 79.67 (10.42)b 45.29 (28.38)c
N= 37 N= 37 N= 38
[image:12.595.54.551.645.723.2]Conclusions
The developed cooking skills confidence measure and the food skills confidence measure have been shown to have a very satisfactory internal consistency reliability and validity. In addition, they have been shown to re-main consistent over time. They are able to accurately distinguish between high and low skilled individuals and are user-friendly. While the choice of presentation of the measures must be considered, both measures are highly suitable for large scale cross-sectional research, longitu-dinal studies and interventions alike to assess or monitor cooking and food skills levels and confidence.
Abbreviations
CAPI:Computer Assisted Personal Interviewing; IOI: Island of Ireland; P/ P: Paper Pen; UK: United Kingdom
Acknowledgments
The authors would like to acknowledge the contribution made by Aileen McGloin and Marian Faughnan from Safefood, particularly with regard to their input on the development of the survey.
Funding
This material is based upon work supported by safefood, The Food Safety Promotion Board, under Grant No. 11/2013 for the period May 2014– October 2015.
Availability of data and materials
Database and measures available upon request presently, as further publications are planned, however, it will be made openly available when publications are completed.
Authors’contributions
FL, LM and MD conceived the manuscript. FL conducted the data analysis. FL drafted the manuscript and MD and LH edited. All authors were involved in the design of the study, read, commented and approved the final manuscript.
Ethics approval and consent to participate
Ethical approval for this research was received from Queen’s University Belfast Research Ethics Committee and the study was conducted in line with the guidance given in the Declaration of Helsinki. All participants consented to be part of this study and were made aware that they were able to opt out at any point.
Consent for publication
Not Applicable.
Competing interests
The authors declare that they have no competing interests.
Publisher’s Note
Springer Nature remains neutral with regard to jurisdictional claims in published maps and institutional affiliations.
Author details
1Institute for Global Food Security, School of Biological Sciences, Queen’s
University Belfast, Belfast BT9 5AG, UK.2Centre for Public Health, School of Medicine, Dentistry and Biomedical Sciences, Queen’s University Belfast, Belfast, UK.3Department of Hospitality and Tourism Management, Ulster
University Business School, Ulster University, Coleraine, UK.4Department of
Home Economics, St. Angela’s College, Sligo, Ireland.5Centre for Food Policy, Department of Sociology, School of Arts and Social Sciences, City University London, London, UK.6Food, Consumer Behaviour and Health Research
Centre, School of Psychology, University of Surrey, England, UK.
Received: 2 February 2017 Accepted: 23 August 2017
References
1. Wolfson JA, Bleich SN. Is cooking at home associated with better diet quality or weight-loss intention? Public Health Nutr. 2015;18(08):1397–406. 2. Van der Horst K, Brunner TA, Siegrist M. Ready-meal consumption:
associations with weight status and cooking skills. Public Health Nutr. 2011; 14(02):239–45.
3. Nelson SA, Corbin MA, Nickols-Richardson SM. A call for culinary skills education in childhood obesity-prevention interventions: current status and peer influences. J Acad Nutr Diet. 2013;113(8):1031–6.
4. Lang T, Caraher M. Is there a culinary skills transition? Data and debate from the UK about changes in cooking culture. J HEIA. 2001;8(2):2–14.
5. Beck ME. Dinner preparation in the modern United States. Br Food J. 2007; 109(7):531–47.
6. Worsley T, Wang WC, Wijeratne P, Ismail S, Ridley S. Who cooks from scratch and how do they prepare food? Br Food J. 2015;117(2):664–76.
7. Lavelle F, McGowan L, Spence M, Caraher M, Raats MM, Hollywood L, McDowell D, McCloat A, Mooney E, Dean M. Barriers and facilitators to cooking from‘scratch’using basic or raw ingredients: a qualitative interview study. Appetite. 2016;107:383–91.
8. Wolfson JA, Bleich SN, Smith KC, Frattaroli S. What does cooking mean to you?: perceptions of cooking and factors related to cooking behavior. Appetite. 2016;97:146–54.
9. Deliens T, Clarys P, De Bourdeaudhuij I, Deforche B. Determinants of eating behaviour in university students: a qualitative study using focus group discussions. BMC Public Health. 2014;14(1):53.
10. Chang MW, Nitzke S, Buist D, Cain D, Horning S, Eghtedary K. I am pregnant and want to do better but i can’t: focus groups with low-income overweight and obese pregnant women. Matern Child Health J. 2015;19(5): 1060–70.
11. Monteiro CA, Moubarac JC, Cannon G, Ng SW, Popkin B. Ultra-processed products are becoming dominant in the global food system. Obes Rev. 2013;14(S2):21–8.
12. Moodie R, Stuckler D, Monteiro C, Sheron N, Neal B, Thamarangsi T, Lincoln P, Casswell S, Lancet NCD. Action group. Profits and pandemics: prevention of harmful effects of tobacco, alcohol, and ultra-processed food and drink industries. Lancet. 2013;381(9867):670–9.
13. Monteiro CA, Levy RB, Claro RM, de Castro IR, Cannon G. Increasing consumption of ultra-processed foods and likely impact on human health: evidence from Brazil. Public Health Nutr. 2011;14(01):5–13.
14. Stuckler D, McKee M, Ebrahim S, Basu S. Manufacturing epidemics: the role of global producers in increased consumption of unhealthy commodities including processed foods, alcohol, and tobacco. PLoS Med. 2012;9(6): e1001235.
15. Short F. Domestic cooking skills - what are they? J HEIA. 2003;10(3):13–22. 16. Short F. Domestic cooking practices and cooking skills: findings from an
English study. Food Service Tech. 2003;3:177–85.
17. Fordyce-Voorham S. Essential food skills required in a skill-based healthy eating program. J HEIA. 2009;16(2):16–20.
18. Vrhovnik, L. A pilot study for the development of a food skills survey tool. Dissertation.Accessed at: https://qspace.library.queensu.ca/bitstream/1974/ 7323/3/Vrhovnik_Lydia_201207_MSc.pdf on 10th May 2014.
19. Porter J, Capra S, Watson G. An individualized food-skills programme: development, implementation and evaluation. Aust Occup Therap J. 2000; 47(2):51–61.
20. Barton KL, Wrieden WL, Anderson AS. Validity and reliability of a short questionnaire for assessing the impact of cooking skills interventions. J Human Nutr Diet. 2011;24(6):588–95.
21. Condrasky MD, Williams JE, Catalano PM, Griffin SF. Development of psychosocial scales for evaluating the impact of a culinary nutrition education program on cooking and healthful eating. J Nutr Educ Behav. 2011;43(6):511–6.
22. Morin P, Demers K, Turcotte S, Mongeau L. Association between perceived self-efficacy related to meal management and food coping strategies among working parents with preschool children. Appetite. 2013;65:43–50. 23. McGowan L, Caraher M, Raats M, Lavelle F, Hollywood L, McDowell D,
(just-accepted):00-24. Safefood. Food Skills: Definitions, Influences and Relationships with Health. 2014. http://www.safefood.eu/SafeFood/media/SafeFoodLibrary/ Documents/Publications/Research%20Reports/Food-Skills-Edited-Final-Report.pdf . Accessed 1 Dec 2016.
25. Brooks J, McCluskey S, Turley E, King N. The utility of template analysis in qualitative psychology research. Qual Res Psychol. 2015;12(2):202–22. 26. Lavelle F, Spence M, Hollywood L, McGowan L, Surgenor D, McCloat A,
Mooney E, Caraher M, Raats M, Dean M. Learning cooking skills at different ages: a cross-sectional study. Int J Behav Nutr Phys Act. 2016;13(1):119. 27. McGowan L, Pot GK, Stephen AM, Lavelle F, Spence M, Raats M, Hollywood
L, McDowell D, McCloat A, Mooney E, Caraher M. The influence of socio-demographic, psychological and knowledge-related variables alongside perceived cooking and food skills abilities in the prediction of diet quality in adults: a nationally representative cross-sectional study. Int J Behav Nutr Phys Act. 2016;13(1):111.
28. Tabachnick BG, Fidell LS, Osterlind SJ. (2001). Using multivariate statistics. 29. Nunnally JC, Bernstein IH. Psychometric theory. 3rd ed. New York:
McGraw-Hill; 1994.
30. Kaiser HF. The application of electronic computers to factor analysis. Educ Psychol Meas. 1960;20(1):141–51.
31. Field A. Discovering statistics using SPSS. London: Sage publications; 2009. 32. Bland JM, Altman DG. Statistics notes: Cronbach's alpha. Brit Med J. 1997;
314(7080):572.
33. Rattray J, Jones MC. Essential elements of questionnaire design and development. J Clin Nurs. 2007;16(2):234–43.
34. Smith KJ, McNaughton SA, Gall SL, Blizzard L, Dwyer T, Venn AJ. Involvement of young Australian adults in meal preparation: cross-sectional associations with sociodemographic factors and diet quality. J Amer Diet Ass. 2010;110(9):1363–7.
35. National Diet and Nutrition Survey (NDNS) Year 1 questionnaire items. http://doc.ukdataservice.ac.uk/doc/6533/mrdoc/pdf/6533_ndns_yr1_ interviewing_documents.pdf. Accessed 2 May 2015.
36. Chun Wang W, Worsley A. Who uses herbs and spices? Nutr Food Sci. 2014; 44(4):363–74.
37. Stevens J. Applied multivariate statistics for the social sciences. Lawrence Erlbaum. Mahwah, NJ. 2002:510–1.
38. Jöreskog, K. G. (1999). How large can a standardized coefficient be. Unpublished Technical Report. Retrieved from:http://www.ssicentral.com/ lisrel/techdocs/HowLargeCanaStandardizedCoefficientbe.pdf.
• We accept pre-submission inquiries
• Our selector tool helps you to find the most relevant journal • We provide round the clock customer support
• Convenient online submission • Thorough peer review
• Inclusion in PubMed and all major indexing services • Maximum visibility for your research
Submit your manuscript at www.biomedcentral.com/submit