Enhancing the bandwidth of piezoelectric composite transducers for air-coupled
non-destructive evaluation
Robert Banks1, Richard L O’Leary2 and Gordon Hayward2
1
Thornton Tomasetti, 19200 Stevens Creek Blvd, Ste 100, Cupertino, CA, 95014
2
Centre for Ultrasonic Engineering, University of Strathclyde, Glasgow, Scotland, G1 1XW.
Abstract
This paper details the development of a novel method for increasing the operational bandwidth of
piezocomposites without the need for lossy backing material, the aim being to increase fractional
bandwith by geometrical design. Removing the need for lossy backing materials, should in turn
increase the transmit efficiency in the desired direction of propagation. Finite element analysis has
been employed to determine the mode of operation of the new piezocomposite devices and shows
good correlation with that derived experimentally. Through a series of practical and analytical
methods it has been shown that additional thickness mode resonances can be introduced into the
structure by a simple machining process. The shaped composites described in this paper offer
increased operational bandwidth. A simple example of a two step thickness design is described to
validate and illustrate the principle. A more complex conical design is presented that illustrates a
possible tenfold increase in bandwidth from 30kHz to 300kHz, operating in air without backing. An
illustration of the applicability of this type of transducer technology for frequency agile guided
mode non-destructive evaluation is then presented.
I. INTRODUCTION
With the current interest in harmonic affects in the biomedical imaging and non-destructive evaluation or naval mine hunting requirements for wideband actuators capable of detection and characterisation of targets, there is an increased need for sensitive transducers offering wide operational bandwidths. Traditionally, increased bandwidth in piezoceramic/ piezocomposite
electrical tuning or matching networks [3, 4]. However, the addition of this backing reduces the overall sensitivity of the transducers. This paper details a preliminary investigation into the integrated design of piezocomposite devices for operation across a range of frequencies, without need for additional rear face loading.
Piezoelectric composite transducers are constructed of two constituent phases, incorporating an active piezoceramic and a passive polymer material. This transducer technology enables the designer to tailor the properties for specific applications. It is the addition of this polymer material, which offers an increase in transducer sensitivity and improved impedance matching to media of lower specific acoustic impedance, such as air and water, compared to piezoceramic sensors.
Figure 1 illustrates a 1-3 connectivity piezocomposite consisting of active ceramic pillars embedded within a passive polymer matrix. The annotations 1 and 3 relate to the connectivity of the ceramic
and polymer within the device respectively [5]. Namely, the number of directions in which it is possible to connect the material to the outer boundaries without intersection of the second material.
Figure 11-3 Connectivity Piezocomposite
The standard method of manufacture for the 1-3 composite is the “dice & fill” technique developed by Savakus [6], whereby two sets of slots are cut orthogonally into a ceramic block. An epoxy resin is then poured into the slots to provide a passive polymer matrix. The composite is then lapped to remove the excess ceramic and epoxy and reduce the transducer to the desired thickness. An alternative method, developed by Bowen [7], involves injection moulding, whereby the powdered ceramic material is injected into a periodic mould with a chemical binder, the mixture is then subjected to high temperature until the ceramic sinters and reforms within the mould. The resultant structure of free standing pillars is then bound within a polymer matrix and poled. Injection moulding enables fine scale transducer structures to be manufactured that are unrealisable with standard dice and fill techniques, although at an increased initial cost.
The resonant behaviour of a 1-3 connectivity piezocomposite device is exceptionally complex due the periodicity of the piezoceramic pillars embedded within the polymer matrix structure. It is as a
Kerf width
Pitch
result of this regular structure that a number of vibrational resonance modes are generated, both in the thickness and lateral directions each with their own frequency of operation and mode shape.
A. Thickness mode resonance
The fundamental thickness mode resonance of a piezocomposite transducer is typically the most dominant mode active within the transducer structure. This mode is governed by the overall thickness of the device and is caused by the longitudinal vibration within the piezoceramic pillars, in the height or thickness dimension. The wavelength for this mode is equivalent to twice the thickness of the transducer thickness and the velocity is defined as the speed of the sound travelling longitudinally through the thickness direction. Hence, for a composite with defined thickness of dt, the frequency of thickness mode resonance can be calculated by
f nv
d
t l
t
2 Eqn. 1
where,
ft is the resonant frequency in the thickness direction
vl is the sound velocity in the thickness direction
n is the wave number
In this case, n is limited to only odd harmonics (1,3,5…) due to the assumption that the transducer
Figure 2Electrical impedance characteristic of a piezocomposite device
The electrical resonant frequency is shown as the impedance minimum and is defined as the optimal frequency of operation for transmission [8]. This defines the frequency at which the transducer will displace most when excited by a driving voltage. Conversely, the peak on the impedance response illustrates the optimal frequency for reception [8] under open circuit conditions. The impedance characteristic shown in Figure 2 also indicates the width dilation mode of the transducer, occurring at approximately 120kHz resulting from the lateral resonance of the transducer.
B. Lateral resonance modes
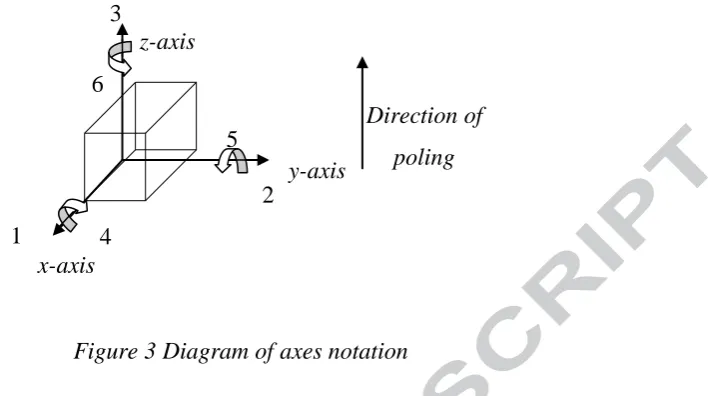
Lateral modes differ from thickness or longitudinal modes in that instead of travelling in the thickness or 3 direction, these modes travel along the width of the transducer, in the 1 and 2 directions. To explain, the characteristics exhibited from piezoelectric materials depend upon the orientation of the poling axis. This orientation governs the direction of vibration exhibited by the piezoelectric material. 1 and 2 correspond to the x- and y-axes respectively; while 3 relates to the z-axis and 4 through 6 refer to rotations around these axes. In piezoelectric ceramics, the conventional axis of polarisation is along the z-axis or 3 direction, hence the notation of axes can be
Figure 3Diagram of axes notation
Lateral waves are travelling perpendicular to the thickness mode and are governed by the velocity of sound in this direction. There are a number of different lateral modes active within a 1-3 connectivity composite transducer, these are width-dilatational, inter-pillar and intra-pillar modes. The influence these lateral modes exert over the transducer performance is governed by the aspect ratio of the transducer. Which is defined as the ratio of the ceramic pillar width to its height. It is
not the intention of this paper to investigate these modes in detail, (this occurrence has been covered in greater depth by authors such as Gururaja et al [9, 10], Reynolds [11] and Gachagan [12]) only to comment upon there existence and influences. These modes are now discussed briefly.
Width-dilatational resonances are due to the overall width of the transducer structure and can propagate waves in either radial or transverse form, dependent upon the transducer geometry. Typically, these modes have little influence upon the transducer performance being in the low kHz range and therefore do not interfere with the thickness mode operation.
Inter-pillar resonances are modes that arise due to standing wave patterns being generated within the periodicity of the composite structure. Namely, as the piezoceramic elements within the structure vibrate in the thickness direction, 3, a certain proportion of this displacement is coupled into the lateral directions, 1 and 2, dependent upon the polymer material parameters. This lateral motion generates shear waves within the composite structure which can, depending on the ceramic and polymer periodicity, lead to standing waves within the device. These phenomena can cause significant problems in the design of transducers with low ceramic volume fractions, typically less than 30%. Substantial work has been carried out in this area by Auld and Wang [13] and Gururaja et al [9, 10].
y-axis
x-axis
z-axis 3
2
1 4
5 6
Direction of
Intra-pillar resonances are again influenced by the microstructure of the composite, however on this
occasion, they are only critical in piezocomposites where the height of the pillar is within the same range as the lateral dimension i.e. aspect ratios in the range 0.5 – 2.0. In this range the lateral intra-pillar resonances impinge upon the thickness mode resonance and appear in the pass band of the transducer. The devices presented in the following sections of the paper exhibit a maximum pillar aspect ratio of 0.25 and therefore the effect of the intra-pillar mode is not significant in the current context.
C. Bandwidth enhancement in piezocomposite transducers
The analysis of the various resonant modes present within the piezocomposite structure illustrates that although the fundamental mode of operation is traditionally in the thickness direction, multiple frequencies are possible from the device. Indeed, it is the reverberation within the composite structure which governs the transducer bandwidth, the longer the vibration lasts, the narrower the bandwidth. Hence, it is apparent that if these reverberations are diminished, or damped, then the bandwidth associated with the device will be increased. This has been typically implemented by the addition of mechanical damping or matching [1, 2] to the composite and forms the traditional methodology for the enhancement of transducer bandwidth. Mechanical damping is achieved by the addition of a backing block to the rear face of the transducer, of higher acoustic impedance than
said transducer, to reduce the amount of internal reverberation caused by wave reflection at the rear face of the composite. The main disadvantage associated with this technique is that the addition of the backing block leads to reduction in the sensitivity of the transducer. This behaviour has been investigated by Kossoff [1] and Desilets [2], further to this, finite element analysis (FEA) by
Bennett [14] suggested that a compromise value for the acoustic impedance of the backing block to be half that of the active material selected. This value was suggested as a concession between loss of sensitivity and increase in available bandwidth.
that the introduction of the damping media led to a degradation in transducer sensitivity, by a factor of three over conventional narrowband composites.
Hossack [8] proposed an alternative method for improved bandwidth of 1-3 connectivity composites by utilising non-standard ceramic pillar geometries within the composite structure. This consisted of three different ceramic pillar geometries with non-uniform lateral dimensions and uniform thickness. Using FEA, the resonant frequencies of each pillar geometry were isolated and identified from the respective pillar aspect ratio. It was found that the non-uniform pillar geometry offered an improvement in bandwidth, approximately 50kHz, but the practicality of the design was restricted by introduction of unwanted resonances due the altered aspect ratios. Another method analysed utilising FEA by Hossack [8], was the use of non-uniform thickness within the transducer structure to extend the thickness mode resonance of the device. Originally investigated
experimentally by Bowen et al. [15], the theory predicts that if one section of the composite is vibrating in the thickness mode, the adjacent non-resonating area will also displace due to the lack of stiff clamping between the bordering regions [8]. Although Hossask [8] observed an improvement of approximately 150kHz in system bandwidth for air coupled operation, it was determined that tapered composite design lead to a non-uniform surface displacement, which would prove prohibitive in transducer design and therefore had limited use.
Recently Guo et al [16] analysed the behaviour of broadband transducer design achieved by a graded piezoelectric structure. In essence, 2-2 connectivity composites with a centre frequency of 15MHz were produced by machining shaped kerfs into the piezoelectric ceramic and latterly filling the kerfs with silver loaded epoxy. Transducer -6dB bandwidths of 92% were reported for the graded composite structure, compared to 56% for a standard composite structure, with a concomitant reduction in transducer sensitivity.
II. A NOVEL APPROACH TO BANDWIDTH ENHANCEMENT
From the illustrated examples in the previous Section, it apparent that although it is possible to increase the bandwidth characteristics of a composite device by the addition of a damping medium at the rear face of the transducer, this leads to a significant reduction in the transducer sensitivity.
piezocomposite device at an offset angle, led to the dismissal of this idea. However, if consideration is given to the extent of the frequency separation and level of complimentary vibration within the shaped composite, the problem of non-uniform vibration can be addressed.
The problem associated with piezoceramic transducers of variable thickness is the inherent difficulty in machining the ceramic material. The use of standard techniques such as grinding or drilling with steel carbide tools is extremely difficult due to the brittle nature of the ceramic material. Any attempt to machine inevitably leads to the destruction of either the ceramic, the machining tool or more commonly both. In addition to this, the high temperature generated in the machining process due to high friction may also lead to the depoling and destruction of the ceramic material. Using dicing equipment to produce the shaped or graded structure is possible [16] but is limited to orthogonal dicing arrangements.
However, one area of investigation appears to offer more scope for improvement than was first thought. Although the ceramic itself cannot be machined as a solid block, it is feasible that when the ceramic is embedded with the passive polymer phase as a piezocomposite device, it may be possible to alter the transducer structure. As discussed, the inherent difficulty in ceramic machining is the cutting of the rigid ceramic due to the brittleness of the ceramic and the build up of heat within the structure. However, if the ceramic is embedded within the polymer phase, then the overall volume of ceramic is decreased significantly, meaning less ceramic to be machined. Also, utilising this machining method, the ceramic pillars are decoupled via the passive material that acts as an insulator, so that heat convection between pillars is minimised. Coupled to this, if properly cooled during the machining phase, the grinding/cutting tool will dissipate the heat generated in the machining of the ceramic structure during the machining of the polymer phase. With this method of manufacture, the tool is only cutting ceramic for a shorter period of time, depending upon the volume fraction, in comparison to attempting to machine solid ceramic.
A. Simple dual thickness composite
As stated previously if properly designed, the thickness mode resonance of a given transducer is typically the most dominant mode active within the structure. Therefore, utilising the proposed manufacturing technique it should be possible to remove a section of the piezocomposite device in order to generate a second thickness mode resonance within the composite.
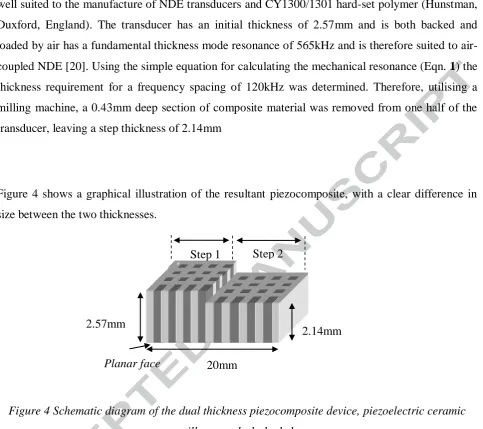
well suited to the manufacture of NDE transducers and CY1300/1301 hard-set polymer (Hunstman, Duxford, England). The transducer has an initial thickness of 2.57mm and is both backed and loaded by air has a fundamental thickness mode resonance of 565kHz and is therefore suited to air-coupled NDE [20]. Using the simple equation for calculating the mechanical resonance (Eqn. 1) the thickness requirement for a frequency spacing of 120kHz was determined. Therefore, utilising a milling machine, a 0.43mm deep section of composite material was removed from one half of the transducer, leaving a step thickness of 2.14mm
[image:9.595.60.544.75.504.2]Figure 4 shows a graphical illustration of the resultant piezocomposite, with a clear difference in size between the two thicknesses.
Figure 4Schematic diagram of the dual thickness piezocomposite device, piezoelectric ceramic
pillars are dark shaded
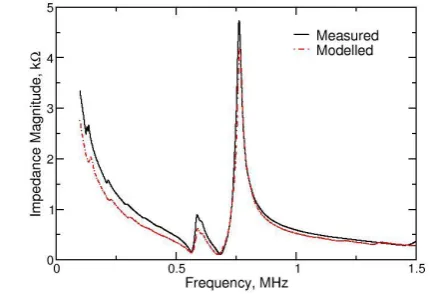
The associated electrical impedance characteristic for such a device is shown in Figure 5, it is evident that there are two clear impedance minima within the transducer operational impedance response, at approximately 565kHz and 685kHz. It can therefore be concluded that the introduction of the second thickness to the composite structure has led to the generation of an additional resonance mode to the device.
Step 1
Planar face 2.57mm
2.14mm Step 2
Figure 5Operational impedance of original composite and modified composite
In addition to the manufacture of one of these devices, a finite element model was constructed to simulate the theoretical behaviour of the proposed transducer. Using PZFlex (Weidlinger Associates, Mountain View, CA), a 2D symmetry finite element model of the piezocomposite with the same material parameters to that previously mentioned, was simulated to determine the operational impedance of the device. Figure 6 illustrates both the experimental and the theoretically derived electrical impedance characteristics. There is a considerable degree of corroboration between the two sets of results, the FE model has accurately predicted the frequency and magnitude of the two thickness mode resonances. The lateral modes of vibrations have been predicted but do not appear at the same frequencies in the two datasets shown in Figure 6. This is a result of employing as 2D representation of the 1-3 composite, i.e. a thin cross-section slice through the composite microstructure. Although adequate to represent the overall transducer behaviour this type of model cannot be expected to represent the full 3D vibrational behaviour of the composite.
[image:10.595.177.393.587.734.2]
In processing poled piezoelectric materials, it is important to minimise thermal affects arising from any machining process in order to ensure the piezoelectric material does not reach the Curie temperature and undergo depolarisation. The corroboration of the modelled and measured responses is also testament to temperature control achieved during the milling process when shaping the composite.
B. Surface displacement analysis of dual thickness composite
The previous Section has shown that altering the thickness of one region of a piezocomposite transducer introduces a second thickness mode resonance into the composite structure. However
what is still undetermined, is the mode of operation of the transducer, i.e. how the composite will vibrate when excited by an electrical signal. This can be explored by both experimental and theoretical analysis, to determine the vibrational displacement of the transducer front face, thereby illustrating the output characteristics.
Using a Polytec OFV056 scanning laser vibrometer (Lambda Photometrics, Harpenden, Herts., UK), the surface displacement from the planar face (i.e. the non-machined face) of the dual thickness piezocomposite transducer was measured across a range of frequencies, incorporating the two dominant electrical resonances when the transducer was excited by a 1volt, 10cycle tone burst signal. Figure 7 (a-j) illustrate the surface displacement of the planar face from a cross section for a from the first resonance at 560kHz in intervals to 680kHz since this represents the an appropriate range of frequencies to understand the vibrational behaviour of the stepped device.
From examination of the surface profiles, it is evident that the thickness mode vibration dominates at the first electrical resonance at 560kHz within the thicker section of the composite transducer. As the frequency is increased, the vibrational profile of the device changes such that the dominant area of vibration moves towards the thinner section on the right-hand side, at a frequency of 680kHz,
Figure 7Comparison of measured and modelled surface displacement cross-section for the stepped
piezoelectric composite in the range 560 to 740kHz
By referring to the cross sectional information for the dual thickness piezocomposite shown in Figure 7, it is apparent that both theory and experiment indicate a similar trend in vibration displacement with respect to increasing frequency. The modelled responses shown in Figure 7 are, in general, in agreement with the experimentally measured data - with similar trends evident in the corresponding datasets. However, since the model is a 2D representation of a 3D structure it is unlikely that an exact prediction of the vibrational behaviour across the frequency range of interest would be obtained. It is argued that the modelled data provide sufficient representation of the transducer structure being studied to warrant its use in this analysis.
The FE model of the dual thickness composite clearly illustrates the inclusion of a second thickness mode resonance and shows good correlation with the manner in which the vibration pattern changes across a frequency range, a number of other interesting artefacts are also evident. In experimental and FE derived datasets shown in Figure 7 as the frequency of excitation is increased additional
modes of vibration are evidently interfering with the thickness mode vibration. These secondary modes are a result of the lateral vibration within the composite structure being coupled to a varying extent as the frequency of excitation is increased.
compared to the displacement of either of the two sections. Interestingly, at the intermediate
frequencies of 600kHz to 640kHz, the phase characteristics show a phase change of radians, or
180, between the two step thicknesses. Evidence of this is show in Figure 8 where the
[image:14.595.100.543.65.394.2]experimental and modelled phase characteristics of the dual thickness composite at 620kHz is shown.
Figure 8Comparison of measured and modelled phase characteristics for dual composite at
620kHz
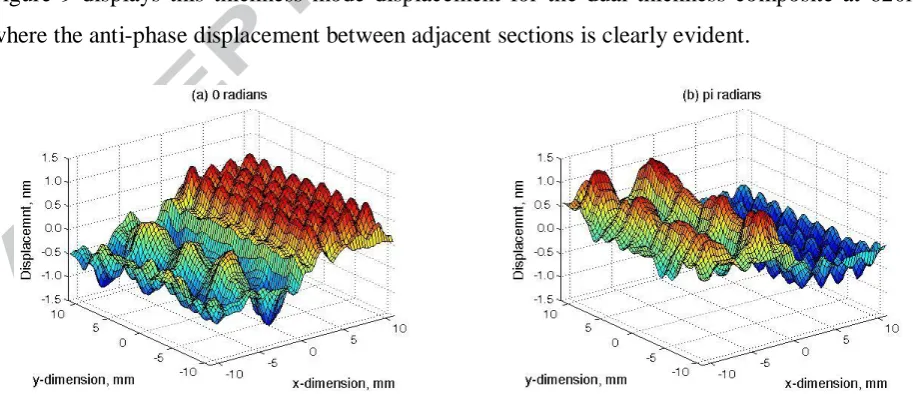
This indicates that both the steps are displacing, but are however, in anti-phase to one another.
Figure 9 displays this thickness mode displacement for the dual thickness composite at 620kHz, where the anti-phase displacement between adjacent sections is clearly evident.
Figure 9 Displacement of dual thickness composite at 620kHz for (a) 0 radians and (b) pi radians
Further investigation of this phenomenon, utilising FEM and linear systems modelling [17],
[image:14.595.181.527.189.380.2] [image:14.595.62.519.474.671.2][image:15.595.129.536.84.359.2]
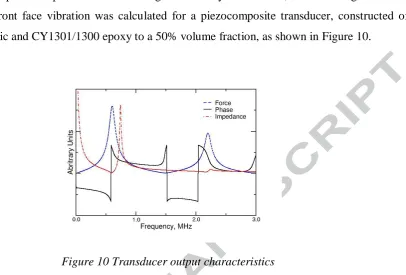
exhibited in the piezocomposite structure. Using the linear systems model, the force magnitude and phase of the front face vibration was calculated for a piezocomposite transducer, constructed of PZT-5A ceramic and CY1301/1300 epoxy to a 50% volume fraction, as shown in Figure 10.
Figure 10 Transducer output characteristics
From Figure 10, it is apparent that as the frequency tends towards the electrical resonance, 580kHz in this case, the output force from the front face increases until the electrical resonance is achieved due the secondary piezoelectric action [17, 18] producing positive feedback in the composite structure. This arises since the applied electric field induces a primary polarisation of charge in the piezoelectric material, which through the converse effect, introduces strain with the material. It is also possible that the mechanical stress may produce a secondary polarisation of charge within the crystal, resulting in an additional component of electric field.. Thereafter, the front face force decreases as the feedback into the system changes from positive to negative. This is illustrated in Figure 8 by the changing phase characteristics whereby, at the electrical resonance, the phase
exhibits a change of radians or 180°. This is further validated by examining the mode of vibration
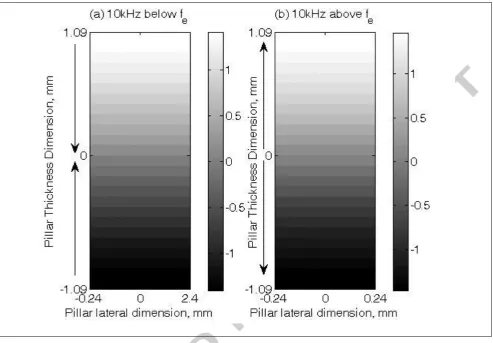
of a single ceramic pillar, before and after electrical resonance, utilising the PZFlex FE package the displacement of the pillar was simulated. Figure 11 depicts resulting displacement data, at frequencies above and below the electrical resonance (fe) of the piezoelectric composite. Interestingly, the magnitude data is equivalent in both cases. However, the phase, depicted by the
[image:15.595.195.534.164.328.2]
Figure 11 Illustration of phase reversal at electrical resonance
Consequently, by examining the impedance characteristics of the two thickness sections of the dual thickness composite in Figure 12, it is apparent that at 620kHz (indicated by the dotted line), the 2.14mm section will be experiencing positive current feedback due to secondary piezoelectric action, while the 2.57mm section will be undergoing negative current feedback. Thus, as illustrated
experimentally and theoretically (Figure 9), there will be a phase difference of radians between
Figure 12Experimentally measured electrical impedance characteristics of dual thickness
composite noting point of anti-phase vibration.
C. Frequency separation
Through additional post-processing of the modelled results, it is possible to investigate the mean surface displacement across the frequency range. By examining the individual thickness steps, the amount of sympathetic vibration in adjoining thickness sections can be determined and the relationship between the step thickness and the scale of frequency overlap defined. In this instance, a 33% volume fraction piezocomposite comprising of PZT-5A piezoceramic and HY1300/1301
Ciba-Geigy hard-set epoxy is modelled.
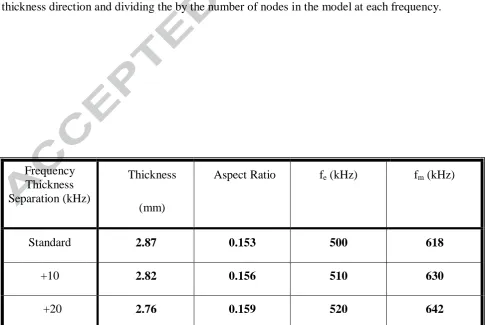
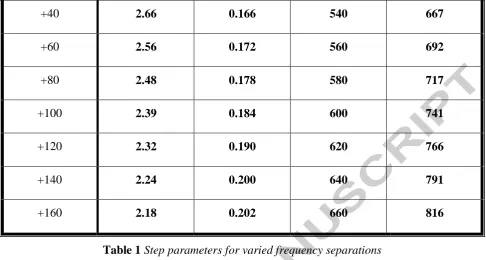
Using a simple model with 4 active pillars under each step section, the thickness of the second step was varied as detailed in Table 1. The thickness dimension of the standard device and each configuration required to achieve 10kHz steps in the fundamental thickness mode resonance, were determined using the Smith and Auld approach [19]. By post-processing of the modelled step surface, an average surface displacement with respect to frequency can be determined and illustrated in Figure 13. This was calculated by summing the total nodal displacement in the thickness direction and dividing the by the number of nodes in the model at each frequency.
Frequency Thickness Separation (kHz)
Thickness
(mm)
Aspect Ratio fe (kHz) fm (kHz)
Standard 2.87 0.153 500 618
+10 2.82 0.156 510 630
+40 2.66 0.166 540 667
+60 2.56 0.172 560 692
+80 2.48 0.178 580 717
+100 2.39 0.184 600 741
+120 2.32 0.190 620 766
+140 2.24 0.200 640 791
[image:18.595.55.542.72.332.2]+160 2.18 0.202 660 816
[image:18.595.61.492.310.608.2]Table 1 Step parameters for varied frequency separations
Figure 13 Average displacement of the planar face of stepped composite for differing step
thicknesses with respect to frequency
From these modelled results, it is apparent that as the step size is reduced between the between the two adjacent thickness sections, the amount of vibration in the adjoining area is naturally increased. However, once the frequency separation between the two sections is increased beyond 100kHz,
then the amount of sympathetic vibration transferred to the adjacent thickness step will be negligible. Therefore, the logical progression indicates that an alternative transducer arrangement would be a series of small steps cut into the composite to form a ramped transducer. Although this should increase the overall area of vibration, the thickness mode vibration in one area will still only
will be investigated further, in relation to conically shaped piezoelectric composites, in the following Section.
III. CONICAL COMPOSITE DESIGN
[image:19.595.67.527.262.479.2]In order to effectively couple the modes of thickness vibration in a complete structure, a conical design was investigated. If the gradient of the slope is maintained such that the adjacent frequency separation is less than 60kHz, it will be possible to generate a considerably wider bandwidth device. A 50% volume fraction 1-3 connectivity composite comprising PZT-5A ceramic and hard-set CY1300/1301 polymer was used to investigate the feasibility of this form of design. Using a standard metal working lathe, a conical transducer to the dimensions described in Figure 14 was constructed.
Figure 14Conical composite geometry
These parameters are such that the transducer’s electrical impedance characteristic exhibits a minimum corresponding to the first thickness mode resonance of the thickness section of the devide at approximately 580kHz. The corresponding frequency of the thinnest section of the device being 900kHz. By confining the device bandwidth to this range, the machined angle on the rear face of the transducer was limited to below 100. As the angle machined onto the rear face increases, conversely the number of pillars likely to be activated in the media surrounding the ceramic at thickness mode resonance decreases. By selecting this low angle for the rear face, the frequency separation should be such that a minimum of 4 pillars per radial thickness, should be displaced simultaneously through sympathetic vibration in the adjoining radial thickness sections. The composite was then electroded by evaporating metallic electrodes onto the upper and lower surfaces and the impedance measured with the HP4194 impedance/gain-phase analyser (Agilent Technologies, South Queensferry, Scotland). Figure 15 illustrates the impedance characteristics of
the machined conical device. From Figure 15, the extended range of the electrical impedance minimum for the conical transducer is evident.
22mm 2.7mm
7mm
Figure 15 Measured impedance of prototype conical composite transducer
[image:20.595.61.399.447.648.2]In order to determine fully the mode of operation of this transducer, a finite element model was constructed to predict the substructure displacements active within the transducer. In this instance, it was not possible to use the 2D modelling approach, as the circular nature of the model does not support this symmetry option. The lowest possible reduction factor that this form of model can use is ¼ symmetry, which will dissect the pillars in the x-y axis by 90o, hence when the symmetry is applied in the cylindrical co-ordinate system the cone will be represented accurately. Figure 16 illustrates the volumetric representation of the implemented model.
Figure 16Model geometry for conical device
Figure 17Comparison between theoretical and measured impedance responses
Using the same experimental arrangement described previously for the stepped composite device, laser vibrometry was used to determine the vibrational behaviour of the conical device. As before, PZFlex was used to generate FE derived vibrational dataset for comparison. Figure 18 illustrates the front face displacement distribution across a range of frequencies measured using a laser interferometer. In each case the displacement at the planar surface of the composite is presented. The experimental and FE derived data shown in Figure 18 are in agreement, at each frequency it is
Figure 18 Front face displacement of conical piezocomposite
IV. APPLICATION TO GUIDED WAVE NDE
In the previous section of this paper, methods to produce piezoelectric composite transducer
exhibiting increased bandwidth by shaping of the composite have been presented. The cone design that has been described will now be employed to analyse a simple scenario in guided wave non-destructive evaluation in plate structures using a pair of transducers. A single sided imaging method to launch Lamb waves into plate like structures is desirable in variety of applications in the
[image:25.595.107.531.136.270.2]
the possibility of frequency agile Lamb mode scanning a pair of cone devices were manufactured, Table 1 details the constructional parameters of the pair of transducers.
Figure 19 Schematic Diagram of single sided scanning arrangement for guided wave NDE
Conical transducer 1
(TX1)
Conical transducer 2
(TX2)
Composite materials PZT-5A/CY1301 PZT-5A/CY1301
Kerf width (mm) 0.25 0.25
Pillar width (mm) 0.6 0.6
Volume fraction (%) 50 50
Transducer width (mm) 20 20
Inner thickness (mm) 2.87 2.83
Outer thickness (mm) 2.01 1.77
Lowest fe 560kHz 560kHz
[image:25.595.68.466.291.670.2]Highest fe 840kHz 1000kHz
Table 1 Specification of the conical composites employed
The differences in the conical composites detailed in Table 1 is intended to ensure that the mechanical resonance of TX1 will coincide with the electrical resonance of TX2, hence the former will act as receiver while the latter will act as transmitter within the scanner. The bandwidth of the
Transmitter
Receiver
[image:26.595.64.541.67.408.2]
transducer pair, TX1 and TX2, is illustrated in Figure 20 - the response from a similarly configured planar pair of transducers is included in the figure for comparison. The frequency response of the transducer was determined by measuring in air the pitch-catch response of the transducers when coaxially aligned. The excitation was provided by 110V impulse from a PR5052 Panametrics transmit/receive pulser unit. By examination of Figure 20, it is apparent that the enhanced bandwidth of the conical composites is significantly larger than that of conventional, planar composites devices.
Figure 20 Illustration of bandwidth of conical transducer
The pair of air-coupled conical transducers were positioned 20mm above a 0.21mm thick plate of aluminium, the transmitter was excited by 10 cycle tone-burst signal with a pulse repetition frequency of 100Hz and an amplitude of 300mV, delivered via a 55dB ENI power amplifier. In reception, received signal was supplied to a current pre-amplifier based on the Analog Devices AD811 [21, 22] prior to being recorded using a digital storage oscilloscope. The frequency of excitation was set to 600kHz and the angle of the transducers was adjusted in order to maximise the receive signal of the zeroth order anti-symmetric (a0) Lamb wave in the aluminium plate. The wideband nature of the transmit-receive pair meant that the ability of the transduction system to tune the frequency of excitation, rather than the angle of incidence was then demonstrated. Two further plates, of thickness 0.16mm and 0.095mm, were then placed, in turn, under the pair of transducers. The excitation frequency of the conical transducer pair was then adjusted in order to generate and detect the a0 Lamb wave mode in each of the aluminium test plates. Figure 21 details
[image:27.595.94.527.94.277.2]
a b
Figure 21 Lamb wave generation in aluminium plates of different thickness, (a) time domain data
and (b) frequency domain data
It is evident from Figure 21 that, the conical composites are capable of generating the a0 Lamb wave
in aluminium for a range of thickness when the incident angle is constant. Such wideband transducer technology will allow for more versatile guided wave scanning of plates by tuning the frequency of operation to optimise the guided mode in the structure under test.
V. CONCLUSIONS
It has been shown that a second thickness mode resonance can be introduced into a piezocomposite of a given thickness by removing a section of this composite, to produce a device with two separate thickness from the one monolithic composite. This can be facilitated though simple machining techniques such as milling or grinding, whereas previously it was thought that it was impractical to machine piezoceramic. Using FEA, it is possible to model the interaction of this second thickness resonance with the original thickness mode of the composite and good correlation has been found between the experimental and FE derived datasets within this new structure.
Further to this, subsequent results have been presented illustrating the influence of additional thickness steps to the composite design and initial recommendations made as to frequency separation between thickness steps to ensure generation, or not, of sympathetic vibration in adjacent thickness sections. The suggested frequency separation for sympathetic vibration transfer between sections being 60kHz and over 140kHz to afford improved isolation between steps.
bandwidth from a conical composite design. This transducer configuration has shown good correlation with the computed FEA data and has a wider bandwidth than that currently associated with unbacked piezocomposites, 300kHz in comparison to 30kHz of standard planar thickness composites of an equivalent design. The potential of the wideband composite technology to perform frequency agile guided mode NDE has been demonstrated by considering the propagation of a0 Lamb waves in plates of aluminium.
The elegance of this form of transducer design, is the almost infinite number of structural iterations possible to the designer. The geometrical machining of the transducer structure allows the designer to tailor the properties of the piezocomposites to the needs of the application. For example, dual thickness transducers for generation and detection of ultrasound a two discrete frequencies, thereby reducing the need for two separate composites, one for each frequency (ideal for second harmonic
REFERENCES
1. G, Kossoff, “The effects of Backing and Matching on the performance of piezoelectric ceramic transducers”, IEEE Transactions on Sonics and Ultrasonics, Vol. SU-13, No. 1,
March 1966
2. C.S. Desilets, J.D. Fraser and G.S. Kino, “The design of efficient broad-band piezoelectric transducers”, IEEE Transactions Sonics and Ultrasonics, Vol. SU-25, No. 3, May 1978
3. A.R. Selfridge, R. Baer, B.T. Khuri-Yukab and G.S. Kino, “Computer optimised design of quarter-wave acoustic matching and electrical matching networks for acoustic transducers”, Proceedings of 1981 IEEE Ultrasonics Symposium, pp 644-647
4. R. McKeighen, “Influence of pulse drive shape and tuning on the broadband response of a transducer”, Proceedings of 1997 IEEE Ultrasonic Symposium, Vol. 2, pp1637-1642
5. R. E. Newnham, “Composite electroceramics” Ferroelectrics, Vol. 68, pp 1-32, 1986
6. H.P. Savakus, K.A. Klicker and R.E. Newnham, “PZT-epoxy piezoelectric transducers: A simplified fabrication procedure”, Materials Research Bulletin, No. 16, pp 677-680, 1981
7. L.J. Bowen, R.L. Gentilman, H.T. Pham, D.F. Fiore and K.W. French, “Injection moulding fine scale piezoelectric composite transducers”, Proceedings of 1991 IEEE Ultrasonic
Symposium, pp 499-503
8. J.A. Hossack, “Finite element analysis of 1-3 composite transducers”, IEEE Transactions on Ultrasonics Ferroelectrics and Frequency Control, Vol. 38, No. 1, pp 618-629, 1991
9. T.R. Gururaja, W.A. Schulze, R.E. Newnham, L.E. Cross, B.A. Auld and Y.J. Yang, “Piezoelectric composite materials for ultrasonic transducer applications Part 1: Resonant
10. T.R. Gururaja, W.A. Schulze, R.E. Newnham and L.E. Cross, “Piezoelectric composite materials for ultrasonic transducer applications Part 2: Evaluation of ultrasonic medical applications”, IEEE Transactions on Sonics and Ultrasonics, Vol. SU-32, pp 499-513, July,
1985
11. P. Reynolds, “Analysis and design of piezocomposite ultrasonic transducers using finite element analysis and surface displacement profiles”, PhD. Thesis, University of Strathclyde,
Glasgow, 1999
12. G. Hayward and A. Gachagan, “An evaluation of 1-3 connectivity composite transducers”, Journal of the Acoustical Society of America, Vol. 99, No. 4, April, pp 2148-2157, 1996
13. B.A. Auld and Y.J. Yang, “Acoustic vibrations in periodic composite plates”, Proceedings
of 1984 IEEE Ultrasonic Symposium, pp 528-532
14. J.T. Bennett, “Development of a finite element modelling system for piezocomposite transducer”, PhD. Thesis, University of Strathclyde, Glasgow, 1995
15. L.J. Bowen and T.R. Gururaja, " High Frequency Electromechanical Properties of Piezoelectric Ceramic/Polymer Composites in Broadband Applications " Journal of Applied Physics, Vol 51., No 11., pp. 5661-5666, 1980
16. H. Guo, J. M. Cannata, Q. Zhou, and K. K. Shung, “Design and Fabrication of Broadband Graded Ultrasonics Transducers with Rectangular Kerfs” IEEE Transactions on Ultrasonics Ferroelectrics and Frequency Control, Vol. 52, No. 11, pp. 2096-2102, 2005
17. G. Hayward, C.J. MacLeod and T.S. Durrani, “A systems model for thickness mode piezoelectric transducers”, Journal of the Acoustical Society of America, Vol. 79, No. 2, pp 369-382, 1984
18. Hayward, G., “Time and Frequency Domain Modelling of the Piezoelectric Transducer” Ph.D Thesis, University of Strathclyde, 1981
20. Kelly, S.P., Farlow, R. and Hayward, G., ‘Applications of through-air ultrasound for rapid NDE scanning in the aerospace industry’, IEEE Transactions on Ultrasonics, Ferroelectrics and Frequency Control, vol. 43, No. 4, pp581-591, 1996
21. R. Banks, “A frequency agile approach to air-coupled Lamb wave inspection” Ph.D. Thesis, University of Strathclyde, Glasgow, 1999
Highlights
● A method of bandwidth enhancement for piezoelectric composite transducers is proposed
● Exemplified through finite element modelling and studying the vibrational behaviour of
stepped and conical designs
● Fractional bandwidth up 300kHz is demonstrated, where 30kHz would be more typical for
such devices