City, University of London Institutional Repository
Citation
:
Wood, J. ORCID: 0000-0001-9270-247X, Kachkaev, A. and Dykes, J. ORCID:
0000-0002-8096-5763 (2018). Design Exposition with Literate Visualization. IEEE
Transactions on Visualization and Computer Graphics, 25(1), doi:
10.1109/TVCG.2018.2864836
This is the accepted version of the paper.
This version of the publication may differ from the final published
version.
Permanent repository link: http://openaccess.city.ac.uk/id/eprint/20081/
Link to published version
:
http://dx.doi.org/10.1109/TVCG.2018.2864836
Copyright and reuse:
City Research Online aims to make research
outputs of City, University of London available to a wider audience.
Copyright and Moral Rights remain with the author(s) and/or copyright
holders. URLs from City Research Online may be freely distributed and
linked to.
Design Exposition with Literate Visualization
[image:2.612.78.548.109.275.2]Jo Wood,Member, IEEE, Alexander Kachkaev and Jason Dykes
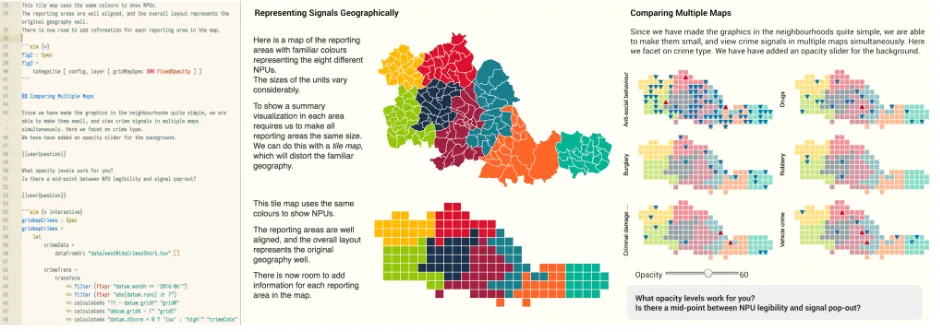
Fig. 1. Literate Visualization code (left) and output (centre and right) for a design exposition that elicits user feedback.
Abstract—We propose a new approach to the visualization design and communication process,literate visualization, based upon and extending, Donald Knuth’s idea of literate programming. It integrates the process of writing data visualization code with description of the design choices that led to the implementation (design exposition). We develop a model of design exposition characterised by four visualization designer architypes: the evaluator, the autonomist, the didacticist and the rationalist. The model is used to justify the key characteristics of literate visualization: ‘notebook’ documents that integrate live coding input, rendered output and textual narrative; low cost of authoring textual narrative; guidelines to encourage structured visualization design and its documentation. We propose narrative schemas for structuring and validating a wide range of visualization design approaches and models, and branching narratives for capturing alternative designs and design views. We describe a new open source literate visualization environment,litvis, based on a declarative interface to Vega and Vega-Lite through the functional programming language Elm combined with markdown for formatted narrative. We informally assess the approach, its implementation and potential by considering three examples spanning a range of design abstractions: new visualization idioms; validation though visualization algebra; and feminist data visualization. We argue that the rich documentation of the design process provided by literate visualization offers the potential to improve the validity of visualization design and so benefit both academic visualization and visualization practice.
Index Terms—storytelling, design, literate programming, theory
1 INTRODUCTION
Visualization both as an academic discipline and as a practice cannot progress unless we have the means to build upon the lessons learned from prior visualization work. In turn this requires us to be able to capture and share the process of visualization design and rationales that drive it. If the cost of doing this is too great, or the ways in which it can be achieved are unclear, we risk stagnation as we repeat mistakes or invest unnecessary effort in reinventing established good practice. We propose a solution to address these concerns that involves commu-nicating design and documenting design choices using the emerging ‘computational notebook’ paradigm.
Literate visualizationis an approach to visualization design and production that involves not only creating visual artifacts, but also generating a narrative around the design process using light-touch documentation in parallel with its production. It provides a high degree of flexibility for doing so while allowing structure to be applied to guide this process. The intent is to encourage a shift towards a deep
• All authors are at the giCentre, City, University of London. E-mail: j.d.wood — alexander.kachkaev — j.dykes @city.ac.uk.
Author post-print. Manuscript received 31 Mar. 2018; accepted 11 July. 2018. Date of Publication Jan. 2019; date of current version 11 July. 2018. For information on obtaining reprints of this article, please send e-mail to: [email protected]. Digital Object Identifier: xx.xxxx/TVCG.2019.xxxxxxx
coupling of coding process with the design process by integrating the documentation of both simultaneously. We base the approach on that of ‘literate programming’ proposed by Donald Knuth [15], but adapted and extended to address the distinct needs of visualization construction. The main contributions of the work reported in this paper are four-fold:
• A theoretical framework for considering the paradigm ofliterate visualizationwhich provides researchers and practitioners a lan-guage and ontology for considering how we conduct integrated visualization design, description and implementation processes.
• A model for supportingbranching narrativesin visualization
design storytelling that links narrative and implementation.
• A set of extensiblenarrative schemasfor supporting and validat-ing a wide range of visualization design processes.
• A open source platform,litvis, which supports literate visual-ization including live coding and linting, formatted narratives, branching narratives and narrative schemas, all in a single editing environment.
Carol is investigating changes in household income over time and wishes to use visualization to identify patterns of inequality and then communicate them to others. She opens up a new document in theAtom
editor and adds a one-line text header indicating it is a litvis document. After copying the contents of a CSV file of household income data from 1960 – 2016 into the document she adds a couple of lines of text describing the data source and a single line that assigns the columns of data to a named function. She creates a second document in Atom and writes a header of two-lines, the first linking to the data document, the second linking to a Socratic questioning schema (supplied with litvis). She starts to code in Elm, generating the Vega-Lite specification to create a series of timelines showing changes in household income for various percentiles in the income distribution. Errors in her code are flagged in the editor with messages as to the likely cause, helping her to correct them. Because she is using the Socratic question schema, the editor flags a warning that she has not yet stated why she has chosen to use time series line charts to meet her objective. She adds a couple of sentences after her code to do this, but in doing so it occurs to her that there may be a more effective way to visualize the data. So she creates a new document, again linking it to the original data document and adding the Socratic questioning schema, but this time she codes a connected scatterplot showing the change over time for the 5% and 95% income bands, adding brief statements justifying her design choice. Carol can now switch between the two designs and their justifications in Atom before eventually deciding to choose the connected scatterplot. She creates a final document that links to the connected scatterplot document, performs her analysis and adds an explanation of the income patterns she observes. She shares the collection of four documents with a colleague who is able to review her two alternative designs and read her analysis of the data. Her colleague notes that there are new household income data available including a correction to some of the historic data. He updates the data in the first document adding a note on the changes within the same document. The changes automatically cascade through all other documents updating the visualization. He notes the changes and confirms that the analysis text and conclusions remain valid.
2 LITERATEPROGRAMMING ANDLITERATEVISUALIZATION
Literate Visualization (LV) can be thought of as a form of storytelling where the designers of some visualization specify not only its implemen-tation, but also the rationale behind the design of the implementation. It is therefore a tight coupling of textual narrative and more formal implementation specification such as executable programming instruc-tions. Importantly, that coupling should be seen as not simply expressed retrospectively in a document, but as a shift in emphasis in the process of working through a visualization design to its implementation. In this sense, it can be seen as an extension of Knuth’s literate program-ming (LP) [15] and its more recent data science fraprogram-ming as a form of ‘computational narrative’ [25].
Knuth proposed that LP should be considered primarily an approach for communicating between people rather than a dialogue solely be-tween programmer and computer. He proposed the writing of integrated documents that contained both instructions for creating typeset text for human consumption (weaving) as well as conventional source code to be compiled into lower level machine instructions (tangling).
He did this by inverting the relationship between commented and uncommented code in a source code document so that by default all text is assumed to be natural language prose while program instructions are delineated within special blocks. The approach was driven by a number of principles and assumptions:
(i) Writing and reading code should afford all the nuance that comes with writing and reading conventional literature.
(ii) The LP author should consider their document primarily to be a narrative forming a dialogue between people, with compiled code a secondary byproduct.
(iii) ‘Tangled’ source code should be deliberately obfuscated to en-courage people to engage with the formatted ‘weave’.
(iv) The narrative structure of LP should be the one most natural for communication with other people, not one determined by the programming language.
(v) By forcing the programmer/author to contextualise their code, as-sumptions are questioned and implicit knowledge is made explicit, resulting in better quality code.
Later adaptations of Knuth’s LP approach have placed less impor-tance on (iii) and developments in programming languages have made it easier to follow (iv). In focussing on (iv), Taylor [35] recognised three levels of narrative structuring:semi-literateprogramming where ‘comments’ are simply elevated to first class elements in a text doc-ument (e.g. literate Haskell [11], or literate-mode coffeeScript [5]);
literate projectionorsymphonic programmingwhere code blocks can
be named and cross referenced in any order; andartistic
program-mingthat can mix multiple languages with arbitrary selections and
transformations of code segments. In the context of visualization, the ‘artistic programming’ model is an important one as it allows the trans-formation of visualization coding instructions into rendered graphical output. Arguably, ‘notebook’ environments, dating back at least as far asMathematicain 1988 [38], but more recently those such as Jupyter-Lab Notebook[12],R-Markdown[29] andObservable[2] adopt many elements of the artistic programming model.
In adapting the LP approach to visualization design, it is important to consider the critiques of LP and why it has not been used more widely since being proposed in 1984. Spinellis [34] argues that self-documenting code, if designed well, is more valuable than the repetition that results in explicit comments describing code and that modern pro-gramming platforms with higher level abstractions implicitly satisfy the aims of the LP approach. We argue that in the context of visualization, a key characteristic of the narrative emphasis is not on describing an implementation, but in documenting the detail of the design process and contextualising the graphic – something not usually captured in a programming language, whatever the level of abstraction.
Giuca [9], discussing literate Haskell, asserts that the additional burden of writing a literate narrative on top of coding instructions is too cumbersome to justify the effort. While Knuth argues that the discipline of constructing such narratives saves effort in the long run through better coding design, it does appear a credible argument that the perceived initial extra effort required has been off-putting to most programmers. In an analysis of 1.3 million Jupyter notebooks that facilitate computational narratives, Ruleet al. observe that 27% of them contain no textual narrative at all and that the majority that do, focus the narrative at the start of a document most probably in an introductory context [30]. What emerges from these observations is that any environment that supports LP or LV must make the process of adding narrative as low-friction as possible and present the benefits of doing so as early as possible. This may explain the recent emergence of the ‘notebook’ approach of JupyterLab and Observable for example. We address these concerns explicitly, including their unused potential as observed by Ruleet al., in Section 4.
Agaram [1] suggests the emphasis of Knuth’s approach to literate programming, especially the use of his TEX typesetting program for formatting narrative has resulted in people prioritising aesthetically pleasing output over clear and persuasive narrative. While one can argue this isn’t a problem with LP directly, but the way it has been used (especially in the first few years of its uptake), there remains a valid criticism that there are few pointers available to the literate programmer to encourage effective narrative construction. Wolfram’s model for the ‘computational essay’ provides some helpful guidance [38], especially on the role of reasoning, but it remains somewhat informal in its approach to narrative construction. LV, where a design narrative may be further removed from the implementation details, may be more vulnerable to this problem. We address the criticism with our proposal fornarrative schemas(Section 5) and show how these can be used to support and enhance existing visualization design models.
from the start makes it harder to change, while writing it from a position of retrospection after a design project has completed risks failing to capture how designs and assumptions changed over the project lifetime. Related to this is the danger of the sunk cost fallacy where the extra documentation effort during a project may make it harder to iterate de-signs as designers become more defensive about what they have already produced. The implications of this for an LV environment is that the cost of providing a narrative must be minimised along with the ability to capture and move between alternative designs. We address these concerns with an emphasis on light-touch documentation (Section 4) and our proposal forbranching narratives(Section 6).
Capturing the design process as it happens allows designers to ac-cumulate evidence supporting validity claims in visualization research. This may be achieved by situating visualization design within process and decision models [19, 24, 32, 33] that provide actionable guidance on effective visualization design. By articulating the rationale for design choices [20] the aim is to ensure knowledge generated through visu-alization is consideredvalid– a critical foundation for applied work in our domain. Yet these models lack actionable guidance on how we describe and document the designs that we create and the decisions that we make during this process.
Easily generated textual narrative provides an opportunity to doc-ument these activities. Structuring these narratives with schemas can relate them to existing visualization process and decision models should we wish, offering a mechanism for describing the designs that we create through these frameworks. We see this as an opportunity to support existing models with rich accounts of how and why a design has been established as it is developed. These will enable others to make in-formed validity judgments, develop critique and build upon the lessons learned from the documented designs and design process. For exam-ple, theNested Blocks and Guidelines Modelcontributes a structure that “strives to make explicit the design decisions and assumptions that process models tend to omit” [22]. Through its schemas and narratives, our softwarelitvis, provides a flexible mechanism to support use of this model through documenting decisions, assumptions and reactions explicitly as part of the design process.
3 DESIGNEXPOSITION
A key distinction between LV and LP is that in the visualization context, the narrative is often focussed on the visualization design, its rationale and its effect rather than the mechanism of its implementation. This also helps differentiate LV from the data science computational narrative with its emphasis on data analysis and interpretation. Or to use the language of the Design Activity Framework [20], thewhyis promoted as a first class citizen along with thehow.
Constructing a visualization involves a set of design choices and im-plementations that follow those choices. Activities where those design choices are articulated, whether by the designer to themselves, to other designers, to potential users of the visualization or to wider communi-ties, we refer to asdesign exposition (DE). DE may take many forms and vary in degree, ranging from inline comments within programming code, through informal conversations with colleagues, through hand-written annotations and sketches of candidate visualizations (e.g. [28]), to formal documentation of design choices and evaluation. Indeed the notion of what constitutes an exposition of design is itself inherently difficult to define as it may include informal and ambiguously expressed ideas and implementations inseparable from their design abstractions or data [18]. Nevertheless, exposition can assist in exploring design spaces, developing arguments, informing evaluation and supporting reflection. And yet there is likely great variation among practitioners in the degree to which DE features in the development of visualization. That may be in part due to the effort required to articulate, communicate and justify design choices but also to the lack of established convention for doing so.
Many conventions exist for structuring design processes, such as the
nine-stage model[32],multi-channel design[40], thedesign activity framework[20] or even comprehensive design space evaluation [21] for visualization and more generally,Design Rationale[23, 27] for explaining design thinking. But they offer little guidance on how best
to express the results of these processes within a written narrative. This deep engagement can provide valuable insight and documented design
thinking for others to build upon but may also be regarded ashigh
frictionactivity that can slow down the development process or even discourage it entirely. The analysis of computational notebooks by Rule
et al.[30] suggests the tensions between exploration and explanation and lack of guidance in resolving that tension adds to this friction.
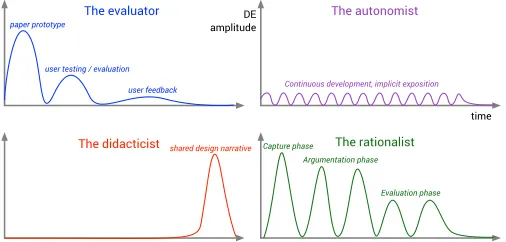
To understand how DE may be incorporated into the visualization design process we propose a number ofdesigner architypes(see Fig-ure 2) that reflect contrasting approaches. We characterise each by considering the volume of effort put into design exposition (DE ampli-tude) and how it varies over time. Two represent endpoints on a DE spectrum (‘the autonomist’ with minimal DE and ‘the rationalist’ with full DE) and two represent common practice in visualization design and education (‘the evaluator’ and ‘the didacticist’). While DE may be incorporated into the design process in other ways, these four archi-types help to surface benefits and difficulties involved in articulating and capturing thoughts on design.
DE amplitude
time paper prototype
user testing / evaluation
user feedback The evaluator
shared design narrative
The didacticist Capture phase Argumentation phase
Evaluation phase
The rationalist
Continuous development, implicit exposition
[image:4.612.316.569.246.367.2]The autonomist
Fig. 2. Four visualization designer architypes characterised by design exposition effort over time.
3.1 The Evaluator
The evaluator adopts a model common in larger visualization projects where development follows some prototyping phase exploring design options before one or more periods of user testing and evaluation. Once deployed there may be further more limited opportunities for design options to be considered following user feedback.
3.2 The Autonomist
In contrast to the evaluator, the autonomist implements their visualiza-tion without any need to be explicit about design choices. They rely on their design skills and experience with a largely implicit consideration of design options. There may be many small and frequent hints of design exposition in, for example, source code comments or coding style.
3.3 The Didacticist
The didacticist likes to explain their design choices after they have been made. In contrast to the evaluator and autonomist, design exposition is madepost hocin a reflective or didactic context. Examples include academic design studies (e.g. [17, 32]), designers’ reflective blog posts (e.g. [36]) or teachers’ deconstruction of existing visualizations and students’ reflection on their visualization designs.
3.4 The Rationalist
3.5 The DE Frequency Domain
These architypes are not mutually exclusive and most projects will adopt practices that contain elements of many of them. They can be combined into a single model by treating DE over time as a signal and transforming into the frequency domain (much as Fourier transform of a wave signal). This allows us to consider the combined structure of DE that may contain several levels of exposition with different magnitudes and frequencies. And importantly, the trade-offs between DE depth and frequency.
DE amplitude
DE frequency
high effort bursts of deep exposition
low effort, fine grained, shallow exposition
effort
evaluator
didacticist
[image:5.612.314.553.149.401.2]autonomist rationalist
Fig. 3. Design exposition frequency domain. What are the most efficient approaches to making DE more frequent or deeper?
When considering DE options, moving either up or right in this space involves more effort, which may explain why the top-right space is not typically populated, and rationalist approaches likedesign rationaleare not adopted more widely. Greater insight can be gained by examining this space in more detail, and in particular the friction involved in moving up or right.
Consider the notion of a unit of effortethat we wish to deploy
either in increasing the magnitudemof some design exposition or
increasing the frequencyf with which exposition is made. Letcbe
[image:5.612.58.285.159.291.2]some fixed cost in effort that is required before any exposition can be made (for example, in shifting between visualization construction and documentation environments, or in assembling a mechanism to gather user feedback). We can therefore construct a curve of fixed effort in the frequency domain that describes the trade-off between less frequent deeper exposition and more frequent shallower exposition, which we can consider as aPareto front(see Figure 4).
Fig. 4. Pareto fronts of fixed effort assumingleft:10 units of effort and a fixed DE costcof 0.5 (m=10e/f−0.5f);right:1 to 20 units of effort with a fixed costc=0.5
Analysis of the DE frequency space helps in defining an effective design exposition strategy in a number of ways. Firstly the increasing surface gradient (lines becoming closer together in Figure 4) demon-strates that there are diminishing returns in simply putting more effort in order to document design more frequently (assuming that there is some fixed cost for every DE activity). Secondly it shows that it is pro-hibitively expensive (exponentially so) to occupy the top-right region
of the space, suggesting effective DE improvements are best targeted at ‘little but often’ strategies. And thirdly, it allows us to explore the effect of reducing that fixed cost, for example by reducing the indirection between arriving at a design choice and articulating the rationale for that choice.
The relative cost of more frequent exposition will depend on the fixed cost of each exposition activity. We can see the effect of different fixed costs by plotting a series of similar curves for various values ofc
and various amounts of efforte. (see Figure 5)
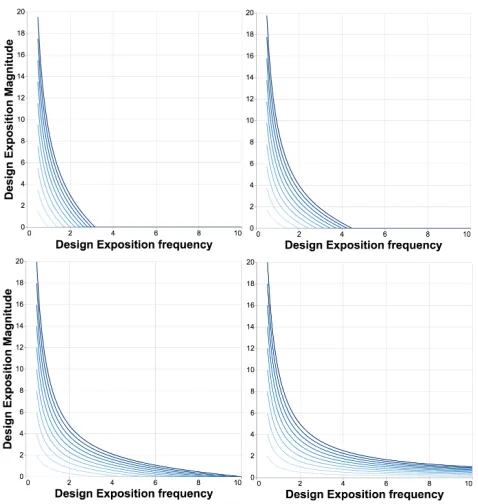
Fig. 5. Pareto fronts for fixed costs of (top row)c=e,c=0.5eand (bottom row)c=0.1eandc=0. Each chart shows effort lines of1eto10e
This shows (not surprisingly) that the benefits of reducing the fixed cost of DE, through, for example, a literate visualization environment, are greatest in allowing higher frequency low magnitude exposition activity (lowering fixed costs moves curves towards the bottom-right of the space more than the top-left). It is here therefore where effort was focussed in developing a literate visualization environment by reducing the friction involved in creating frequent small DE activities.
4 IMPLEMENTATION
To support parallel exposition and rich visualization expression we de-velopedlitvis– a coding and narrative integrated development
environ-ment running as a plug-in for both the Atom (https://atom.io)
and Visual Studio Code (https://code.visualstudio.com)
editing environments (see Figure 6). Output can be exported as stand-alone HTML or PDF documents and the architecture is such that it could also be embedded within an online web tool. The software and source code, written in TypeScript and Elm, is available from
http://litvis.org. The design of litvis was driven by our eval-uation of literate programming (see Section 2) and the need to support low friction design exposition. Specifically, a Literate Visualization document authoring environment should:
• uselive documentswhere code development and narrative
hap-pen together encouraging evolutionary documentation.
• bequick and easyto author, being no more effort to use than a conventional programming environment.
[image:5.612.49.294.501.626.2]• providelive feedbackas a designer works to encourage reflec-tion and iterareflec-tion. This includes rendering of visualizareflec-tion, code linting, formatted output, design validation feedback and repre-sentation of branching narratives.
Textual narrative is added to a document using the lightweight markup language Markdown, which can be optionally styled with the addition of css in the ‘less’ styling language. This provides a low friction means of constructing formatted prose with a large existing user-base. Specification of visualizations can be made through fenced code
blocks in the pure functional language Elm (http://elm-lang.
org) and a statically typed wrapper for Vega and Vega-Lite [31]
specif-ically written for litvis (http://package.elm-lang.org/
packages/gicentre/elm-vega/latest). While
JSON/-JavaScript may be expressed directly, using Elm provides strict type checking and friendly compile-time error reporting to ensure that only valid JSON Vega/Vega-Lite specifications can be generated. Functional Elm allows code reuse and parameterisation so improving development speed and code clarity.
Vega-Lite and Elm were chosen to provide expressive visualization because their declarative nature makes specifying a visualization some-what self-documenting, freeing up narrative effort to focus on design exposition. Vega-Lite, based on Wilkinson’s grammar of graphics [37], enhanced with a parallel grammar of interaction and view composition operators, provides both a model of visualization specification familiar to many visualization designers and an expressiveness rich enough to allow design options to be widely explored. Elm-vega’s functional language provides a compact and composable interface to Vega and Vega-Lite making the handling of code dependencies by litvis a rel-atively straightforward task. The result of which is code execution that is independent of the order in which code blocks are placed in a litvis document, so satisfying the requirements for literate ‘artistic programming’ [35].
4.1 Code Referencing and Code Dependencies
The litvis author can chose how code blocks are referenced and ren-dered by parameterising code fencing blocks with display attributes. For example, the code block below represents a single line of Mark-down followed by code a block in the Elm language to create a simple histogram.
Firstly we create a frequency histogram of vehicle horsepower:
‘‘‘elm {v} barChart : Spec barChart =
let data =
dataFromUrl "https://vega.github.io/vega-lite/data/cars.json" []
enc = encoding
<< position X [ pName "Horsepower", pMType Quantitative ] << position Y [ pMType Quantitative, pAggregate Count ] in
toVegaLite [ data, enc [], mark Bar [] ] ‘‘‘
The{v}attribute followingelmindicating that in the formatted output, the result of executing the code should be visualized. Table 1 shows the full range of attributes available. By default all code blocks within a document share a common programming scope or
‘context’ implicitly nameddefault. This enables full ‘symphonic
projection’ [35] so that code blocks can be presented in any order to suit the narrative. Multiple contexts can be named each with their own scope allowing parallel but independent program scopes within the same document. This is useful when the litvis author wishes to explore alternative designs in a single document or document collection without the risk of name clashes. One common instance of controlled scoping of contexts is to make a code block independent of all others,
and for this we provide the attributesorsidingwhich is simply
a shortcut forisolated follows=default. This allows us to
document designs continuously and chronologically (‘the autonomist’), but also re-structure these documented records of activity to generate non-chronological narratives from these same records (‘the didacticist’). This is important if we are to avoid pitfall 31 of theDesign Study
Methodologywhen in the writing phase of a design study: “the order of presentation and argumentation ... should follow a logical thread that is rarely tied to the actual chronology of events due to the iterative and cyclical nature of arriving at full understanding of the problem (PF-31)” [32].
Table 1. litvis code block and reference attributes
Parameter Long name Effect
v visualize Render graphical output
l literate Store and display formatted code. Display can be
optionally hidden with=hidden
j json Display JSON specification sent to Vega/Vega-Lite
r raw Display unformatted raw output sent from Elm
s siding Create an independent code block
c context Name a code scoping context
follows Share a code block with a named context i isolated Make a code block isolated from all others
id Assign an id to a code block for later referencing
In addition to specifying attributes for code blocks, existing code
blocks may be referenced at any point in a document using aˆˆˆ
notation with a similar set of attributes (equivalent to Knuth’sidentifier
in his original WEB literate programming environment). This can be particularly useful when a rendering function is parameterised, with for example different views of a dataset, so that small multiples or user-selected views can be generated. Code block references can be made at any point in a document, so for example, the following could be used to generate sparklines within a paragraph of text:
‘‘‘elm {l=hidden} sparkline : String -> Spec sparkline groupName =
let config =
configure << configuration (coView [ vicoStroke Nothing, vicoHeight 15, ,→vicoWidth 80 ])
data =
dataFromUrl "data/trends.csv"
trans =
transform << filter (fiExpr ("datum.group == " ++ groupName))
enc = encoding
<< position X [ pName "x", pMType Quantitative, pAxis [] ] << position Y [ pName "y", pMType Quantitative, pAxis [], pScale [
,
→scZero False ] ] << color [ mStr "black" ] in
toVegaLite [ config [], data [], trans [], enc [], line [] ] ‘‘‘
We note that over time price of the first group of products appears to fluctuate : ,→ˆˆˆelm v=(sparkline "1")ˆˆˆ while the second group shows a clear decline: ,→ˆˆˆelm v=(sparkline "2")ˆˆˆ
Together these code referencing attributes provide a high degree of flexibility in the ordering of code blocks and the views of code pre-sented in the formatted output. Combined with narrative branching (see Section 6) this allows, for example, presentation of two parallel views of the same visualization implementation, one focusing on rendered output and design choices while another focusing on implementation de-tails. It addresses the concern raised by Keryet al.[13] that embedding alternative designs in conventional notebooks can lead to confusing narratives and so deter experimentation. Equally, design elements, such as opacity, shape and size encoding can be parameterised allowing al-ternative designs to be explored at little cost. To return to the questions we posed at the outset of this paper, a designer might document the same graphics in different ways in different documents intended for their design colleagues, collaborators and students.
5 NARRATIVESCHEMAS
The criticism of LP that there is insufficient support in providing ef-fective narrative, helps to motivate the use ofnarrative schemasto structure narrative sequencing and content. Structuring narrative has several distinct benefits. Primarily it is a form ofscaffolding[39] to direct design exposition, analogous to the use of rubrics and ‘fortune cookies’ [16] in pedagogy. Additionally the act of constraining nar-rative with enforceable rules may act as a driver for creativity and
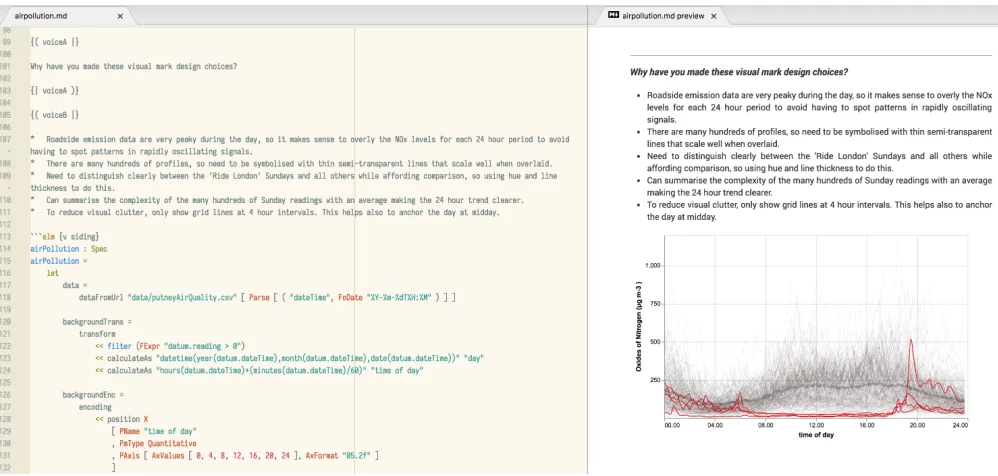
Fig. 6. The litvis software environment in the Atom editor. Code and narrative are typed in directly in the left panel and rendered output updates in the right panel. ‘voiceA’ and ‘voiceB’ labels reference a Socratic questioning narrative schema (see Section 5).
Lionnais [26]. Within the context of LV, the use of narrative schemas aims to provide guidance specifically targeted at visualization design rather than the more general literate programming. While not unique to visualization, providing narrative guidance is especially useful in a visualization culture where sharing the outputs of a visualization design is currently much more common than sharing the rationale behind the design. Litvis is provided with a set of schemas for common approaches to visualization design (described below and in Section 7). Most users of the system would simply link their documents to one or more of these existing schemas, which ensures, at little cost to the designer, that their narrative follows the structure defined in the schema. If it does not, the editor environment flags a warning with an appropriate error message just as it would if there were errors in their code. This can be considered analogous to unit and integration testing in software engi-neering, providing a benefit to the designer in prompting a systematic approach to design justification with minimal extra cost to the design process. The intention of the litvis design is to integrate the validation of visualization specification and narrative specification so they are seen as a single deeply coupled process.
A narrative schema can be considered a set of labeled elements of a narrative document accompanied by a set of rules that determine how those labels and content are used. It can be thought of as an analogue of schemas more usually found in declarative programming contexts such as JSON and XML schema. By allowing documents to be validated against a schema, we provide a more systematic and convenient way of testing the validity of some written text.
To allow community development and sharing of new schemas, they are designed to be stand-alone documents capable of being used
independently of litvis. They are defined in yaml (http://yaml.
org) documents comprising a set oflabels, somerulesthat determine how those labels may be used and cssstylingto determine how they are rendered within an LV document.
Consider for example the writing of a literate visualization document that usesSocratic questioningto explore design options and justifica-tions. The intention of Socratic questioning is to stimulate critical thinking in an accessible way [8], both directly by the designer(s) and later by others reading the document. At its simplest level, Socratic questioning can be considered a conversation between two voices using the dialectical method. One voice takes the role of the innocent ques-tioner (‘Socrates’), the other the defender of the design who responds
to the questioner.
A Socratic questioning schema, called ‘dialogue’ could be repre-sented as follows:
labels: - name: voiceA
paired:
htmlTemplate: <div class="voiceA">{{children}}</div> - name: voiceB
paired:
htmlTemplate: <div class="voiceB">{{children}}</div>
rules:
- description: Dialogue should alternate between voices. selector:
label: voiceA notFollowedBy:
selector: label: voiceA
- description: Dialogue should alternate between voices. selector:
label: voiceB notFollowedBy:
selector: label: voiceB
styling: css:|
.voiceA { font-weight: bold; }
.voiceB { font-style: italic; }
Once defined, labels are inserted into a standard markdown
docu-ment using{( labelName |}and{| labelName )}to fence
blocks of narrative. For example, some Socratic questioning markdown can be specified as
---narrative-schemas: - ./schemas/dialogue
---{( voiceA |}
But why are you showing these as a collection of small multiples and not overlaying ,→ them in a single chart?
{| voiceA )}
{( voiceB |}
While a single (superposed) visualization would allow precise comparison of ,→differences between main trendlines, the purpose isn’t to allow comparison ,→ of details (which fall within the error bounds of the data) but to ,→characterise the broad trends in each time period.
Small multiples also highlight the evolution of the trend over time that would be ,→lost in a single composite.
{| voiceB )}
structured form of Socratic questioning could be generated injecting specific questions such asWhat are you trying to achieve with this visu-alization?,Why have you chosen this data source and sample?,Why have you made these visual mark design choices?andTo what extent does your visualization meet your original objectives?. It composes the alternating voices of the dialogue schema with a set of ordering and con-tent rules for the SocraticvoiceArequiring an answer to each question in order to be a valid document. The full schema specification along
with other examples can be found athttp://litvis.org. Further
examples of narrative schema and their use with other visualization design models are explored in Section 7.
While it has always been possible for visualization authors to cre-ate documentation in any style, andlitvisfully supports this level of flexibility, there is often a lack of clear guidance on what might be an appropriate approach to take, which may be one of the reasons for the high proportion of undocumented code in notebook environments [30]. Where guidance on the decisions that should be taken is provided, as is the case in important papers that structure visualization design decisions [22, 24], what to document and how best to document it is often less well specified. And even when the documentation process is clear (e.g. [23, 27]), the act of documentation may be considered too burdensome to follow routinely. What narrative schemas offer is a flexible approach to document specification that can be light-touch or more prescriptive depending on need.
6 BRANCHINGNARRATIVES
Literate Programming and notebook environments ease the process of integrating textual narrative with executable code and rendered output. Yet in most cases, they do not address what is a common tension between an imposed linear structure of a single document to be read from top to bottom, and the non-linear way in which visualization design, implementation and use can evolve [13]. Sedlmairet al.observe that the linear chronology of development typically does not reflect the narrative sequence assembled for the purposes of argumentation and reflection [32]. Our approach to programming scope enables us to address their recommendation to reassemble chronological narratives in a reflective context through the use of branching narratives. In so doing we reduce the indirection (and therefore effort) between the act of designing and its articulation through design exposition. This also contributes to our efforts to improve the accountability of a visualization design by supporting the contemporaneous capture of design reflection and evaluation [19].
Rather than constructing monolithic notebook documents, we pro-pose routine use of parallel branching narratives that assemble and structure document trees. This can be helpful in any narrative that involves experimentation with alternative designs, and especially use-ful in visualization design where this is commonplace. Each branch in a tree can represent alternative potentially competing designs each with their own rationale. Or different branches may represent different views of a visualization and its surrounding narrative, for example with one view designed to elicit user feedback while another focuses on technical exposition. Parallel branches can fork from a common start point and be developed by different members of a design team for later comparison as part of the design process (e.g. [10, 20]). Selected branches sharing common code blocks may then later be assembled to form a synoptic reflection on some agreed final set of design choices, more closely matching the narrative of an academic design study during reflection and writing (as advocated by Sedlmairet al.[32]).
In addition to supporting incremental documentation and the syn-thesis of evidence into reflective documents, we can take advantage of branching narratives to produce specific reporting structures that support and reflect particular visualization design decision models. As Meyeret al.point out when introducing theNested Blocks and Guide-lines Model (NBGM), these offer different levels of formalism [22],
which can be captured inlitvisthrough different schemas. Schema
authors determine the different degrees of detail and complexity of rules required.
The NBGM itself is intended to capture the rationale and knowledge associated with visualization design decisions at a more granular level
than the originalNested Modelon which it is based [24]. It “strives to make explicit the design decisions and assumptions that process models tend to omit” [22]. We strive to support the documentation of those
decisions during design. The model’sblocksof knowledge and the
nestingandguidelinesthat associate them can be modelled in a simple
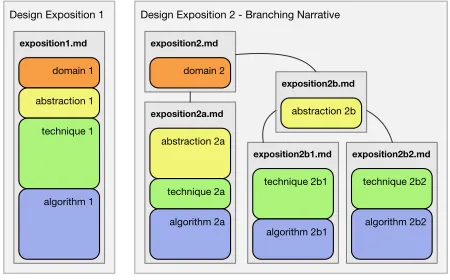
litvisnarrative schema, allowing us to capture and communicate design exposition through this terminology and structure. The schema can be used to validate the reporting of the process should we wish. The level, status and contribution of blocks can be recorded as required by the model and elm-vega graphical output used within the documents as part of the exposition – to visually assess algorithm performance or encoding [24], or to describe and demonstrate abstractions. The status, contribution and type of guideline can be recorded, along with a description and the blocks that it links. A linear design exposition might use a single document to describe blocks and guidelines (Figure 7, left). But we can use branching narratives to captureguidelines’more complex relationships between blocks and guidelines through litvis, implementing the model with some sophistication (Figure 7, right).
Design Exposition 2 - Branching Narrative Design Exposition 1
exposition1.md
domain 1
abstraction 1
technique 1
algorithm 1
exposition2.md
domain 2
exposition2a.md
abstraction 2a
technique 2a
algorithm 2a
exposition2b1.md
technique 2b1
algorithm 2b1 exposition2b.md
abstraction 2b
exposition2b2.md
technique 2b2
[image:8.612.329.554.244.384.2]algorithm 2b2
Fig. 7. Schematic of NBGM analysis presented as a structured design narrative in a singlelitvisfile describing four linked blocks (left) and as a branching narrative in multiple files (right). Outer grey rectangles are separate systems analysed with the model. Inner grey rectangles arelitvisfiles used to capture the narratives that describe their design. Adapted from Figure 4. of [22].
We can of course produce these structures as designs are developing or do so retrospectively as guidelines may be established through the writing process [32]. This approach affords powerful tools through which we can describe and document “the formalisms afforded by the NBGM for capturing and elucidating visualization design decision rationale” [22].
Within litvis, document collections are represented as a directed acyclic graph with separate branches each represented as their own markdown file (Figure 7, right). Child branches are linked to a parent with thefollowskeyword in the frontmatter of the document. Parent documents are identified by their file name. This provides a simple mechanism for document authors to link files into arbitrary tree struc-tures. Code scoping and referencing (see Section 4.1) allows precise control over the elements of code that are shared between branches.
7 EXAMPLES
In this section we consider some examples of different approaches to using literate visualization to begin to assess the role that integrated narrative and code execution can play in the visualization design pro-cess. The examples range from light-touch prompts to reflect on design choices (Section 7.1), through more formal design evaluation frame-works (Section 7.2) to broader outlooks on visualization approaches (Section 7.3). In all cases, the full litvis documents and schemas can be
found athttp://litvis.org.
7.1 Visualization Idioms
and therefore validate the idiom [24] both to themselves and others. To assist in that process of evaluation and justification, the designer could link their document to theidiomnarrative schema (available at
http://litvis.org). The cost of linking to the schema is min-imal (one linking statement in the header of the document) and the schema will generate four design prompts,Aim,Description,Architypes
[image:9.612.310.549.83.388.2]andLimitiations. The editor environment will prompt the designer with a warning message if any sections under each of these headings in the document are left empty. The schema forces the designer to declare the purpose of their proposed idiom, explain how to read the graphic (‘description’ and ‘architypes’) and to consider the limitations of their design. In this light-touch schema, there is no prescription as to what should be said under each of these headings other than there must be some content. In this context the schema acts simply a low friction aide-m´emoire encouraging routine good practice with minimal extra documentation burden. This might prompt both internal reflection dur-ing the design process and discussion between designers and others at early stages of development. The part of the litvis document that includes the designer’s response to these prompts (see Figure 8) can form its own branch in the document tree structure in parallel with an-other branch that reuses the implementation code and applies it to some real-world data. This allows two distinct narratives to be generated from the same design process, one focussing on the visualization design rationale, the other on using the visualization to perform data analysis (akin to the more conventional use of computational notebooks).
Fig. 8. Valid design exposition in litvis using the ‘idiom’ narrative schema
7.2 Visualization Algebra
Light-touch narrative evaluation through schemas need not mean infor-mal validation. More forinfor-mal models may be incorporated into literate visualization practice such as those of project-wide scope [17, 22, 32] or models focussed on parts of the visualization design [24].
In the case of encoding Munzner recommends justifying candidate designs against known principles of perception and cognition [24]. This could be structured against a checklist such as Zuk and Carpendale’s potential heuristics [41], or key tasks such as Cleveland’sdetection,
assemblyandestimation[4].
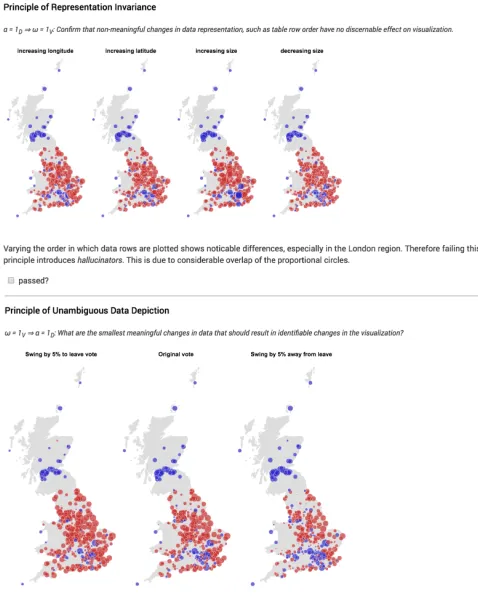
Alternatively, Kindlmann and Scheidegger [14] provide a theoretical framework for considering the relationship between data, its computa-tional representation and its graphical expression. By representing the transformations between these three stages algebraically, they provide a mechanism for identifying both undesirable transformations (‘hallu-cinators’ and ‘misleaders’) as well as data-insensitive transformations (‘confusers’ and ‘jumblers’). Questions of the existence of these unde-sirable transformations between the data and visualization spaces can be expressed as logical predicates and so incorporated into the auto-mated validation process. Figure 9 shows formatted litvis output based on an ‘algebra’ schema that contains user-editable checkboxes for each of these predicates. Documents that haven’t had all boxes checked
[image:9.612.49.291.316.475.2]by the designer(s) fail the automated schema validation process in a similar way to failing a test in a unit testing framework. While the evaluation process may be more formal, the intention of the schema is to minimise the documentation effort required to perform the evaluation and so reduce the friction of design exposition.
7.3 Feminist Data Visualization
In contrast to the previous examples, branching narratives and narrative schema can be used to reorientate the entire approach to visualization. This is assisted by adopting some established or proposed methodology, framework or philosophy. The manifesto for feminist visualization outlined by D’Ignazio and Klein [7] represents one such perspective. Their recommended approach is based upon critical perspectives drawn from the digital humanities prompted by a set of reflective questions in six broad categories:‘rethink binaries’,‘embrace pluralism’, ‘ex-amine power’,‘consider context’,‘legitimise embodiment and affect’, and‘make labour visible’. A narrative schema to reflect this outlook injects questions in each of these categories into the litvis document (seehttp://litvis.orgfor the complete schema). Examples of the questions automatically generated under‘rethink binaries’theme include
Process:Do my data impose categorisations that deny the multiplicity of the phenomena being visualized?
Process:How do I register characteristics that do not easily fall into my classification?
Output:How do I communicate the limits of my categories in the final representation?
Output:How do I allow the user to refactor categories presented for view?
The cost of linking to the schema and providing text under each question is minimal. The effort required in considering these questions may be more significant though. But by at least reflecting on such questions as part of the routine of the data visualization process, the intention is to encourage new approaches to visualizaton design built upon a sound theoretical foundation that may be shared with others. The act of enriching some visualization production with narratives reflecting these perspectives is itself an example of the ‘make labour visible’ principle as those perspectives and the assumptions they may embody are exposed for critical analysis.
8 CONCLUSION
By developing litvis, we have created a programming and documenta-tion environment that embodies our ideas of literate visualizadocumenta-tion that is compatible with the emergence of the ‘computational notebook’ as a means to code and share narratives. While we frame the contribution in terms of visualization study and practice, it could support any de-sign process that is characterised by non-linear experimentation, that benefits from capturing the design process as it happens and where designers seek guidance in structuring the narratives that describe their practice.
Litvis itself comprises a functional, declarative programming in-terface to visualization specification (‘elm-vega’); pluggable literate visualization modules for the widely used editors Atom and Visual Studio Code; styled formatting of text and code; and live code and document linting, branch linking and validation. Together they provide a platform for supporting the process of literate visualization and de-velopment of a rich corpus of design expositions and schemas. The software and the concepts outlined in this paper are readily adaptable to other visualization and notebook environments.
With emergence of notebook environments such as Observable, Jupyter and R-Notebook we are seeing new opportunities being taken up to integrate programming input, rendered output and narrative. Within the academic visualization community we are also seeing a trend to-wards people publishing their work not just as papers, but with code and datasets in repositories such as GitHub. Together these allow us to explain our visualization, enhancing the way visualization develops as an academic discipline by providing richer and more accountable descriptions of the rationale behind the approaches we take, the reason-ing we adopt and the interpretation of the findreason-ings we generate. Such
descriptions are likely to be useful to academic colleagues, collabo-rators in application domains, designers and students of visualization. They offer important opportunities for achieving reliability, convinc-ing colleagues, engagconvinc-ing with collaborators, explorconvinc-ing and improvconvinc-ing designs, transferring designs across contexts, and for education. This goes beyond the more restrictive view of a ‘reproducibility crisis’ [6] more suited to quantitative experimental sciences.
The need for a more formal consideration of how we may undertake visualization in this context and what opportunities it offers has led to our proposal for a literate visualization framework. It embraces not just benefits of a richer narrative to accompany visual renderings as an out-put, but provides assistance in the process of generating that narrative. In particular it recognises that much visualization development is non-linear, with parallel competing designs that need to be evaluated, and alternative views of our designs that need to be managed concurrently. It also recognises that we cannot rely solely on the ability of individuals to author effective narrative without guidance. Scaffolding that process with narrative schemas enables more structured approaches to be taken and evaluated while also exposing the nature of such structures to eval-uation and critique. And finally, and importantly, we must recognise that previous attempts to formalise the documentation of design and software development are often not taken up routinely because they are perceived as too much of an extra burden that outweighs the benefit of doing so. An effective literate visualization environment must therefore make the cost of enriching the accounts of our visualization design low, so that all are encouraged and able to do so. Our design is intended to achieve this and that our own use of the system is positive, but this is unproven. We have however developed a system that can be used and evaluated to establish the extent to which we have lowered the friction of the DE frequency domain and allow some under-supported areas of that space to be explored.
There remain a number of challenges for future work in the field of literate visualization. On a technical level we need to consider how more of the environments in which people design and implement visu-alization are adaptable to the literate visuvisu-alization approach. We also see value in enriching the interaction and instrumenting capabilities of litvis so that richer forms of exposition may be captured and shared both within and outside the litvis environment. And we need to con-tinue to lower the cost of working in a literate visualization context. For example, how might use of higher level visualization software such as Tableau take advantage of a literate visualization approach? How can a strongly collaborative working environment conduct literate visualization?
The concept of the narrative schema may provide an opportunity to benchmark particular approaches to design and its documentation, but it is far from guaranteeing Knuth’s vision of literate programming having all the depth and nuance of conventional literature. Future work could consider how we might enhance the scaffolding that leads to rich, effective and accountable visualization narrative. Translating some of the existing models of visualization design into validatable schema provides an interesting avenue for future research. There is work to be done in developing schemas to support meta-analysis, in other words to ease the process through which we can compare and build-upon existing collections of literate visualization. We also see great potential in an educational context, where both educators and students have a framework within which to express and evaluate thoughts on visualization design. By lowering the cost of design exposition, new opportunities emerge for a multitude of shared dialogues between all those with an interest in evolving the process of visualization.
ACKNOWLEDGMENTS
REFERENCES
[1] K. Agaram. Literate programming: Knuth is doing it wrong. http: //akkartik.name/post/literate-programming. Accessed: 2018-03-19.
[2] M. Bostock. Observable. https://beta.observablehq.com.
Accessed: 2018-03-19.
[3] chipsy. Why did literate programming not catch on. https://news. ycombinator.com/item?id=10069748. Accessed: 2018-03-19. [4] W. S. Cleveland. A model for studying display methods of statistical graphics.Journal of Computational and Graphical Statistics, 2(4):323– 343, 1993.
[5] CoffeeScript. Literate coffeescript. http://coffeescript.org/ #literatel. Accessed: 2018-03-19.
[6] O. S. Collaboration. An open, large-scale, collaborative effort to estimate the reproducibility of psychological science.Perspectives on Psychologi-cal Science, 7(6):657–660, 2012.
[7] C. D’Ignazio and L. F. Klein. Feminist data visualization. InWorkshop on Visualization for the Digital Humanities (VIS4DH), Baltimore. IEEE, 2016.
[8] L. Elder and R. Paul. The role of socratic questioning in thinking, teaching, and learning.The Clearing House, 71(5):297–301, 1998.
[9] M. Giuca. Literate programming is a terrible idea.
https://unspecified.wordpress.com/2010/06/04/ literate-programming-is-a-terrible-idea/. Accessed: 2018-03-19.
[10] S. Goodwin, J. Dykes, S. Jones, I. Dillingham, G. Dove, A. Duffy, A. Kachkaev, A. Slingsby, and J. Wood. Creative user-centered visu-alization design for energy analysts and modelers.IEEE transactions on visualization and computer graphics, 19(12):2516–2525, 2013. [11] S. P. Jones. The haskell 98 report: Literate comments. https:
//www.haskell.org/onlinereport/literate.html.
Ac-cessed: 2018-03-19.
[12] JupyterLab. Jupyterlab notebook. http://jupyterlab.
readthedocs.io/en/stable/user/notebook.html.
Ac-cessed: 2018-03-19.
[13] M. B. Kery, M. Radensky, M. Arya, B. E. John, and B. A. Myers. The story in the notebook: Exploratory data science using a literate programming tool. InProceedings of the 2018 CHI Conference on Human Factors in Computing Systems, p. 174. ACM, 2018.
[14] G. Kindlmann and C. Scheidegger. An algebraic process for visualiza-tion design.IEEE transactions on visualization and computer graphics, 20(12):2181–2190, 2014.
[15] D. E. Knuth. Literate programming.The Computer Journal, 27(2):97–111, 1984. doi: 10.1093/comjnl/27.2.97
[16] C. Kulkarni, K. P. Wei, H. Le, D. Chia, K. Papadopoulos, J. Cheng, D. Koller, and S. R. Klemmer. Peer and self assessment in massive online classes. InDesign thinking research, pp. 131–168. Springer, 2015. [17] H. Lam, M. Tory, and T. Munzner. Bridging from goals to tasks with
design study analysis reports. IEEE transactions on visualization and computer graphics, 24(1):435–445, 2018.
[18] D. Lloyd and J. Dykes. Human-centered approaches in geovisualization design: Investigating multiple methods through a long-term case study.
IEEE Transactions on Visualization and Computer Graphics, 17(12):2498– 2507, 2011.
[19] N. McCurdy, J. Dykes, and M. Meyer. Action design research and visual-ization design. InProceedings of the Sixth Workshop on Beyond Time and Errors on Novel Evaluation Methods for Visualization, pp. 10–18. ACM, 2016.
[20] S. McKenna, D. Mazur, J. Agutter, and M. Meyer. Design activity frame-work for visualization design. IEEE Transactions on Visualization and Computer Graphics, 20(12):2191–2200, 2014.
[21] W. Meulemans, J. Dykes, A. Slingsby, C. Turkay, and J. Wood. Small multiples with gaps. IEEE transactions on visualization and computer graphics, 23(1):381–390, 2017.
[22] M. Meyer, M. Sedlmair, P. S. Quinan, and T. Munzner. The nested blocks and guidelines model.Information Visualization, 14(3):234–249, 2015. [23] T. P. Moran and J. M. Carroll. Design rationale: Concepts, techniques,
and use. L. Erlbaum Associates Inc., 1996.
[24] T. Munzner. A nested model for visualization design and validation.IEEE transactions on visualization and computer graphics, 15(6), 2009. [25] F. Perez and B. E. Granger. Project jupyter: Computational narratives as
the engine of collaborative data science.http://archive.ipython.
org/JupyterGrantNarrative-2015.pdf. Accessed: 2018-03-19.
[26] R. Queneau. Exercises in style, vol. 513. New Directions Publishing, 1981.
[27] W. C. Regli, X. Hu, M. Atwood, and W. Sun. A survey of design rationale systems: approaches, representation, capture and retrieval.Engineering with computers, 16(3-4):209–235, 2000.
[28] J. C. Roberts, C. Headleand, and P. D. Ritsos. Sketching designs using the five design-sheet methodology.IEEE Transactions on Visualization and Computer Graphics, 22(1):419–428, 2016.
[29] RStudio. R markdown.https://rmarkdown.rstudio.com.
Ac-cessed: 2018-03-19.
[30] A. Rule, A. Tabard, and J. Hollan. Exploration and explanation in com-putational notebooks. InACM CHI Conference on Human Factors in Computing Systems, 2018.
[31] A. Satyanarayan, D. Moritz, K. Wongsuphasawat, and J. Heer. Vega-lite: A grammar of interactive graphics.IEEE Transactions on Visualization and Computer Graphics, 23(1):341–350, 2017.
[32] M. Sedlmair, M. Meyer, and T. Munzner. Design study methodology: Reflections from the trenches and the stacks.IEEE transactions on visual-ization and computer graphics, 18(12):2431–2440, 2012.
[33] B. Shneiderman and C. Plaisant. Strategies for evaluating information visualization tools: multi-dimensional in-depth long-term case studies. In
Proceedings of the 2006 AVI workshop on BEyond time and errors: novel evaluation methods for information visualization, pp. 1–7. ACM, 2006. [34] D. Spinellis. Code documentation.IEEE software, 27(4):18–19, 2010. [35] J. Taylor. Literate programming, md: How to treat and
pre-vent software project mess. https://leanpub.com/
literate-programming-md. Accessed: 2018-03-19.
[36] L. Tierney. How we made the ”Melting Antartica”.https://source. opennews.org/articles/melting-antarctica. Accessed: 2018-03-19.
[37] L. Wilkinson.The grammar of graphics. Springer Science & Business Media, 2006.
[38] S. Wolfram. What is a computational essay?
http://blog.stephenwolfram.com/2017/11/ what-is-a-computational-essay. Accessed: 2018-03-19. [39] D. Wood, J. S. Bruner, and G. Ross. The role of tutoring in problem
solving.Journal of child psychology and psychiatry, 17(2):89–100, 1976. [40] J. Wood, R. Beecham, and J. Dykes. Moving beyond sequential design: Reflections on a rich multi-channel approach to data visualization.IEEE transactions on visualization and computer graphics, 20(12):2171–2180, 2014.