Distributed Intelligent Illumination Control in the
Context of Probabilistic Graphical Models
M. Cosovic, T. Devaja, D. Bajovic, J. Machaj, G. McCutcheon, V. Stankovic, L. Stankovic, D. Vukobratovic
Abstract—Lighting systems based on light-emitting diodes (LEDs) possess many benefits over their incandescent counterparts including longer lifespans, lower energy costs, better quality of light and no toxic elements, all without sacrificing consumer satisfaction. Their lifespan is not affected by switching frequency allowing for better illumination control and system efficiency. In this paper, we present a fully distributed energy-saving illumination control strategy for the arrangements of a lighting network which consists of a group of LEDs and user-associated devices. All LEDs have a dimming feature in order to meet the illumination requirements of every user. In order to solve the optimization problem, we are using a distributed approach that utilizes factor graphs and the belief propagation algorithm. Using probabilistic graphical models to represent and solve the system model provides for a natural description of the problem structure, where user devices and LED controllers exchange data via line-of-sight communication.
Index Terms—LED System, Distributed Control, Newton’s Method, Factor Graphs, Belief Propagation
I. INTRODUCTION
Lighting systems based on LEDs are becoming dominant lighting solution due to improved energy efficiency, better quality of light and longer life span. According to European LED quality charter report, lighting provides for 15−17 %
of the total energy consumption [1]. Similarly, US energy information administration estimated the US residential and commercial sector used around 273 trillion Wh of electricity for lighting in 2017, or about7 %of the total electricity consumed [2]. Globally, there are over 33 billion light sources spending 2650 trillion Wh of electrical energy per year, which is 20 %
of the total global electricity production [3].
Replacement of incandescent lamps by LEDs will reduce the lighting consumption to about 5−8 % of total global consumption. LED technology offers superior control, while LEDs lifespan is not affected by frequent on/off switching, making them suitable for intelligent indoor lighting systems [4]–[6]. Intelligent LED systems usually use dimming feature integrated in a local controller, which can be activated based on local sensor inputs (e.g., daily light intensity).
M. Cosovic is with Department for Electric Power Engineering, University of Sarajevo, Bosnia and Herzegovina (e-mail: [email protected]). T. Devaja, D. Bajovic and D. Vukobratovic are with Department of Power, Electronic and Communications Engineering, University of Novi Sad, Serbia (e-mail:{tijana.devaja, dejanv, dbajovic}@uns.ac.rs). J. Machaj is with Department of Telecommunications and Multimedia, University of Zilina, Slovakia (e-mail: [email protected]). G. McCutcheon is with Ramboll UK, Glasgow, UK (e-mail: [email protected]). V. Stankovic and L. Stankovic are with Department of Electronic and Electrical Engineering,University of Strathclyde, Glasgow, (e-mail:{vladimir.stankovic, lina.stankovic}@strath.ac.uk).
This paper has received funding from the European Unions Horizon 2020 research and innovation programme under the Marie Skodowska-Curie grant agreement No 734331.
Different illumination control approaches exist, depending on the system architecture and optimization methods. Authors in [4], [7], presented the illumination control problem as a tradeoff between energy efficiency and user needs. The utility function is assigned to every user device (UD) with respect to the light intensity. In [5], authors present a distributed energy-saving illumination strategy of a network of LEDs and UDs communicating with each other in order to optimize illumination using the message-passing algorithms based on distributed optimization. Authors in [8] analyzed the energy-efficient LED system in the presence of daylight conditions. In [9], the illumination control problem was studied, where users are equipped with portable wireless illumination sensors. Approach where sensors can detect the presence of a user in the office is proposed in [10], while in [11] authors used advanced machine learning algorithms. In [12], a lighting system is described which formulates illumination control as a linear programming problem that aims to both minimize energy usage and meet occupants’ preferences. Authors in [13] proposed illumination balancing algorithm which achieves successful control even in the case where decentralized control fails. In [14], an intelligent household LED system is described that considers energy efficiency and user satisfaction by utilizing sensors and wireless communication technology.
In this paper, we propose solving the linear optimization problem that provides desired level of illumination with the minimal energy consumption in a distributed manner using factor graphs and belief propagation (BP) algorithm. To achieve this goal, we apply the Gaussian BP algorithm, which is recognized as an efficient distributed linear optimization solver with the polynomial-complexity [15], [16]. Using probabilistic graphical models to represent and solve the system model provides for a very natural description of the problem structure, where LEDs and UDs directly exchange data via point-to-point line-of-sight wireless links. Even if implemented in the centralized framework, it can be flexibly matched to distributed computation resources. The closest to our work is the message-passing solution proposed in [5], however, we use the BP-based approach as it is more flexible and converges faster than alternating direction method of multipliers (ADMM).
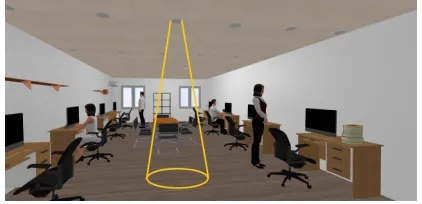
Fig. 1. The LED system in the office environment.
presented in Sec. VI. The paper is concluded in Sec. VII.
II. THEDIMMABLELED LIGHTINGSYSTEMMODEL
We consider a dimmable LED lighting system with n ceiling LEDs associated with dimming vector y∈Rn. Each
LED is equipped with a controller that is able to control the dimming levelyi of thei-th LED, adapting its light intensity.
The LED illuminates at the maximum light intensity ifyi= 1
(i.e., LED is set to the maximum power), while yi = 0
indicates that the LED is turned off. Parallel to the ceiling is a workspace plane over which spatial illumination is of interest, as shown in Fig. 1. Illuminance distribution w∈Rm
on the two-dimensional workspace plane, with muser devices with illumination sensors able to measure LED light intensity (i.e., UDs), can be described as follows:
w=Hy+p, (1)
whereH∈Rm×n is the illuminance or channel gain matrix,
andhij denotes the illuminance within the zone of thej-th UD
whenyi= 1, while all other LEDs are turned off. The vector
p∈Rmdenotes daylight intensity measured by sensors, where
pj represents daylight intensity received at the j-th UD zone
and it is independent of the LED illumination [4]. Without loss of generality, in the rest of the paper, we observe the model where only the LED illumination exists, i.e., wherep=0.
In a usual scenario, the desired level of illumination at UDs should be achieved with the minimal energy consumption. Energy consumption of a lighting system can be expressed as a function of the dimming vector [4]:
f0(y) =
Ty+e0
T1+e 0
=qTy+e, (2)
where∈Rn represents the maximum power of LEDs in the
system ande0denotes standby energy consumed by the lighting system. Additionally, we define the normalized power vector q∈Rn, whereq
i=i/(T1+e0), whilee=e0/(T1+e0). The described system leads to the convex optimization problem that includes inequality constraints:
minimize
y q
Ty+e
subject to Hyb
0y1,
(3)
where b∈ Rm denotes user illuminance requirements. The
first constraint represents a relaxation of the target illuminance requirements, allowing the lighting intensity above the
required, while the second constraint defines dimming level limits. We also assume that each LED controller has data transfer capabilities via line-of-sight communication with UD, and vice versa, where the latter is, for convenience, realized in the non-visible (e.g. infrared) part of the optical spectrum.
III. THEBARRIERMETHOD
In this section, we utilize the barrier method to solve the linear programming problem (3). We choose the barrier method due to its simplicity over the primal-dual interior-point method. To describe the procedure of findingy that minimizesf0(y)among allythat satisfy constraints, it is necessary to reformulate the inequality constrained problem as an equality constrained problem to which Newton’s method can be applied [17, Sec. 11.2]. By introducing the slack variable vectors∈Rm, inequality constraintHybturns
into the equality constraint Hy−s = b. Thus, instead of solving (3), we consider the equivalent problem:
minimize
y q
Ty+e
subject to Hy−s=b
0y1
0s ∞.
(4)
Using the notation:
A=
H −I
; c=
q 0
; x=
y s
, (5)
where I is the m×m identity matrix, and 0 is the vector of zeros of dimension m, and applying logarithmic barrier function to replace inequality constraints of (4), we obtain:
minimize
x t(c
Tx+e)− k X
i=1
[lnxi+ ln(ui−xi)]
subject to Ax=b,
(6)
where ui denotes the upper bound of the inequalities related
withxi,i= 1, . . . , k, andk=n+m.
To summarize, the optimization problem (6) allows for application of Newton’s method. However, it is an approximation of the original problem (3), where the quality of the approximation improves as the parameter t grows. Unfortunately, when the parametert is large, the function is difficult to minimize by Newton’s method, since its Hessian varies rapidly near the boundary of the feasible set [17, Sec. 11.2.1].
Using Karush-Kuhn-Tucker conditions [18], it is easy to show that the Newton step ∆x and the corresponding dual variablevsatisfy the following system of linear equations:
D AT A 0
∆x v
=−
tc−d Ax−b
, (7)
where:
D= diag[x−21 + (u1−x1)−2, . . . , x−2k + (uk−xk)−2]
d= [x−11 −(u1−x1)−1, . . . , x−1k −(uk−xk)−1]T.
side contains the blockAx−b, which is the residual vector for the linear equality constraints, and ifx is strictly feasible then the residual vanishes (i.e.,Ax−b=0) [17, Sec. 10.3]. Note that if yis feasible, then xis also feasible, because we can takes=Hy−b. Newton’s method in each iteration step ν computes Newton step, and using the line search with a step size η >0, updates the state vector:
x(ν+1)=x(ν)+η∆x(ν). (8)
The iteration loops are repeated ν ={1, . . . , νmax} until the stopping criterion is met, where Newton decrement is commonly used stopping criterion.
IV. THEBARRIERMETHODUSINGBELIEFPROPAGATION
In this section, we first discuss methods to transform the problem in (7) into a linear least-squares (LS) form. Then, we consider restating the resulting LS problem as a maximum-likelihood problem that can be efficiently solved utilizing factor graphs and BP algorithm.
In general, we can solve the optimization problems (7) using a generic method (direct matrix inversion) or a block elimination, where xcan be a feasible or infeasible point1. As
an interesting fact, each of the approaches for solving (7) will produce a factor graph with different convergence properties. Despite the fact that the block elimination has a much smaller computational cost than the cost of the generic method [17, Sec. 10.4], we are interested in both methods, due to different convergence properties of the BP algorithm. Next, we observe LS problems of the feasible/infeasible generic and feasible/infeasible block elimination method.
• Using theinfeasible generic method, we simply obtain a linear LS in the form:
minimize ∆x,v
D AT A 0
∆x v
−
d−tc b−Ax
2
2
. (9)
• To recall, thefeasible generic methodreduces to (9), where the blockb−Axvanishes.
• Using the infeasible block elimination method, we compute the dual variable v = v1 − v2 by solving following LS problems:
minimize
v1
||D−1/2(ATv1−Dx−d+tc)||22
minimize
v2
||AD−1ATv2−b||22.
(10)
• A simpler LS form is obtained for the feasible block
elimination method:
minimize
v ||D
−1/2(ATv+tc−d)||2
2. (11)
Note that once the dual variable vis determined using the block elimination, the Newton step ∆x is obtained as follows:
∆x=D−1(d−tc−ATv). (12)
Authors in [15], [19] show that the linear LS problem can be efficiently solved using Gaussian BP algorithm, and if the
1With a slight abuse of terminology, hereinafter we use terms
feasible/infeasible generic method and feasible/infeasible elimination method.
algorithm converges, then the fixed point represents a solution of an equivalent LS problem. More precisely, we proposed in [19] how Gaussian BP can be applied as part of the two-level (inner τ and outer ν) iteration loops for solving non-linear problems akin to Gauss-Newton method, where the inner loop corresponds to the Gaussian BP that solves a linear LS problem. Let us consider, for the time being, the independent system of linear equations:
g=f(z) +r, (13)
whereris an artificial uncorrelated noise with independent and identically distributed entries, and assume that eachri follows
a zero-mean Gaussian distribution with the same variance, e.g.,r∼ N(0,I). Then, the solution of (13) can be found by solving the following LS problem:
minimize
z ||Fz−g||
2
2, (14)
where F is the coefficient matrix for our system (13), with a full column rank. Further, the solution of the LS problem (14) can be reformulated as an equivalent maximum likelihood problem that can be solved via maximization of the likelihood function:
L(g|z) =Y i
N(gi|fi(z), σi2). (15)
Due to the fact that any UD is usually illuminated by only a few surrounding LEDs, the functionfi(z)depends on a typically small subset of state variablesz. Hence, the likelihood function can be factorized into factors affecting small subsets of state variables.This fact motivates solving the problem scalably
and efficiently using probabilistic graphical models.
From the factorization of the likelihood expression (15), one easily obtains the factor graph. The variableszdetermine the set of variable nodesZ, and the set of factor nodesFis defined according to likelihood functionsN(gi|fi(z), σi2). The factor
node connects to the variable node if and only if the variable is an argument of the corresponding functionfi(z). In a nutshell, the structure of the factor graph reflects the structure of the matrixF. More precisely, each row of the matrixFcorresponds to one factor node, while columns, according to the vectorz, define variable nodes. A factor node connects to a variable node if and only if the corresponding coefficient of the matrix row is nonzero. Deriving expressions for BP messages exchanged over the factor graph follows similar steps as in [19]. Each message exchanged in Gaussian BP is completely represented using mean and variance. The BP solution of z(ν,τmax) = z(ν) in each outer iterationν is obtained via the iterative BP algorithm τ ={1, . . . , τmax}, thereby forming the inner iteration loop. When the BP converged in the one outer iteration loop ν, we update the variables and repeat the process until the stopping criterion is met.
V. THEPHYSICALINTERPRETATION OFMODELS
associated with LEDs and UDs are mostly defined according to the physical system. The i-the LED controller contains information about the i-th column of the channel gain matrix H, the normalized power qi, dimming level yi, with
associated Newton step ∆yi (artificial parameter), and
dimming limits 0≤yi ≤1. Thej-th UD is associated with
the j-th row of the channel gain matrix H and user illuminance requirement bj. Additionally, artificial parameters
that UD contains are information related to the slack and dual variablessj,∆sj,0≤sj ≤ ∞andvj.
LEDy1
h11, h21, . . . , hm1
y1,∆y1, q1
0≤y1≤1
· · ·
LEDyn
h1n, h2n, . . . , hmn
yn,∆yn, qn
0≤yn≤1
UDw1
h11, h12, . . . , h1n
s1,∆s1, v1, b1
0≤s1≤ ∞
· · ·
UDwm
hm1, hm2, . . . , hmn
sm,∆sm, vm, bm
[image:4.612.337.536.182.372.2]0≤sm≤ ∞
Fig. 2. Data structure and communication patterns between LEDs and UDs relative to the physical and optimization models.
It can be noted that physical models (1) and (3) were transformed and extended to get LS problems (9) - (11), along with (12). For this purpose, we give a detailed analysis of factor graphs that can be constructed according to different LS problems. Essentially, the resulting factor graph, through Fandg, should preserve and sustain communication and data structure associated with LEDs and UDs. More precisely, each factor node must be defined based on recipes given in Fig. 2. The generic method (9) produces the same matrix F for the infeasible and feasible problem. Consequently, the core structure of the factor graph will be the same, with variable nodes Z = {∆Y,∆S,V} and three different sets of factor nodes F={Fu,Flu,Ful}:
1) The factor node fu,j∈ Fu is defined locally according to
the corresponding UD parameters, and connects variable nodesvj∈ V and∆sj ∈∆S.
2) The factor nodeflu,i∈ Flu is defined locally according to
the corresponding LED parameters, and connects the variable node∆yi∈∆Y with the group of variable nodes
Vi ⊆ V, reflecting line-of-sight illumination and
communication structure between the LED and the set of neighboring UDs.
3) The factor node ful,j ∈ Ful connects the variable node ∆sj∈∆S with the group of variable nodes∆Yj⊆∆Y,
reflecting the line-of-sight illumination/communication relationship between the UD and the set of surrounding LEDs. For the feasible problem, factor node can be defined locally according to the corresponding UD, while for the infeasible problem, additional communication overhead is required, where before each outer iteration loop ν, LEDs need to send Yj⊆ Y to the corresponding
UD. Note that Y is defined by the vector y.
To summarize, the feasible/infeasible generic method preserves and sustains the structure given in Fig. 2 and allows for application of fully distributed message-passing algorithms according to the physical structure of the problem.
Example 1(The probabilistic model for the feasible/infeasible
generic method). In this toy example, we observe two LEDsy1
andy2, where both LEDs communicate with UDs w1 andw2.
The set of factor nodes consists ofFu={fu,1, fu,2},Flu=
{flu,1, flu,2}and Ful={ful,1, ful,2}.
2 v 1 v 1
s
∆ ∆s2
2 y ∆
1 y ∆
2
y
LED
1
y
LED 1
y
1
s
1
w
UD UDw2
2
y
2
s
2
lu,
f 1
lu,
f
2
ul,
f 1
ul,
f
2
u,
f 1
u,
[image:4.612.73.279.189.320.2]f
Fig. 3. The example of probabilistic model for the feasible/infeasible generic method.
The output of the inner iteration loop provides the values of
variable nodes Z = {∆y1,∆y2,∆s1,∆s2, v1, v2}. Then,
using (8), we update variables{y1, y2, s1, s2} and repeat the
process until the stopping criterion is met. Finally, after the algorithm converges, we obtain optimal values of dimming
levels{y1, y2}. The communication overhead for the feasible
problem contains only BP messages, while the infeasible problem additionally requires sending values of dimming
levels {y1, y2} to the corresponding UDs for the purpose of
defining factor nodesFul in each outer iterationν.
The infeasible block elimination method produces two LS problems (10), causing the existence of two disconnected factor graphs. The first factor graph, that reflects the structure of the matrixF=D−1/2AT, preserves the pattern structure given in
Fig. 2. In contrast, the second factor graph, described byF=
AD−1AT, compromises the physical pattern of data transfer between LEDs or UDs. Consequently, we cannot represent the infeasible block elimination method via suitable factor graph representation, thus we do not consider it in this paper.
The feasible block elimination method produces the factor graph according toF=D−1/2AT andg=D−1/2(tc−d), with variable nodes Z =V, and two different sets of factor nodesF={Fu,Flu}:
1) The factor nodefu,j ∈ Fu is defined locally according to
the corresponding UD parameters, and connects variable nodevj ∈ V.
2) The factor nodeflu,i∈ Flu is defined locally according to
variable nodes Vi ⊆ V, following the line-of-sight
illumination/communication relationship between the LED and neighbouring UDs.
This model along with (12) also preserves and sustains structure given in Fig. 2.
Example 2 (The probabilistic model for the feasible block
elimination method). In this toy example, we observe three
LEDsy1, y2andy3, where UDsw1andw2communicate with
y1, y2 and y2, y3, respectively. The set of factor node consists
ofFu={fu,1, fu,2} andFlu={flu,1, flu,2, flu,3}.
1 v 1
w
UD
1
y
LED
2
w
UD
2 v 1
s s2 1
y
∆ y1 ∆y2
2
y
3
y
∆ 3
y
2
y
LED LEDy3
2
lu,
f 1
lu,
f
2
u,
f 1
u,
f
3
lu,
[image:5.612.84.267.196.302.2]f
Fig. 4. The example of probabilistic model for the feasible block elimination method.
The output of the inner iteration loop provides values of
variable nodes Z={v1, v2}. After that, each UD sends the
value of the corresponding variable node to the set of
neighboring LEDs. Finally, using (12)and (8) each LED and
UD compute locally the values of variables{y1, y2, y3, s1, s2}
and repeat the process until the stopping criterion is met,
when we obtain optimal values of dimming levels {y1, y2, y3}.
In comparison with the generic method, the block elimination has a much simpler structure, with a smaller number of variable and factor nodes.
VI. NUMERICALRESULTS
In all simulated models, we are employing a loopy Gaussian BP algorithm using the synchronous scheduling with randomized damping [19]. The synchronous scheduling updates messages from variable to factor nodes, and messages from factor nodes to variable nodes, in parallel in respective half-iterations. Additionally, we damped each mean value message from a factor node to a variable node independently with predefined probability, evaluating the mean value message as a linear combination of the message from the previous and the current iteration.
Convergence: We consider the feasible/infeasible generic
and feasible elimination method, with the goal of investigating the convergence of the BP algorithm. The methods are tested using an open-plan office space with a square-shaped floor area of side length 15m and height 3m, where LED sources are fixed on an equidistant grid on a ceiling plane, providing for n= 100 LEDs. We generate 200 random configurations, where we randomly distributem= 15UDs on the workspace plane, in order to obtain average convergence performances.
The convergence of the BP algorithm depends of the spectral radius ρof the matrix that governs evolution of means from factor nodes to variable nodes, and the BP converges to a
unique fixed point if and only if ρ < 1. In our case, the BP will converge if all spectral radii for each outer iteration ρ(ν) < 1, ν = 1, . . . , ν
max. Consequently, as we shown in [19], the BP converges to a unique fixed point if and only if ρmax<1, where:
ρmax= max{ρ(ν):ν = 1, . . . , νmax}. (16)
Fig. 5 shows empirical cumulative density function (CDF) F(ρmax) of spectral radius ρmax for observed method. The feasible elimination method is superior in terms of the spectral radius, where we record convergence with probability 0.97. In contrast, the feasible/infeasible generic method converged with the negligible probability of 0.01. To summarize, we identify the BP-based feasible elimination method as a good candidate for efficient and distributed solver in the context of the intelligent illumination control.
0.6 0.7 0.8 0.9 1 1.1 1.2
0 0.1 0.2 0.3 0.4 0.5 0.6 0.7 0.8 0.9 1
Spectral Radiusρmax
Empirical
CDF
F
(
ρmax
) Feasible Elimination
Feasible Generic Infeasible Generic
Fig. 5. The maximum spectral radiiρmax over outer iterationsν for the
feasible elimination and feasible/infeasible generic method.
Communication Overhead: The BP messages exchanged
between LEDs and UDs represent the communication overhead. In a single inner iteration, the BP-based feasible elimination method exchanges messages from a variable node to a factor node, i.e, messages from UDs to LEDs, and vice versa. In the following, we are interested in assessing the number of inner iterationsτ per outer iterationν, and corresponding time to complete one outer iterationν. Hence, the BP algorithm in the inner iteration loop is running until the following criterion is reached:
|z(fν,τ→v)−zf(ν,τ→v−1)| 10−14 or τmax= 2000, (17)
where zf→v represents the vector of mean-value messages
from factor nodes to variable nodes. We set the convergence criteria very conservative with the aim of achieving high level of accuracy, although for the practical applications, the illumination system is does not require high precision of dimming states (e.g., 10-bit dimming control with 1024
dimming levels is considered highly precise). Further, assuming that the processing time is negligible compared to the message transmission, it is possible to give a rough time estimate of duration of a single outer iteration ν. Our study focuses on low-rate visible-light communication system with
[image:5.612.337.539.258.394.2]technologies such as IEEE 802.15.4 based ZigBee. Our motivation here is a scenario where UDs are static and fixed at office space desk, in line-of-sight conditions with respect to ceiling LEDs, and are able to detect occupant presence, measure illuminance and perform simple BP processing and message exchange with neighboring LEDs. Thus we close the whole system, both illumination and communication, using LED-based technologies.
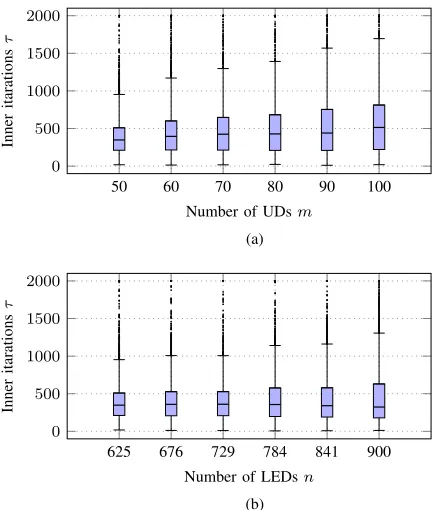
With this aim, we observe a large open-plan office space with square floor area of side50m and height 3m. In the first scenario, we fixed number of LEDs ton= 625(25×25), and considerm={50,60,70,80, 90,100} UDs. Next, we fixed number of UDs to m= 50, and observe systems with n=
{625, 676, 729,784,841,900} LEDs. Additionally, for each pair of numbers LEDs-UDs, we randomly distributedm UDs over 200configurations.
Fig. 6 shows distribution of the total number of inner iterations τ over outer iterationsν and200 configurations. It can be concluded that the number of inner iterations τ growing more in the case of increasing the number of UDs, compared to the case of an increasing number of LEDs. To roughly estimate the time to broadcast all BP messages in one outer iteration ν, we consider median values. Median values for the first scenario are bounded between 348and550 inner iterations, regarding time to broadcast messages can be estimated as(64/250)·348 = 89.1ms, and(64/250)· 514 = 131.6ms. Median values of the second scenario are around
350 iterations, with corresponding time to broadcast all messages in one outer iteration ν as (64/250)· 350 = 89.6ms. Hence, the BP-based algorithm can provide the solution in a reasonable time, for observing models.
50 60 70 80 90 100
0 500 1000 1500 2000
Number of UDsm
Inner
itarations
τ
(a)
625 676 729 784 841 900
0 500 1000 1500 2000
Number of LEDsn
Inner
itarations
τ
[image:6.612.55.273.447.702.2](b)
Fig. 6. The number of inner iterationsτfor the system withm={50,60,
70,80,90,100}UDs andn= 625LEDs (subfigure a), and the system with
n={625,676,729,784,841,900}LEDs andm= 50UDs (subfigure b).
VII. CONCLUSIONS
We presented scalable and efficient distributed approach to solve the illuminance optimization problem using the BP algorithm. This aim of the work was to set a ground for BP-based framework for smart illumination. In our future work, we plan to investigate BP-based version of interior-point methods, which, based on our initial results, seems to be even more efficient for BP-based implementation. We also plan to explore the solution of the optimization problem when the channel gain matrix is unknown. More precisely, authors in [20] presented an approach based on compressed sensing, where the UD is able to easily recover the channel gain matrix. The presented model is suitable for integration in the BP framework, which allows the algorithm to estimates the channel gain matrix and minimize the energy consumption according to the desired illumination level simultaneously in the time continuous process.
REFERENCES
[1] The European Commission, “Background for the European LED quality charter.” [2] Energy Informatio Administration (EIA), “Total electric power industry summary
statistics 2017.”
[3] C. J. Humphreys, “Solid-state lighting,”MRS bulletin, vol. 33, no. 4, pp. 459–470, 2008.
[4] X. Wang and J.-P. Linnartz, “Intelligent illuminance control in a dimmable LED lighting system,”Lighting Research & Technology, vol. 49, no. 5, pp. 603–617, 2017.
[5] S. H. Lee and J. K. Kwon, “Distributed dimming control for LED lighting,”Optics express, vol. 21, no. 106, pp. A917–A932, 2013.
[6] J. Dong and A. Pandharipande, “Efficient distributed control of light-emitting diode array lighting systems,”Optics letters, vol. 37, no. 14, pp. 2910–2912, 2012. [7] V. Singhvi, A. Krause, C. Guestrin, J. H. Garrett Jr, and H. S. Matthews, “Intelligent light control using sensor networks,” inProc. SenSys. ACM, 2005, pp. 218–229.
[8] A. Pandharipande and D. Caicedo, “Adaptive illumination rendering in LED lighting systems,”IEEE Trans. Syst., Man, Cybern., Syst., vol. 43, no. 5, pp. 1052– 1062, 2013.
[9] M.-S. Pan, L.-W. Yeh, Y.-A. Chen, Y.-H. Lin, and Y.-C. Tseng, “A WSN-based intelligent light control system considering user activities and profiles,”IEEE Sensors J., vol. 8, no. 10, pp. 1710–1721, 2008.
[10] T. Labeodan, C. De Bakker, A. Rosemann, and W. Zeiler, “On the application of wireless sensors and actuators network in existing buildings for occupancy detection and occupancy-driven lighting control,”Energy and Buildings, vol. 127, pp. 75–83, 2016.
[11] A. K. Gopalakrishna, T. ¨Ozc¸elebi, A. Liotta, and J. J. Lukkien, “Exploiting machine learning for intelligent room lighting applications,” inProc. IEEE IS. IEEE, 2012, pp. 406–411.
[12] Y.-J. Wen and A. M. Agogino, “Wireless networked lighting systems for optimizing energy savings and user satisfaction,” inPorc. IEEE WHNC. IEEE, 2008, pp. 1–7.
[13] M. T. Koroglu and K. M. Passino, “Illumination balancing algorithm for smart lights,”IEEE Trans. Control Syst. Technol., vol. 22, no. 2, pp. 557–567, 2014. [14] J. Byun, I. Hong, B. Lee, and S. Park, “Intelligent household LED lighting
system considering energy efficiency and user satisfaction,”IEEE Trans. Consum. Electron., vol. 59, no. 1, pp. 70–76, 2013.
[15] D. Bickson, Y. Tock, O. Shental, and D. Dolev, “Polynomial linear programming with Gaussian belief propagation,” inProc. IEEE Allerton. IEEE, 2008, pp. 895– 901.
[16] M. Mladenov, B. Ahmadi, and K. Kersting, “Lifted linear programming,” in
Artificial Intelligence and Statistics, 2012, pp. 788–797.
[17] S. Boyd and L. Vandenberghe,Convex optimization. Cambridge university press, 2004.
[18] A. Marxen, “Primal barrier methods for linear programming,” Stanford univ ca systems optimization lab, Tech. Rep., 1989.
[19] M. Cosovic and D. Vukobratovic, “Distributed Gauss–Newton method for state estimation using belief propagation,”IEEE Trans. Power Syst., vol. 34, no. 1, pp. 648–658, Jan. 2019.