Low-Cost PEM Fuel Cell Diagnosis Based on
Power Converter Ripple with Hysteresis Control
Giovanni Dotelli, Roberto Ferrero,
Member
,
IEEE
, Paola Gallo Stampino, Saverio Latorrata and Sergio Toscani,
Member
,
IEEE
Abstract—This paper deals with a low-cost diagnostic tech-nique for PEM fuel cells which exploits the ripple produced by power converters to monitor the equivalent ohmic resistance. While the available literature on this topic is focused on constant-frequency control of the power converter (such as PWM), this paper discusses the measurement issues that arise when hysteresis current control is employed for a DC/DC boost converter, which represents the simplest solution from the implementation point of view, therefore particularly suitable for low-cost applications. The classic frequency-domain analysis for ohmic resistance iden-tification, based on the Fourier Transform, is compared to a time-domain analysis based on a simple identification algorithm, and a real-time implementation of the latter is presented. The experimental results are obtained on a single PEM fuel cell, but the extension to fuel cell stacks for commercial applications is also discussed.
Index Terms—Fuel cell, diagnostics, power converter, real-time processing, system identification
NOMENCLATURE
Tsw, fsw Converter switching period and frequency
δ Converter duty cycle
Ton, Toff Closed and open switch times
∆I Current ripple peak-to-peak amplitude im, vm Low-frequency FC current and voltage
ihf, vhf High-frequency current and voltage ripple
Ihf, Vhf High-frequency current and voltage spectra
Zhf High-frequency FC impedance
Lb, Cb Converter inductance and capacitance
Rtrans, Ctrans FC transport resistance and capacitance
Ract, Cact FC activation resistance and capacitance
Rohm FC ohmic resistance
Ls FC and connections inductance
tk, ik, vk Time, current and voltage sequences
Ts Sampling period
N Number of samples involved in the fitting σ2(·), σ(·,·) Variance and covariance
u(·) Standard uncertainty
(·)est,(·) Estimated values and their averages (·)on,(·)off Values referred toTonandToff
G. Dotelli, P. Gallo Stampino and S. Latorrata are with the Department of Chemistry, Materials, and Chemical Engineering “G. Natta”, Politec-nico di Milano, 20133 Milano, Italy (e-mail: giovanni.dotelli@polimi.it; paola.gallo@polimi.it; saverio.latorrata@polimi.it).
R. Ferrero is with the Department of Electrical Engineering and Electronics, University of Liverpool, L69 3GJ Liverpool, UK (e-mail: Roberto.Ferrero@liverpool.ac.uk).
S. Toscani is with the Dipartimento di Elettronica, Informazione e Bioingegneria, Politecnico di Milano, 20133 Milano, Italy (e-mail: ser-gio.toscani@polimi.it).
(·)r Values in one current or voltage ramp
I. INTRODUCTION
The increasing emergence on the market of commercial devices powered by fuel cells (FCs) urgently demands the development of low-cost diagnostic tools to guarantee reliable long-term operation at an affordable price suitable for massive-scale market diffusion of these devices. In particular, for poly-mer electrolyte membrane (PEM) FCs, which represent one of the most promising technologies for mobile and powertrain applications [1], [2], an effective water management is one of the main goals that need to be achieved, as the cell water content deeply affects the cell efficiency, voltage stability and lifetime [3], [4].
It is well known that a wealth of information about the FC state of health can be obtained by electrochemical impedance spectroscopy (EIS). Indeed, impedance measure-ments at different frequencies provide insight into the different electrochemical phenomena that characterize the complex FC behavior, thus allowing to well distinguish between different causes of performance degradation [5]. As far as water man-agement is concerned, the two opposite failure modes, namely membrane dehydration and cell flooding, produce a significant increase of the equivalent ohmic and transport resistances, respectively. Since the former represents the main contribution to the high-frequency FC impedance (above 1 kHz) while the latter represents the main contribution to the low-frequency impedance (below 1 Hz), EIS is commonly employed in laboratory experiments to detect membrane dehydration and cell flooding [6]–[9].
measure the lower-frequency impedance as well as the ohmic resistance [14], [15].
All these papers referred to converter operation with con-stant switching frequency, as in case of pulse width modu-lation (PWM) control, which is the simplest condition from the impedance measurement point of view because the FC is excited at constant frequencies (the switching frequency and higher harmonics around its multiples) and the signal acquisition can be synchronized with the switching signal, thus avoiding spectral leakage errors. On the other hand, converter control techniques involving variable switching frequencies make the impedance estimation more troublesome, because of the non steady-state condition of the FC during measure-ments and the lack of synchronization between sampling and excitation signal.
This paper discusses these issues focusing on the case study of a DC/DC converter operated with hysteresis control, which represents the simplest solution from the implementation point of view and it is therefore particularly suitable for low-cost commercial applications. In more details, the paper is organized as follows. After a brief introduction on hysteresis control for DC/DC converters (Sec. II) and on FC equivalent circuits (Sec. III), the classic frequency-domain analysis for ohmic resistance identification, based on the Fourier Trans-form, is compared to a time-domain analysis with a simple model-based identification algorithm, which is shown to be the most convenient solution for accurate real-time ohmic resistance measurements (Sec. IV). The proposed approach is finally tested on a single PEM FC connected to a low-voltage DC/DC converter, and the elaboration algorithm is implemented in a field programmable gate array (FPGA) interfaced with a real-time processor (Sec. V-VI).
II. DC/DC CONVERTER WITHHYSTERESISCONTROL
The range of FC applications is extremely wide, and they are usually classified into three broad areas: stationary power generation [16], mobile power generation [17], and powertrain applications [18]. In most of them, the FC is not directly connected to the load to be fed, but proper power converters are interposed; basically, the reasons are two. The first one is the need to decouple the voltage of the FC stack from that applied to the load; sometimes the load requires an AC voltage [19], or in other cases it has to be supplied with a DC voltage which is different from that ensuring optimal operation of the stack. However, even when the voltage required to feed the load is similar to the rated voltage of the stack, a DC/DC converter is often needed since the output voltage of a FC is heavily affected by the current, because of the non-negligible output resistance. The other reason is that a FC has a fairly slow dynamics, so that it is not able to quickly change its power output. Therefore, when the power of the load to be supplied is characterized by large and abrupt variations, the FC has to be integrated with other energy sources, thus forming an hybrid fuel cell system [20], [21]. Power converters and their controls are of utmost importance in this case, since they permit to optimize the exploitation of the sources. In particular, the FC stack may operate in quasi steady-state conditions, with great advantages in terms of efficiency and power output.
load
Lb D
T Cb
v
[image:2.612.316.555.55.128.2]i FC
Fig. 1. Schematic representation of a DC/DC boost converter connected to the FC on one side and to an electrical load on the other side.
i
t
i
mΔ
I
on
T
T
offT
swFig. 2. Theoretical current waveform produced by the DC/DC converter.
Because of the multifold applications of FC technology, the architectures of the power electronics converters are extremely variegated. However, in many of them it is necessary to boost the stack voltage, which is not high enough for the application. For this reason, the stack is often connected to a step-up DC/DC converter which boosts the voltage, while ensuring a nearly constant current operation. Although many high-efficiency soft-switching converters have been proposed, the architecture shown in Fig. 1 is still widely employed thanks to its simplicity. As introduced before, the boost chopper is operated in order to control the cell current. Because of the switching, the current contains a triangular ripple superimposed to the low-frequency component im, as shown
in Fig. 2 where ∆I is the peak-to-peak amplitude of the ripple,Tsw is the switching period, whileTonandToff are the
durations of the time intervals when the switchT is closed and open, respectively. The following well-known relation between ripple amplitude and switching frequency can be written:
∆I= vm fswLb
δ (1)
where fsw is the switching frequency, Lb the inductance of
the boost converter input inductor, δ the duty cycle of the converter, and vm the low-frequency component of the FC
voltage.
[image:2.612.337.536.164.317.2]+
−
Rohm
Ract Rtrans
Ctrans
Cact(jω)
E v
i
[image:3.612.62.286.55.155.2]Ls
Fig. 3. Typical linearized equivalent circuit of a PEM FC.
transducer and a Schmitt trigger are required. Even in this case, the current ripple can be exploited to estimate the high-frequency resistance of the FC, however the measurement becomes much more challenging with respect to a PWM chopper because of the variable switching frequency.
III. FUELCELLEQUIVALENTCIRCUIT
The equivalent circuit shown in Fig. 3 is often employed as a linearized model to describe the behavior of a PEM FC when it operates around a stable working point. The three equivalent resistances take into account the three main sources of losses, namely ohmic losses (Rohm), activation polarization
(Ract) and mass transport limitation (Rtrans), while the two
equivalent capacitances describe the dynamic response associ-ated with activation (Cact) and transport (Ctrans) phenomena.
A frequency dependence of the activation capacitance or a constant-phase element (CPE) instead of it are usually intro-duced for a better approximation of the actual cell dynamics [8], [22]. Finally, a series inductance (Ls) may be necessary to
take into account inductive phenomena mainly associated with the electrical connections that may appear at high frequencies. It should be noted that a great variety of equivalent circuits for PEM FCs can be found in the literature (see [1], [23], [24]). However, they mainly differ in the low-frequency part, associated with the activation and transport processes, which may vary from cell to cell depending on the cell design, while it is generally agreed that the high-frequency limit of the equivalent circuit can be represented by a resistance, with the possible addition of a series inductance to include the inductive effects of electrical connections.
The cut-off frequencies of the two RC circuits (or other equivalent circuits in different models) associated with ac-tivation polarization and mass transport limitations are far below typical DC/DC converter switching frequencies (about 10 kHz or even higher), as confirmed by the impedance spectrum of the cell under test shown in Fig. 4, which was measured at medium DC current in typical operating conditions (see Sec. V-VI). This means that the FC response to the current ripple produced by the converter does not contain any significant capacitive contribution, while it may show an inductive behavior depending on the converter switching frequency and the electrical connections. Therefore, a deeper discussion of low-frequency equivalent circuits falls out of the purposes of this paper, and a first-order RL model is generally expected to be sufficiently accurate to describe the
4 6 8 10 12 14 16 18 20 22 24 26 −2
0 2 4 6 8 10
Real(Z) [mΩ]
−Imag(
Z
) [m
Ω
]
1 Hz 1 kHz
100 Hz
10 Hz
Fig. 4. Impedance spectrum of the cell under test, measured at 9.2 A DC current in typical operating conditions.
high-frequency response:
Zhf(jω) =−
Vhf(jω)
Ihf(jω)
=Rohm+jωLs (2)
or, in the time domain:
vhf(t) =−Rohmihf(t)−Ls
dihf(t)
dt (3)
It is now apparent that the high-frequency current ripple inherently produced by the converter allows to estimate the ohmic resistance value, which is strongly dependent on the membrane water content and it is therefore a good indicator for membrane dehydration diagnosis. Furthermore, the addition of lower-frequency components in the ripple waveform allows to estimate other relevant parameters of the FC equivalent circuit, such as the transport resistance, which is a reliable index for detecting cell flooding or gas starvation. Because of the large separation between the converter switching frequency and the frequencies required to identify the low-frequency equivalent circuit parameters, the measurement issues arising from the time-varying switching frequency mentioned in the previous section do not affect the low-frequency measurements. Thus, in the following sections only the identification of the ohmic resistance from the inherent converter ripple will be discussed.
IV. OHMICRESISTANCEIDENTIFICATIONALGORITHMS
Several methods for FC ohmic resistance measurements are known in the literature [25]. Electrochemical impedance spec-troscopy is certainly the most common technique employed in laboratory experiments, while among the methods not re-quiring expensive dedicated instrumentation the most common one is the current interruption technique, which identifies the ohmic resistance from the voltage step following a current step from the load current to zero. The main drawback of this method is the significant perturbation imposed to the system, that makes it not suitable for frequent repetition, without mentioning the possible difficulties related to the correct identification of the ohmic voltage step.
[image:3.612.322.547.60.185.2]A. Frequency-domain Analysis
In order to reduce the computational burden, the Fourier Transform for the calculation of voltage and current spectra is typically applied to signals acquired in a fixed time window, corresponding to the theoretical period of the signals or an integer multiple of it. In PWM converters, the switching period is known because it is externally imposed, but when hysteresis control is employed the switching period may significantly differ from the theoretical value, and it is also subject to continuous and unpredictable variations. This means that if the Fourier Transform is applied on a time window equal to the theoretical switching period, significant leakage errors are likely to appear in the voltage and current spectra, preventing from obtaining meaningful impedance measurements even if the voltage and current spectra are averaged over a much longer time window.
As a possible solution to decrease the effects of leakage errors, a time window equal to several (nominal) switching periods could be considered for the application of the Fourier Transform. In this case, any systematic difference between the actual and theoretical switching periods would produce negligible leakage effects. However, the position of the most significant harmonic component in the voltage and current spectra isa prioriunknown, therefore it should be empirically found in order to obtain meaningful results. Furthermore, if the switching frequency is changing within the observation win-dow, the signal energy is distributed among several harmonic components, so that if a single component is considered, the impedance measurement may be affected by a poor signal-to-noise ratio. A weighted average of the impedance obtained from different spectral components would then be necessary to obtain accurate results.
In conclusion, this last method is the only solution able to provide accurate impedance measurements. However, it is quite complex from the computational point of view, because it requires to apply the Fourier Transform to voltage and current signals involving a large number of samples and to calculate several harmonic components and the corresponding impedance values, in order to finally average these values with proper weighting coefficients. It is therefore apparent that this solution is not convenient for real-time implementation in commercial applications requiring low-cost instrumentation.
As a final remark, it is worth mentioning that the voltage and current ripple signals may be affected by significant disturbances at the time instants corresponding to the converter switching, and such disturbances could represent another im-portant uncertainty source in frequency-domain impedance measurements. To overcome all these issues, a time-domain approach is proposed in the next subsection as a possible solution.
B. Time-domain Analysis
The triangular current ripple waveform produced by the converter and the simple FC model (3) describing the cell response to the converter ripple suggest the possibility to estimate the ohmic resistance by a time-domain analysis. Since the FC output impedance at the ripple frequencies is
t
v
Rv
Fig. 5. Voltage response to the converter current ripple (solid line) according to the RL model (3) and its resistive component (dashed line).
much lower than the impedance of the boost inductor, the power converter behaves essentially like a current generator. Therefore, it injects a current waveform which is composed of alternate increasing and decreasing ramps (Fig. 2), and each ramp gives rise to a corresponding voltage ramp according to (3). The opposite of the ratio between the voltage and current slopes is equal to the ohmic resistanceRohm, while the series
inductanceLs, if present, produces only an offset in the voltage
[image:4.612.347.528.53.180.2]ramp which does not affect its slope. This is illustrated in Fig. 5.
Therefore, if each ramp of the voltage and current wave-forms is fitted by a straight line, two estimates of the ohmic resistance can be obtained in each switching period. The advantage of this approach is that it does not require the switching period to be constant. It only requires to acquire the digital switching signal to know when each ramp starts and ends. Moreover, the extreme points of each ramp can be excluded from the fitting procedure, so that any disturbances introduced on the signals by the commutations, such as fast spikes, do not affect the ohmic resistance estimate, contrary to what happens with the Fourier analysis described above.
It is worth noting that the proposed identification algorithm is quite simple and it is therefore suitable for real-time implementation. Indeed, assuming that the differences between the measured signal and the ideal ramp are only due to random white noise, the classic linear regression algorithm based on the least-squares method provides the following expressions for the slope estimates of the voltage and current ramps:
dv dt
est
=σ(t, v) σ2(t) =
NP
ktkvk−PktkPkvk
NP
kt 2 k−(
P
ktk)
2 (4)
di dt
est
= σ(t, i) σ2(t) =
NP
ktkik−PktkPkik
NP
kt 2 k−(
P
ktk)
2 (5)
wherek= 1, ..., N denotes the voltage and current samples, andσ2(·) andσ(·,·) are the variance and covariance
opera-tors, respectively. Being the time axis uniformly spaced, it is possible to write without loss of generality tk = (k−1)Ts,
whereTs is the sampling period. Thus, the above expressions
reduce to:
dv dt
est
=12 Ts
P
k(k−1)vk−N2−1Pkvk
di dt est = 12 Ts P
k(k−1)ik−N2−1Pkik
N(N2−1) (7)
Other estimation algorithms could be employed, but they would lead to very similar results, because the uncertainty on the time axis is negligible and there are no significant outliers among the fitted samples.
As anticipated, the ohmic resistance can be calculated from the ratio between these two slopes:
Rohm,est=− dv dt est di dt est (8)
Two estimates of Rohm could be then obtained in each
switching period, one during the increasing current ramp (Ton)
and another one during the decreasing current ramp (Toff).
However, the very short switching period compared to the time scales on which the ohmic resistance is expected to vary suggests to calculate an average estimate of Rohm on
a longer time window (e.g. 0.1 s), in order to decrease the associated uncertainty. It should be noted that the number of samples used for the linear regression is generally different during TonandToff (depending on the converter duty cycle),
and it is also generally different in two consecutive increasing or decreasing ramps because of the time-varying switching frequency and the lack of synchronization between signal acquisition and converter switching. Thus, each ramp slope estimate is characterized by its own uncertainty, depending on the number of samples involved in the calculation, which must be taken into account in a weighted average algorithm to calculate the best estimate ofRohmin the chosen time window.
The propagation of the voltage and current uncertainties through the linear regression algorithm used to identify the slope of the voltage and current ramps can be evaluated by standard propagation rules applied to (6) and (7), assuming constant uncertainties u(v) and u(i) for all voltage and current samples, respectively, arising from random uncertainty sources, thus without any correlation between different sam-ples. These assumptions lead to the following expressions:
u dv dt est = s 12 N(N2−1)
u(v) Ts (9) u di dt est = s 12 N(N2−1)
u(i) Ts
(10)
In the selected time window, the slopes of different ramps having the same sign are not expected to show significant variations, thus a weighted average can be calculated as the slope best estimate, where the weighting coefficients are the inverse of the uncertainties (9)-(10) squared. The best estimate of the ohmic resistance evaluated duringTonis therefore given
by:
Rohm,est,on=−
P
rNon,r Non2,r−1
dv
dt
est,on,r
P
rNon,r Non2,r−1
di
dt
est,on,r
(11)
and similarly forToff:
Rohm,est,off =−
P
rNoff,r
Noff2 ,r−1 dvdtest,off,r P
rNoff,r
N2 off,r−1
di dt
est,off,r
(12)
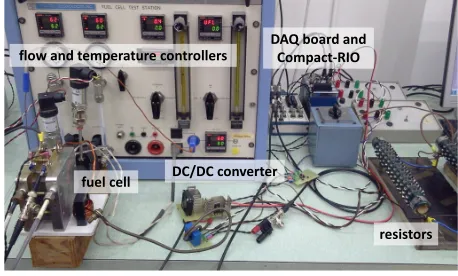
fuel cell
resistors DAQ board and
Compact-RIO flow and temperature controllers
[image:5.612.322.551.53.191.2]DC/DC converter
Fig. 6. Photograph of the experimental setup.
where the indexr denotes the different considered ramps. Finally, a weighted average between the two ohmic re-sistance estimates obtained during Ton and Toff should be
evaluated, with the same approach followed above. An ap-proximate expression can be derived by assuming that the average slopes of the ramps inTonandToff (both voltage and
current) are inversely proportional to the average number of samples in these ramps, being them inversely proportional to δand1−δ, respectively. From this assumption, the following proportionality can be derived:
u2 Rohm,est,on
∝ (
P
rNon,r) 2
P
rNon,r Non2,r−1
(13)
u2 Rohm,est,off
∝ (
P
rNoff,r)2
P
rNoff,r
N2 off,r−1
(14)
and the inverse of these values can be used as weighting coef-ficients for the average betweenRohm,est,on andRohm,est,off.
The results thus obtained are expected to have an accuracy comparable to the results provided by the most accurate FFT approach described in the previous subsection, but with a significantly lower computational burden suitable for real-time implementation, as confirmed by the experimental results reported in Sec. VI.
V. EXPERIMENTALSETUP
The proposed measurement technique was tested on a single PEM cell, although its applicability can be extended to FC stacks of several cells, more commonly employed in commercial applications, as discussed in the following.
A photograph of the experimental setup is shown in Fig. 6. The employed cell has an active area of 23 cm2 and it is composed of commercial materials, in particular a Nafion® 212 membrane as electrolyte (50-µm thickness) and a gas diffusion electrode reference sample (E-TEK LT140). The cell is fed with pure hydrogen and air at the anode and cathode, respectively, whose flow rates are measured and controlled by calibrated flow meters. Before entering the cell, both hydrogen and air are humidified through saturators, whose temperatures are controlled to achieve the desired relative humidity. Finally, the cell temperature is also controlled.
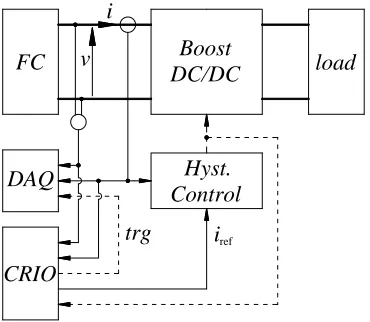
load
v
i
FC
Boost
DC/DC
DAQ
CRIO
Hyst.
Control
[image:6.612.83.268.52.213.2]trg
i
refFig. 7. Schematic drawing of the connections among the employed devices.
output is in turn connected to a resistive load. The converter input inductance was designed to produce a current ripple with a peak-to-peak amplitude below 5% of the cell DC current at 10 A, when the converter switching frequency is 10 kHz. This amplitude limit is believed to be a reasonable value for the considered application, although it is difficult to find a generally-accepted indication of the maximum allowed ripple because the evaluation of the associated negative effects on the FC performance (such as loss increase, possible damages and durability decrease) is not straightforward [22], [27]–[30]. The FC current (i.e. the converter input current) is measured by a closed-loop Hall-effect current transducer and it is controlled by using a Schmitt trigger whose reference signal (either constant or slowly varying to introduce low-frequency perturbations) is generated by a reconfigurable input/output system (NI Compact-RIO 9014). The same system is used to acquire the cell voltage and current (with 16-bit resolution and 105 samples-per-second sampling frequency), together
with the digital switching signal (with a time resolution of 0.4 µs), while providing real-time processing of the signals according to the time-domain approach described in Sec. IV-B. The cell voltage and current are also acquired by a 16-bit data acquisition (DAQ) system (NI 6251) synchronized with the Compact-RIO, with a higher sampling frequency (5·105 samples per second), for a more accurate off-line elaboration aiming at comparing different identification algorithms for the ohmic resistance. A schematic drawing of the connections among all the employed devices is shown in Fig. 7.
A first real-time data processing is performed in the Xil-inx Virtex-II 3-million-gate FPGA included in the Compact-RIO. The start instant of each voltage and current ramp is identified based on the digital switching signal, and the slope of each ramp is estimated according to the linear regression expressions in (6) and (7). The execution of this algorithm is synchronized with the voltage and current acquisition, so that the sums in (6) and (7) are updated after the acquisition of each new sample. To avoid the effects of numerical errors that may arise due to the 16-bit numerical format employed in the FPGA, the average values of the voltage and current ramps are subtracted from the next acquired ramps, so that in steady-state conditions the DC components of the processed
0.659 0.66 0.661 0.662
Voltage waveform
v [V]
0 0.1 0.2 0.3 0.4 0.5
8.8 9 9.2 9.4 9.6
Current waveform
t [ms]
i [A]
Fig. 8. Current and voltage waveforms measured by the DAQ system.
signals are much smaller than the peak-to-peak amplitudes. The estimated increasing and decreasing ramp slope values in each switching period, together with the number of samples on which the estimation was based, are then passed to the 400-MHz-clock real time processor also included in the Compact-RIO, where the weighted averages (11) and (12) are calculated and the best estimate of the ohmic resistance in the selected time window (1000 switching periods) is finally evaluated.
It is worth noting that an accurate ohmic resistance estimate can be obtained in a quite short time window (about 0.1 s in this case) compared to the time scales in which the cell ohmic resistance is expected to change due to water content variations (tens of seconds or minutes). Thus, in case of FC stacks which are typically employed in commercial applications, a multiplexed architecture can be easily employed to monitor the ohmic resistance of each cell (or small groups of cells) in the stack, without increasing the cost and complexity of the required instrumentation.
VI. EXPERIMENTALRESULTS
First experimental tests were performed in stationary con-ditions, with the cell running at a medium-level DC current of 9.2 A, corresponding to 0.4 A/cm2. The cell temperature
was kept constant at 60 °C and the gas flow rates were set to 0.2 Nl/min and 1.0 Nl/min for hydrogen and air, respectively, with 90% relative humidity for both gases. Finally, the resistive load was adjusted to make the converter work with a duty cycle around 0.7. The current and voltage waveforms measured by the DAQ system in these conditions are reported in Fig. 8. It can be seen that the switching frequency is not constant and its average value is slightly smaller than the expected value according to the design specifications (10 kHz).
[image:6.612.316.545.56.227.2]0 20 40 60 80 100 4.3
4.35 4.4 4.45 4.5 4.55
t [s]
R ohm
[m
Ω
]
R1
R2
[image:7.612.54.288.60.196.2]R3
Fig. 9. Ohmic resistance values estimated off-line by different identification methods, namely the proposed time-domain analysis with (red line R1) and without (green line R3) elimination of extreme ramp values, and frequency-domain analysis (blue line R2).
commutation disturbances from affecting the slope estimates. The results thus obtained are compared to those provided by the frequency-domain analysis, also reported in Fig. 9 (line R2). In this case, each resistance value was obtained by applying the Fourier Transform on a fixed time window of 0.1 s and averaging the resistance values calculated from the 100 harmonic components around the most significant one, weighted by the square of their amplitudes, according to what discussed in Sec. IV-A.
The standard deviation of the Rohm estimates is a key
parameter for this diagnostic technique, because it defines the minimum variation of the ohmic resistance that can be distinguished from noise. It is worth noting that the two above-mentioned estimates of Rohm have similar standard
deviations (lower than 0.01 mΩ in both cases), but there is a significant difference between their mean values. Such difference can be attributed to the disturbances introduced by commutations, which in practice affect only the results obtained by the Fourier Transform. To confirm this hypothesis, the ohmic resistance values estimated from the time-domain analysis without discarding any voltage or current sample are also reported in Fig. 9 (line R3), and they are in good agreement with the results provided by the frequency-domain analysis. Therefore, it seems reasonable to conclude that the Rohm estimate in R1 should be regarded as the most accurate
one. As a further confirmation, it can be also mentioned that in this case there is compatibility between theRohmestimates
obtained duringTonandToff, while this is not the case for the
values in R3.
Finally, the results obtained from the real-time identification algorithm implemented in the Compact-RIO are reported in Fig. 10. In order to verify whether the measurement accuracy is good enough to allow an effective and fast detection of ohmic resistance variations arising from faults or non-proper FC operation, a membrane dehydration transient was induced during the test by gradually decreasing the inlet gas relative humidity from 90% to 50%. As expected, the standard deviation of the Rohm values is now higher than for the DAQ
measurements (about 0.04 mΩ) because of the lower sampling frequency and the worse converter resolution, but it is still
0 500 1000 1500 2000 2500 3000 4
5 6 7 8 9
t [s]
R ohm
[m
Ω
]
Fig. 10. Real-time ohmic resistance estimate calculated by the Compact-RIO during a membrane dehydration transient induced by decreasing the inlet gas relative humidity.
small enough to allow detecting the ohmic resistance increase due to dehydration, as well as the small oscillations that char-acterize the FC operation with low membrane humidification [31].
VII. CONCLUSIONS
A low-cost diagnostic method for PEM fuel cells was presented, based on the use of the ripple produced by switch-mode power converters for the identification of relevant indi-cators of the FC state of health, suitable for commercial appli-cations. In more details, the paper dealt with the measurement processing issues that arise when the ripple is produced by a DC/DC converter with hysteresis control, causing the ripple waveform to have a variable frequency.
While an accurate processing of the FC response to this high-frequency ripple is important to estimate the equivalent ohmic resistance of the cell, suitable for membrane dehydra-tion diagnosis, convendehydra-tional frequency-domain techniques are not able to provide accurate results or they require a compu-tational burden not suitable for real-time implementation in low-cost commercial applications. On the contrary, a time-domain approach based on a general circuital model of the FC was shown to provide accurate results with a simple algorithm suitable for real-time implementation.
The proposed method was tested on a single PEM FC, although it can be conceptually extended to stacks composed of several cells, and it was compared to a classic frequency-domain analysis. The identification algorithm was then im-plemented in a FPGA and a real-time processor to test its application to on-line diagnosis, with low sampling frequency in order to validate the proposed approach even when less accurate measurements (provided by low-cost instrumentation) are available.
[image:7.612.326.546.62.195.2]REFERENCES
[1] F. Barbir, PEM fuel cells: Theory and practice,2nd ed., Amsterdam, Boston: Elsevier/Academic Press, 2013.
[2] Y. Wang, K. S. Chen, J. Mishler, S. C. Cho and X. C. Adroher, “A review of polymer electrolyte membrane fuel cells: Technology, applications, and needs on fundamental research”,Applied Energy, vol. 88, pp. 981-1007, 2011.
[3] W. Dai, H. Wang, X. Z. Yuan, J. J. Martin, D. Yang, J. Qiao and J. Ma, “A review on water balance in the membrane electrode assembly of proton exchange membrane fuel cells”,Int. Journal of Hydrogen Energy, vol. 34, pp. 9461-9478, 2009.
[4] N. Yousfi-Steiner, P. Moc¸ot´eguy, D. Candusso, D. Hissel, A. Hernandez and A. Aslanides, “A review on PEM voltage degradation associated with water management: Impacts, influent factors and characterization”, Journal of Power Sources, vol. 183, pp. 260-274, 2008.
[5] X. Yuan, H. Wang, J. C. Sun and J. Zhang, “AC impedance technique in PEM fuel cell diagnosis - A review”,Int. Journal of Hydrogen Energy, vol. 32, pp. 4365-4380, 2007.
[6] J. M. Le Canut, R. M. Abouatallah and D. A. Harrington, “Detection of membrane drying, fuel cell flooding, and anode catalyst poisoning on PEMFC stacks by electrochemical impedance spectroscopy”,Journal of the Electrochemical Society, vol. 153, no. 5, pp. A857-A864, 2006. [7] W. M´erida, D. A. Harrington, J. M. Le Canut and G. McLean,
“Charac-terisation of proton exchange membrane fuel cell (PEMFC) failures via electrochemical impedance spectroscopy”,Journal of Power Sources, vol. 161, pp. 264-274, 2006.
[8] N. Fouquet, C. Doulet, C. Nouillant, G. Dauphin-Tanguy and B. Ould-Bouamama, “Model based PEM fuel cell state-of-health monitoring via ac impedance measurements”,Journal of Power Sources, vol. 159, pp. 905-913, 2006.
[9] T. Kurz, A. Hakenjos, J. Kr¨amer, M. Zedda and C. Agert, “An impedance-based predictive control strategy for the state-of-health of PEM fuel cell stacks”,Journal of Power Sources, vol. 180, pp. 742-747, 2008. [10] M. F. Mathias and S. A. Grot, “System and method for controlling the
humidity level of a fuel cell”,US Patent6,376,111, 2002.
[11] M. Hinaje, I. Sadli, J. P. Martin, P. Thounthong, S. Ra¨el and B. Davat, “Online humidification diagnosis of a PEMFC using a static DC-DC converter”, Int. Journal of Hydrogen Energy, vol. 34, pp. 2718-2723, 2009.
[12] G. Dotelli, R. Ferrero, P. Gallo Stampino, S. Latorrata and S. Toscani, “Diagnosis of PEM fuel cell drying and flooding based on power converter ripple”,IEEE Trans. on Instrumentation and Measurement, vol. 63, no. 10, pp. 2341-2348, 2014.
[13] G. Dotelli, R. Ferrero, P. Gallo Stampino, S. Latorrata and S. Toscani, “Testing of a diagnostic technique for a single PEM fuel cell based on a DC/DC converter”,Proc. of IEEE AMPS 2014, Aachen, Germany, Sep. 24-26, 2014, pp. 138-142.
[14] G. Dotelli, R. Ferrero, P. Gallo Stampino, S. Latorrata and S. Toscani, “PEM fuel cell drying and flooding diagnosis with signals injected by a power converter”,IEEE Trans. on Instrumentation and Measurement, in press (available online), DOI: 10.1109/TIM.2015.2406051.
[15] N. Katayama and S. Kogoshi, “Real-time electrochemical impedance diagnosis for fuel cells using a DC-DC converter”,IEEE Trans. on Energy Conversion, in press.
[16] Y. H. Li, S. Rajakaruna and S. S. Choi, “Control of a solid oxide fuel cell power plant in a grid-connected system”, IEEE Trans. on Energy Conversion, vol. 22, no. 2, pp. 405-413, 2007.
[17] K. Green and J. C. Wilson, “Future power sources for mobile commu-nications”,Electronics & Communication Engineering Journal, vol. 13, no. 1, pp. 43-47, 2001.
[18] A. T-Raissi and D. L. Block, “Hydrogen: Automotive fuel of the future”, IEEE Power & Energy Magazine, vol. 2, no. 6, pp. 40-45, 2004. [19] M. Mohr, W. T. Franke, B. Wittig and F. W. Fuchs, “Converter systems
for fuel cells in the medium power range – A comparative study”,IEEE Trans. on Industrial Electronics, vol. 57, no. 6, pp. 2024-2032, 2010. [20] P. Thounthong, S. Ra¨el and B. Davat, “Control algorithm of fuel cell
and batteries for distributed generation system”,IEEE Trans. on Energy Conversion, vol. 23, no. 1, pp. 148-155, 2008.
[21] P. Thounthong, S. Ra¨el and B. Davat, “Analysis of supercapacitors as second source based on fuel cell power generation”, IEEE Trans. on Energy Conversion, vol. 24, no. 1, pp. 247-255, 2009.
[22] R. Ferrero, M. Marracci, M. Prioli and B. Tellini, “Simplified model for evaluating ripple effects on commercial PEM fuel cell”,Int. Journal of Hydrogen Energy, vol. 37, pp. 13462-13469, 2012.
[23] C. Wang, M. H. Nehrir and S. R. Shaw, “Dynamic models and model validation for PEM fuel cells using electrical circuits”,IEEE Trans. on Energy Conversion, vol. 20, no. 2, pp. 442-451, 2005.
[24] N. Wagner, “Characterization of membrane electrode assemblies in polymer electrolyte fuel cells using a.c. impedance spectroscopy”,Journal of Applied Electrochemistry, vol. 32, pp. 859-863, 2002.
[25] K. R. Cooper and M. Smith, “Electrical test methods for on-line fuel cell ohmic resistance measurement”,Journal of Power Sources, vol. 160, pp. 1088-1095, 2006.
[26] R. Pintelon and J. Schoukens,System Identification. A Frequency Do-main Approach,2nded., Hoboken, NJ: Wiley, 2012.
[27] R. S. Gemmen, “Analysis for the effect of inverter ripple current on fuel cell operating condition”,Journal of Fluids Engineering, vol. 125, pp. 576-585, 2003.
[28] W. Choi, J. W. Howze and P. Enjeti, “Development of an equivalent circuit model of a fuel cell to evaluate the effects of inverter ripple current”,Journal of Power Sources, vol. 158, pp. 1324-1332, 2006. [29] B. Wahdame, L. Girardot, D. Hissel, F. Harel, X. Franc¸ois, D. Candusso,
M. C. P´era and L. Dumercy, “Impact of power converter current ripple on the durability of a fuel cell stack”,Proc. of IEEE ISIE 2008, Cambridge, UK, Jun. 30 - Jul. 2, 2008, pp. 1495-1500.
[30] R. Ferrero, M. Marracci and B. Tellini, “Single PEM fuel cell analysis for the evaluation of current ripple effects”,IEEE Trans. on Instrumen-tation and Measurement, vol. 62, no. 5, pp. 1058-1064, 2013.