THE PEOPLING OF AUSTRALIA: UNITED KINGDOM IMMIGRATION
FROM FEDERATION TO THE GREAT DEPRESSION
by
David Pope
A thesis submitted for the degree of Doctor of Philosophy
in the
ABSTRACT
The years that span the Federation of the Australian colonies in 1901, and the onslaught of the Great Depression, witnessed a conscious
drive to populate and develop Australia more rapidly. The country
looked upon as the source of additional population was the United Kingdom.
The thesis examines the supply and demand behavioural responses behind UK migration to Australia together with the formation of migration and development policy of Australian governments,Settling UK migrants upon the land was not, as is commonly supposed, a sine qua non of Australia’s migration policy, nor was development policy
restricted to the expansion and diversification of rural activity. Rather, Australian governments intervened across a broader front in
support of output, employment and high standards of living, and directly,
and indirectly, in support of population growth. The latter, in turn,
conveyed an ever growing army of consumers, producers and taxpayers into
the future. It also meant greater national security.
The structural equations estimated in the second part of the thesis cast further light on the demand for UK immigrants and also on why
people came. The model differs from earlier Australian and overseas
studies in that population is distinguished from labour, supply and demand are specified as ’excess' curves, and the traditional emphasis on ’free market’ labour transfers is largely replaced by an emphasis on government intervention.
It is difficult to directly compare the empirical results with past
research based on different models. This is particularly so in the case
of Australian studies which have been wholly confined to single equation push-pull models, whereas one of the advances made in this study is the
estimation of separate supply and demand functions. One general
observation can be made. The only factors detected in previous studies
relating to Australia have been unemployment rates. In contrast, the
current study has uncovered a wide range of determinants of migration. My estimation of the inverse demand function (government subsidies
to migrants being taken as the left hand side variable), suggests that variation in demand was predominantly determined by the short term
human capital, and the costs of migrating - the latter entailing the
costs of transport and job search. Governments most directly influenced
transport costs via contract rates and passage subsidies. Though less
directly, their intervention in support of jobs and wages, most likely also operated to increase supply.
Within the corttext of the broad targets of population additions set,
Australia, it is argued, obtained the numbers she sought. But there were
CONTENTS
Page
LIST OF TABLES ±±±
LIST OF FIGURES viii
LIST OF PLATES x
INTRODUCTION x i
PART I : GOVERNMENT INTERVENTION, UK MIGRATION AND
AUSTRALIA'S POPULATION STRATEGY
1 The Australian Economy 1
2 Some Aspects of the Australian Labour Market 27
2.A.1 Tables Relating to the Australian Labour
Market 81
2. A.2 Tables and Notes Relating to the United
Kingdom Labour Market 88
3 Contours of Australian/United Kingdom Migration 96
3. A.1 Tables and Figures 144
4 Policy, The Assignment of Roles among Australian
Governments and Target Setting 162
4. A.1 Direct Spending on Immigration: Outlays and Parliamentary Votes of Commonwealth and
State Governments 182
5 Policy, Australia's Migration and Development
Strategy 248
5. A.1 The Empire Settlement Act and Migration
Agreements 298
6 Policy, Restraints and Weaknesses in Australia's
Strategy 305
6. A.1 Derivation of UK Migrants' Contribution to Australian Growth via Transfers of Net
Employment Inputs 340
PART I I : AN EMPIRICAL STUDY OF UNITED KINGDOM IMMIGRATION
Introductory Comments, History and Model Building 343
7 A Survey of the Literature on the Determinants of
11
Page
8 A Model of UK/Australian Immigration 387
8.A.1 The Derivation of a Utility Function from
Valuation Functions 438
8. A.2 The Specification of an Oligopsonist*s
Demand Function 441
9 Some Empirical Findings on the Determinants of
UK Immigration 446
9. A.1 Australian V/orkforce Estimates 482
9.A.2 Statistical Tables and Notes 495
10 Conclusions 511
List of Tables
1 Text Page
la Australian Output and Population Growth, 1861-90 3
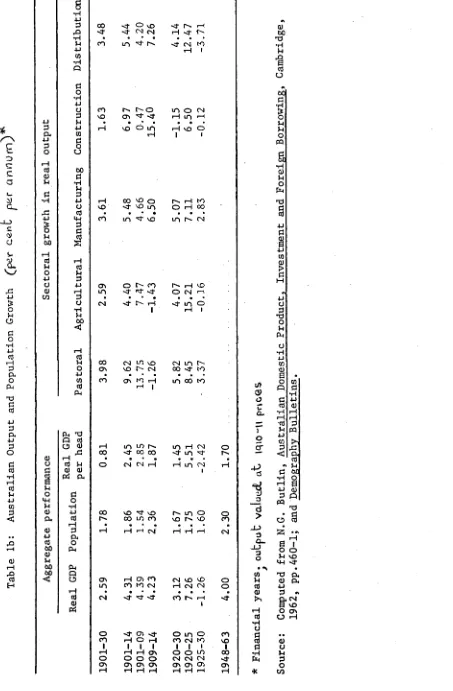
lb Australian Output and Population Growth, 1901-30 9
2 Output and Population Growth in some Western
Economies 13
3 Subdivision Shares in Gross Domestic Product 14
4 Subdivision Shares in Gross Domestic Capital
Formation 14
5 Subdivision Shares in Work Force 14
6 Australian Terms of Trade 16
7 Import Substitution in Selected Industries 30
8 Indexes of Australian Tariff Levels
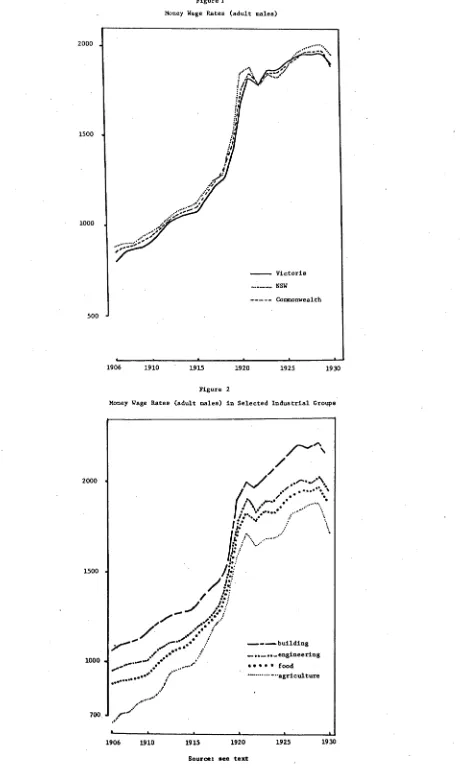
9 Money Wage Rates by State
10 Money Wage Rates in Selected Industrial Groups 32
11 Correlation Matrix, Money Wage Rates by State 33
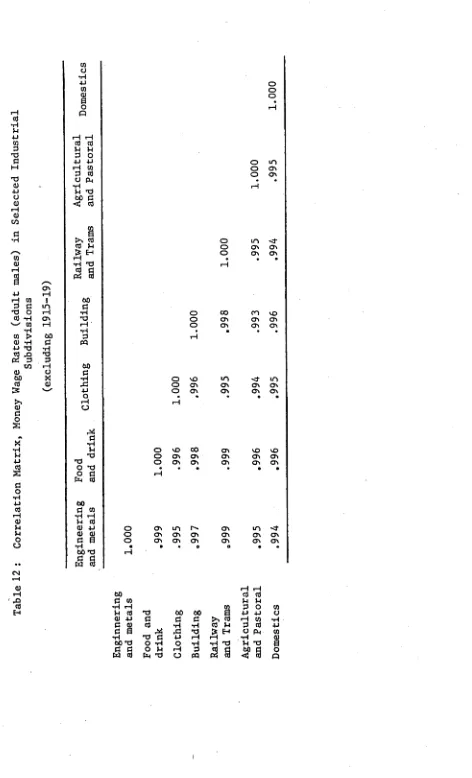
12 Correlation Matrix, Money Wage Rates in Selected
Industrial Groups 35
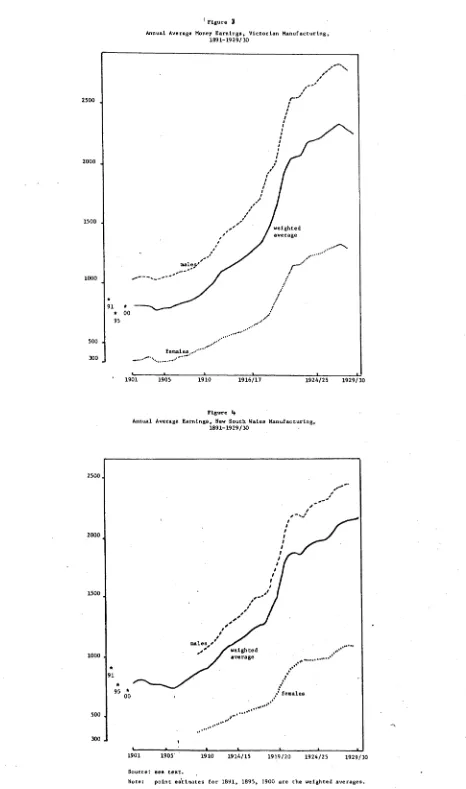
13 Annual Average Money Earnings, Victorian Manufacturing 38
14 Annual Average Money Earnings, Mew South Wales
Manufacturing 38
15 Australia, Normal Working Hours 61
16 Comparative Change in Wages Relative to 1924 64
17 Australia, Percentage Unemployment 60
18 Percentage of Wage Earners Unemployed at Censuses
of 1891, 1901 and 1911 61
19 Series of Early Unemployment 62
20 Correlation Matrix, State and Commonwealth Unemployment 67
21 Correlation Matrix, Commonwealth Unemployment in
Industrial Subdivisions 69
22 Australian Unemployment by Industrial Subdivisions,
Means and Standard Deviations 30
23 Overseas Passenger Movements to and from Foreign 2.06
(Alien) Countries
108
24 Australia, Overseas Movements
25 Australia, Proportion of Permanent Temporary and Tourist
26
27
28
29
30 31 32 33
34
35
36
37
38 39 40
41 42 43 44
45 46 47 48
49
iv
List of Tables
United Kingdom Migrants Contribution to Australia’s Population Growth
Proportion of Arrivals Receiving Subsidised Passages
Correlation Matrix, United Kingdom Immigration into Australia and the Several States
Percentage Distribution of Occupations of Adult UK Emigrants to Australia
Age Distribution by Sex of UK Emigrants to Australia UK Emigration to Australia, Country of Last Residence Interstate Passenger Movements
Percentage Distribution of UK Emigration between the Empire, United States and Other Foreign Countries Percentage Distribution of UK Emigrants between the Dominions
Percentage Distribution of Occupations of Adult UK Emigrants to New Zealand
Percentage Distribution of Occupations of Adult UK Emigrants to Canada
Direct Expenditure on Passage Subsidies Advertising and Administrative Functions
NSW, Requisitions and Arrivals Victoria, Requisitions and Arrivals
Gross Public Capital Formation by State and Commonwealth Governments and Local Authorities Population Growth Rates
Sources of Funding, Consolidated Revenue Comparative Expenditures
The Contribution of Net UK Migrant Employment Inputs to Australian Output Growth
UK Population Transfers (single equation estimates) The Migrant Population Supply Function
A
Inverse Demand Function(SP is the dependent variable) The Migrant Supply Function (estimated by a two-stage regression technique)
Inverse Demand for Migrant People (estimated by a two- two-stage regression technique)
Page
116
120
121
126 128 130 133
136
136
141
141
169 177 179
270 281 309 312
330 445 451
476
stage
List of Tables
II Appendicies
2.A.1
1 Australian Price Indexes
2 Real Wage Differentials between Australia and the
United Kingdom
3 Australian Unemployment by State
4 Australian Unemployment by Industrial Subdivisions
2. A.2
1 United Kingdom Real Wages
2 United Kingdom, Wages in Less Skilled Occupations as
Percentages of those in Skilled Occupations
3 Comparison of Percentage Unemployed as shown by
Union Returns and the Insured Workers Returns
4 United Kingdom Unemployment
3. A. 1
1 UK Emigration to Australia 1912-29: the statistics of
the countries of origin and destination
2 Proportional Composition of Movements to and from
Foreign (non-British) Countries, 1905, 1912
3 Proportional Composition of Movements to and from
Foreign (non-British) Countries, 1920-30
4 Proportional Composition of Passenger Movements to and
from Other British Countries (exclusive of UK and New Zealand)
5 Victoria, Overseas Passenger Movements
6 New South Wales, Overseas Passenger Movements
7 Queensland, Overseas Passenger Movements
8 Western Australia, Overseas Passenger Movements
9 South Australia, Overseas Passenger Movements
10 Tasmania, Overseas Passenger Movements
11 Assisted Immigration into Australia by State
12 Assisted Immigration into Australia: Selected and
Nominated
13 Occupational distribution of UK Emigrants to
Australia 1912 to 1913 and 1921 to 1929
Page
82
83 84 86
90
95 95
146
147
148
149
150 152 153 154 155 156
157
158
vi
List of Tables
14 Persons of British nationality emigrating from the
United Kingdom to extra-European countries by country of future permanent residence 1913 and 1920-29
15 Assisted Immigration to Canada, Australia and New
Zealand, 1910-13 and 1919-29
Page
160
161
4.A.1
1 Commonwealth Outlays and Votes on Immigration
2 Commonwealth, Passage Rates and Government
Contributions
3 Commonwealth, Estimated Outlays on Assisted Passages
4 Commonwealth Outlays on Migration-Development
Schemes
5 Outlays on Migration-Development Schemes by State
6 Estimated Costs of Approved Schemes under the
fe34 Million Agreement
7 Proportional Distribution of Expenditures by Types
of Costs Associated with the Commonwealth Government Advertising Australia
8 Commonwealth, Estimated Salaries of the Development
Branch
9 Victoria, Outlay and Votes on Immigration
10 Victoria, Estimated Outlays and Votes on Promoting
Immigration
11 New South Wales, Outlays and Votes on Immigration
12 New South Wales, Loans for Immigration
13 Queensland, Outlays and Votes on Immigration
14 Queensland, Immigration Trust Fund, Aggregate
Transactions and Balances
184
188 192
194 195
196
197
200 203
207 208 212 219
225
15 South Australia, Outlays and Votes on Immigration
16 Tasmania, Outlays on Immigration, Transactions and
Balances of the Immigrants Suspense Account
17 Western Australia, Outlays and Votes on Immigration
18 Western Australia, Loan Raisings
19 Western Australia, Estimated Immigration Expenditure
Exclusive of Administrative Office Charges
20 Aggregate Outlays and Votes on Immigration: All
States and the Commonwealth
228
232 234 237
243
List of Tables
Page
9.A.1
1 Estimated Male Population in Working Age
Gofrorts-2 Estimated Female Population in Working Age
Cohorts-3 Male Workforce Estimates
4 Female Workforce Estimates
5 Total Weighted Workforce Estimates
6 Contribution of Contemporaneous UK Gross Arrivals
to the Australian Workforce
7 Australian Workforce, Numbers Employed and Unemployed
485 486 487 487 492
493 494
9.A.2
1 Public and Private Expenditure Concepts
2 Ratio of Customs Duties to Imports
3 Real Income Differentials between Australia and the
United Kingdom
4 Average Real Costs of Transport
5 Australian governments’ Average Expenditure on Passage
Subsidies Advertising and Administration
6 Ratio of Defence (non-War) Expenditures to Gross
National Product
7 UK Gross Passenger Outflow to Extra-European Ports
Other than Australia
8 Stock of UK Migrants who Arrived in Australia During
the Preceding 15 Years
9 Estimated UK Males in the Migration Decision Making
Age Group, 20-44 Years
10 Mean Years to Retirement of UK Males in the Migration Decision Making Age Group, 20-44 Years
496 497
498 499
503
505
507
508
509
viii
List of Figures
Page
I Text
31
1 Money Wage Rates
2 Money Wage Rates in Selected Industrial Groups 31
3 Annual Average Money Earnings, Victorian Manufacturing 37
4 Annual Average Money Earnings, New South Wales
Manufacturing 37
5 Comparison of Average Unskilled and Skilled Weekly Wage
Rates for Various Occupations in Melbourne
6 Australian Retail Price Indexes ^
7 Australian Real Wages 49
8 Australia, Index of Normal Working Hours 31
9 United Kingdom, Wage Rates 33
10 Unemployment, Commonwealth, Victoria and New South
Wales 64
11 Unemployment in Different States 64
12 Australian Unemployment in Selected Manufacturing
Groups 71
13 Australian Unemployment in Selected Industrial Groups 71
14 United Kingdom Unemployment • 73
15 Commonwealth of Australia, Gross and Net Inflows from
the United Kingdom and Assisted Immigrants 313
16 State Shares of United Kingdom Migration 119
17 Empire Settlement Competitors, Gross UK Migration to
Canada, Australia and New Zealand 338
18 Dominion Shares of Empire Migration 139
19 United Kingdom Immigration, Related Dimensions 345
20 Population Market, Domestic Demand and Supply m
Australia 390
390
21 Population Market, Migration Excess Curves
22 Population Market, Domestic Demand and Supply in the
United Kingdom 390
23 Labour Market, Domestic Demand and Supply in Australia 390
24 Labour Market, Migration Excess Curves 390
25 Labour Market, Domestic Demand and Supply in the United
Kingdom 390
399
List of Figures
II Appendicies
2. A.2
1 United Kingdom, Index of Normal Hours in the Building
Trades
2 United Kingdom, Index of Normal Hours in All Industries
3. A. 1
1 Victoria, Gross and Net Inflows from the UK and
Assisted Arrivals
2 New South Wales, Gross and Net Inflows from the UK and
Assisted Arrivals
3 Queensland, Gross and Net Inflows from the UK and
Assisted Arrivals
4 Western Australia, Gross and Net Inflows from the UK
and Assisted Arrivals
5 South Australia, Gross and Net Inflows from the UK and
Assisted Arrivals
9.A.1
Page
92
92
150
152
153
154
155
X
List of Plates
Page following
1 Road Hogs 165
2 Sleeping at his Homework 252
3 Down - But Will the Brute Stay Down 253
4 When the Bottle Comes Home Empty 318
5 Buying off the Bump 324
INTRODUCTION
Australia is like Heaven. There are not
enough people in either place.
Sir James Mitchell, 1923
(Premier of Western Australia)
This thesis is an attempt to tell something of the story behind
the peopling of Australia in the early twentieth century. The years
that span Federation in 1901 and the Great Depression witnessed a
conscious drive to populate and develop Australia more quickly. The
decline in the birth rate was by and large accepted as a secular trend characteristic of all western societies and in any case Australia could not afford to wait for the day when she would be adequately
peopled by her own sons and daughters. Immigration was recognised as
the means of augmenting population growth and the traditional ties
between Australia and the United Kingdom - or ’Home’ as most Australians
referred to it - made it rather natural to look to the United Kingdom
as the source. Moreover, other lands of recent settlement were not
suppliers of population - rather they were competitors. And, in an
era in which Australians had announced to the world the policy of a ’White Australia’, the ’surplus' people of many other countries were
not welcome. In the pages which follow, three related issues are
explored; why UK migrants were wanted, why they came and the formation and nature of government policy with respect to immigration and
development.
For convenience the thesis has been divided into two parts. The
first part examines the formation of government policy, the reasons behind the drive to people Australia and the ways in which Australian governments intervened to accelerate UK immigration and to foster
development. The second part of the thesis is largely devoted to
1 Prime Minister's Department, Correspondence File, A461, AF326/1/3,
xii
formulating supply/demand models of population flows and tests of hypotheses as to why migrants came, why they were wanted and the impact of government intervention. Not all aspects of the narrative of Part I could be tested due to data limitations, degrees of freedom
and the measurability of certain factors. The last chapter however,
draws on both the qualitative evidence of the first part and the
econometric estimates of the second in an effort to unravel the story. To guide the reader through such a long, I hesitate to use the word tedious, thesis, more than the few words above are in order in
introducing the structure and approach I have adopted.
Six chapters form Part I. The first two of these set the backdrop
to the subsequent discussion of policy formation with an examination
of the course and change in the Australian economy and labour market
and of the nature of government intervention in economic matters. Although the discussion focusses on Australia, I have endeavoured, albeit it crudely, to compare and contrast the conditions and rewards of the Australian worker with his counterpart in Britain. The
chapters, particularly the second, also have the ancillary role of
providing much of the data used in Part II of the thesis. Chapter 3
then describes the contours of Australian/UK migration. Against this
background - the economy and labour market, government intervention in economic matters and the course of migration - Chapters 4-6 tackle head on the issue of the formation and implementation of
migration policy. In Chapter 4, institutional arrangements, the
assignment of roles among Australian governments and target setting
are explored. The intervention of governments in the economy and
labour market held important implications for the pace and scale of
immigration. Some actions were deliberately fashioned to lift the
pace of population transfers, others were not so singularly fashioned, though still, directly and indirectly, influenced the
inflow. This chapter looks at the most direct measures taken by
governments to people Australia - their direct expenditures on recruiting and subsidizing emigrants from the United Kingdom.
Chapters 5 and 6 broaden the story. They explore the desire or
Part II of the thesis, as I have indicated, subjects certain aspects of the story to empirical test and extends that story in
a number of respects. The second part of the thesis is organised
around three chapters. The first, Chapter 7, begins by surveying
some of the literature on international migration by economic
historians. The chapter seeks to identify the 'proffered economic
laws' of population transfers, to assess how they have withstood predictive tests and the reliability and soundness of such tests. In Chapter 8, I outline my own model of UK immigration, one which it is hoped is innovative and cognisant of Australia's historical and institutional conditions of development, and her strategy of
population growth. Chapter 9 reports the results of subjecting this
model - both as a single and simultaneous equations system - to
test. The final chapter draws from both the literary evidence and
econometric work in a bid to extend our understanding of the
behavioural relations behind the peopling of Australia and the role of governments.
My great debt is to my supervisors, Drs. J.J. Pincus and
N.G. Cain and to the Head of the Department, Professor N.G. Butlin,
whose advice was invaluable and unstinted throughout. I must also
acknowledge the continuing benefit I have gained from the joint departmental seminar series in Economic History and from discussions with staff and students in the various Economics and Economic History
departments of the university. Wayne Naughton is also to be thanked
for his very considerable computer work.
The assistance of the library section of the university staff and of librarians in the Australian Bureau of Census and Statistics has been freely given throughout my researches and is gratefully
acknowledged at this time. Hie assistance given by archivists in the
xiv
Finally, I wish to thank my wife, who read and commented on the draft and as the deadline menacingly approached, organised the typing
and assisted with the proof reading. I am greatly indebted to her
GOVERNMENT INTERVENTION
MIGRATION AND
AUSTRALIA’S POPULATION
- 1
-Chapter 1
THE AUSTRALIAN ECONOMY
Introduction
The main purpose of this Chapter is to provide a sketch of the growth and structural change within the Australian economy from
Federation to the Great Depression. Decision-makers (migrants,
Australian residents, pressure groups and the elected members of
state and Commonwealth legislatures) did not act in a vacuum. This
Chapter is an attempt to outline the principal features of Australian economic development and to offer a backdrop to the subsequent
discussion of policy formation.
Many of the features which are clearly evident after Federation, first in Australian life styles (urbanisation, social experimentation in wage fixation and more generally government interference in
economic matters) and second, in the course of economic development (inter- and intra-sectoral diversification), had their roots deeply
buried in the nineteenth century. I have therefore begun with this
prehistory.
Overall performance was not generally on the same scale in the thirty years following Federation as it was during the 'pioneering'
phase of Australian development, 1860-90. It is argued, however, that
measures of aggregate output growth reveal little about structural change,and that an appreciation of this is important in understanding
Australia's migration and development policy. This change was
importantly fostered by governments via public investment, subsidies, price props, preferential treatment of local suppliers in government contracts, and the tariff.
The role of governments cannot be measured simply in terms of net expenditures, or the number of workers and other inputs directly
employed in departments and public business undertakings. Some actions,
such as tariff protection, raised government revenue rather than
depleted it, and wages and salaries of government employees were small in total, compared to those paid by the private sector.
More to the point is how governments behaved and the nature of
the corporate machinery that enabled conflicting and cooperating group pressures to be vented, and the means of implementing these resolutions. In this way the 'private' and 'public' sectors were highly interdependent.
In defining (by democratic procedures) and in implementing the outcome of cooperating and competing claims, governments could and
did act, at least in the short run, in a rather special fashion. For
their decisions were taken in comparative isolation from prices and
costs. Such behaviour was not peculiar to the first three decades of
the twentieth century. For instance, limitation of profit, rate
reductions and the planning of construction to aid economic development, had been goals of governments in building the network of transport and
communications facilities in the nineteenth century. Furthermore, in
the latter part of the nineteenth century, not all decisions of private
investors had been attuned to costs. For instance, in the eighties a
considerable amount of investment was directed into the pastoral sector by a growing number of pastoral finance companies. With easy finance, and fortified by romantic memories of fortunes won in the seventies, pastoralists overextended rural capital. Much of it subsequently was
written off. In the cities too, entrepreneurs extended fixed assets
with scant regard to costs. The frenzy grew and fed upon itself. The
depression (and the drought) however forced a reassessment. The great
land boom both in the country and the cities had crashed, and with it
went the bloated expectations of the age. Prices and costs perforce
now loomed larger in private investment decisions. This contrasted
with government behaviour, where ventures and actions undertaken were
still not at all closely scrutinised for their net returns. But because
governments were largely unencumbered by considerations of cash flows,
they were able to provide direction to development. However, at least
by the close of the twenties, the weaknesses inherent in the separation of decisions from strict economic criteria became increasingly
burdensome - a thesis expounded at length in Chapter 5.
This Chapter is organised in the following way: First, as already
indicated, I begin with a sketch of growth leading up to Federation. Second, growth in the ensuing three decades is examined at both
aggregate and sectoral levels, and also compared with the performance
of some other western economies. Finally, attention is focussed on
the structural change which occurred and the manner in which governments
- 3
-the role of government intervention in -the labour market and of -their overall strategy of development and of population growth.
Prehistory, 1860-1900
By 1860 Australia had attained a world pinnacle of per capita real income , a position achieved through pastoral expansion and gold mining,and facilitated by particularly high workforce participation
rates. But Australia was still largely an untamed continent. The
thirty years following 1860 saw a prodigious effort by both the private and public sectors to achieve a real physical control of the new
continent. The pace of output growth was rapid, though population
growth and declining workforce participation rates pressed hard on its tail.
Table la: Australian Output and Population
( per c£nc per annj/ru Growth, 1861-90
Real GDP* Population Real GDP
per head
1861-70 5.3 3.9 1.4
1871-80 5.7 3.1 2.6
1881-90 4.4 3.6 0.8
Source: N.G. Butlin, Australian Domestic Product ...»
Table 269 . Bo lUliQ'S
* icjiO-U
pnceS
Three related features of this output and population growth are pertinent to my subsequent story of development in the early twentieth century, and of Australia's immigration and population strategy.
First, Australia possessed a mixed economic system - often
enunciated as ’colonial socialism' - in which public authorities played a detailed role in the workings of the economy and the labour market
1 N.G. Butlin, 'Some Perspectives of Australian Economic Development
1890-1965', in Colin Forster, ed., Australian Economic Development in the Twentieth Century, Sydney 1970, p.284.
2 This was largely the result of the immigration of single male fortune hunters during the fifties and government sponsored immigration of single
females. Over 1871-1961 the shares of the workforce in total population
deviated little from 40 per cent. In 1861 however, it was 50.6 per cent.
[image:23.554.62.513.146.516.2]and in the early provision of an institutional framework for worker
and social reforms. In the era 1860-90 the central thrust of public
development policy was to establish the main arterial communications
system1 23, and in this way seize control of the continent.
Second, Australia was heavily reliant on overseas factor transfers. For some years (1881-90) the capital inflow made up 50 per cent of
gross capital formation, and this moreover in a period when total gross capital formation was proceeding apace - it constituted almost 20 per
cent of GDP. This- foreign development capital flowed into both
private and public enterprise in roughly equal proportions, although 3
there was some short run inversity of movements. The capital inflow
gravitated towards three areas which together accounted for 70 per cent 4
of total investment - private investment in residential housing (particularly in the eighties), private investment in the pastoral industry, and public investment in the network of transport and communications facilities.
These two features of the era, public intervention and factor transfers, were closely entwined since governments were particularly
prominent in promoting capital and labour flows. In their transport,
communications and other programmes, so active were colonial governments that about 40 per cent of total capital formation was attributable to
1 The origins of government intervention in railway construction
dates back to the fifties, when private construction ventures came to a standstill in the face of labour and capital shortages, both factors being diverted to mining, and to the emergence of the view that governments had a superior ability to raise capital in London
and to secure navvy-labour through assisted immigration. In the post
rush era of the sixties, private enterprise focussed on the relatively more lucrative provision of residential, commercial and industrial assets, but the absence of private railway developers may have also been due, as Butlin suggests, to a lack of entrepreneurial ability
on the scale required. Subsequently, in the early 1870s a social
purpose in construction and operation crystallised: limitation of
profit, rate deductions and the planning of construction to aid
economic development. The favourable reaction of the public to this
policy clinched the government's role in the field. See F.W. Eggleston,
State Socialism in Victoria, London 1932, pp.27-28; N.G. Butlin, 'Colonial Socialism in Australia', in The State and Economic Growth, H.G.J. Aitken, New York, 1959, p.41.
2 Butlin, "Some Perspectives op.cit., Table 6.8.
3 Butlin, 'Colonial Socialism ...', op.cit.
^ viz. internally generated savings plus imported savings, see N.G. Butlin, 'Some Structural Features of Australian Capital Formation
1861-1938/39', Economic Record, December 1959; N.G. Butlin, Investment
- 5
-public sector outlays, and in raising the funds they entered the London
capital market as major borrowers. Also in the presence of excess demand
for domestic labour, governments inaugurated large scale programmes of
assisted immigration from the British Isles. One half of the migrants
arriving received government assistance with their passages.1 23
This is not to suggest that all publicly sponsored activities
would have lapsed in'the absence of government support; some portion
displaced privately financed projects and factor transfers which
otherwise would have eventuated. Nor is it to suggest that government
intervention was unique to the Australian colonies. Some degree of
intervention is apparent in all economies. Further, the degree and style
of intervention experienced in Australia was not without parallel during
that period. Across the Tasman in New Zealand, Reeves in 1894 introduced
the first system of compulsory state arbitration to the world. New
Zealand also sought to augment her workforce and population growth by state assisted immigration, and in meeting capital requirements was also
active on the London capital market. The New Zealander, Sir Julius Vogel
was a key figure in initiating the colonial Stock Act of 1877 , and the first borrower of funds for public works following the passage of the
1 For discussion of immigration in the nineteenth century see T.A. Coghlan,
'Immigration', in Labour and Industry in Australia, Melbourne, 1918,
p p .1280-1330; Roland Wilson, 'Capital Imports, Commodity Trade Fluctuations
and Immigration', Chapter IV in 'Capital Imports', Unpublished Ph.D.,
Chicago, 1930 (microfilm, ANU Library); F.K. Crowley, British Migration
to Australia 1860-1914, Unpublished D.Phil. thesis, Oxford, 1951 (microfilm, ANU Library), and 'The British Contribution to the Australian Population 1860-1919', University Studies in History and Economics, vol.2, no.2,
July 1958; A.R. Hall, 'Some Long Period Effects of the Kinked Age
Distribution of the Population of Australia 1861-1961', Economic Record,
March 1963; Allen C. Kelley, 'International Migration and Economic Growth:
Australia 1865-1935', Journal of Economic History, September 1965, and 'Demographic Change and Economic Growth: Australia 1861-1911', Explorations
in Economic History, vol.5, 1968; R. Duncan, 'Late Nineteenth Century
Immigration into NSW from the United Kingdom’, Australian Economic History Review, March 1974.
2 For a discussion of state experiments in New Zealand, see Keith Sinclair, A History of New Zealand, London, 1961, Chapter 8.
3 The Act permitted colonial governments to issue inscribed stock. The
aim was to make colonial securities more familiar and acceptable to
British investors. Further, the new stock was cheaper to handle, see
Act. But, New Zealand excepted, the Australian colonies did stand apart both from the United Kingdom and from most other lands of recent settlement in terms of the degree of direct intervention, and the nature of the institutional arrangements for the transfer of inputs and
services. In Canada, for instance, it was very largely the business of
private enterprise, on the basis of land grants, to secure capital and labour for the developmental transport network and for closer settlement.
A third feature of the period 1860-90 was that the expansion of output and capital took place by way of a structural change, with a shift in the composition of output towards commercial-industrial
activities. Rapid urbanisation occurred within the context of this
2
structural change. In 1871, 28 per cent of Victoria’s population
resided in Melbourne and about the same proportion of New South Wales'
population were residents of Sydney. By 1891, 48 per cent of Victorians
were concentrated in Melbourne and 36 per cent of New South Wales’
3
population in Sydney. In 1891 these two states accounted for 70 per
cent of Australia's population. More generally N.G. Butlin has pointed
out that by 1891 two thirds of the entire Australian population lived in cities and towns, a fraction matched by the United States only by 1920
and by Canada not until 1930. The rapid growth in population in towns
and cities, and in the eighties the skewed age distribution of the population (which accelerated the demand for housing), combined with high capital imports to generate a boom in house building and
urban-1 Ibid., p.123. It was Vogel in 1870, as Treasurer, who propounded a
'vigorous works programme' to open up settlement, at the time largely
confined to the coast because of inadequate transport. Vogel appreciated
that the further advance of the colony was held up and settlement largely confined to coastal lands primarily because of inadequate transport.
Roads were few; there were under fifty miles of railway and only seven
hundred miles of telegraph lines in the country. He proposed to borrow
£10,000,000 to finance a rapid extension of transport facilities and
a vigorous immigration scheme to provide the necessary labour. By 1881
New Zealand's public external indebtedness per head was nearly twice
Australia's. See Hall, ibid., p.161.
2 The causes of urbanisation and the extent to which industrial expansion stimulated urbanisation and vice versa are discussed by Butlin in his
Investment in Australian Economic Development, op.cit., pp. 182-214. Rapid
urbanisation occurred in other countries at this time. However, what is
unique in Australia's case is that the process of urbanisation did not depend, at least before 1890, on a slackening in growth of numbers
occupied in the rural industries. For elaboration, see Butlin, ibid.
3 A.R. Hall, The London Capital Market ..., op cit., Table 23.
N.G. Butlin, 'Investment in Australian Economic Development', op.cit., p.
-
7-industrial structures in the major cities. By the turn of the century,
however, governments claimed increasing alarm at urban congestion and
its corollary, the sparsely populated rural areas. And by the twenties,
for Prime Minister Hughes, a central strand of immigration policy was to settle new-comers on the land.
The character of the rapid development after 1860 held serious implications for the future of Australia's economy and for workers in
particular. For when the inflow of foreign capital faltered, curtailing
government and private outlays, a principal stimulant of the economy
2
and the labour market was suddenly removed. Unemployment soared,
1 A.R. Hall has suggested that over time the main demand for overseas capital was likely to switch from investment in land-intense exports to investment in nontraded 'domestic' goods (house building being largely such a good), and that in the context of the eighties, such a process was made even more likely by the growth of urbanisation and the skewed age distribution of the population - the latter involving an upswing of
numbers in the 'house demanding' age groups. The switch to nontraded
goods follows, by Hall's theory, from relative profitabilities.
Injections of money, by lowering the interest rate and expanding credit, together with the fruits of increased investment activity in land-intense exports in raising output, might in due course shift the price ratio of nontraded to traded goods - and with it the relative profitability of
investment in the former. See A.R. Hall, The London Capital Market .. . ,
'Postscript', op.cit., pp.192-204.
2 In the 1880s there were growing signs that borrowing by governments and
the private sector were leading to boom excesses. From 1884 onwards,
Coghlan wrote that 'government expenditure became a riot limited only in its
violence by the amount of accommodation obtainable in London'. Private land
and finance companies mushroomed and these developed a highly speculative
boom concentrated in Victoria. In association with these elements,
overseas debt commitments continued to spiral and to absorb an increasingly
large share of export earnings. Thus by the late eighties, a balance of
payments crisis could have been precipitated by either a diminution of the capital inflow or a sharp fall in export prices, and in the early nineties both slumped (circumstances which were repeated at the end of
the twenties). A total cessation of public capital borrowing did not
follow, but colonial governments in face of balance of payments crises and the feeling of British investors that Australia had borrowed far too much, had to adapt themselves to the fact that they could no longer borrow funds
on the London market as they had done in the eighties. Some funds for
public works were raised on the Australian market, though the scale of
construction activities was greatly reduced. See Hall, The London Capital
Market .♦., op.cit., p.136. The period up to 1912 was marked by the net
export of capital to the UK, which reflected the reduced 'gross' inflow
and the repayment debts (particularly by pastoral and land companies). One
exception with regard to new issues on the London market (as opposed to
existing stocks), was Western Australia. Between 1894-1902 it was only
absent from the market in one year (1899); the willingness of lenders to
afflicting one quarter of the workforce. It was against this background of severe depression that twentieth century government development
policy was conceived, a goal of which was to recreate the pre depression
climate that workers had so enjoyed. And enmeshed in this goal was a
strategy for increasing Australia’s population.
The economy: 1900-30
Average real incomes only regained their 1891 level in 1906/07. This output performance however, also reflected the impact of droughts
on rural production, particularly on pastoral output; climatic vagaries
remained important determinants of sectoral and aggregate output, and in the years to 1903, droughts combined with economic forces to deepen the
3 4
decline and prolong the ultimate recovery. At the national level ,
growth in average incomes was sluggish over the thirty years following Federation - of the order of 0.8 of one per cent per annum, Table lb . Within this aggregate and somewhat dismal picture, there were contrasting
subperiods. But given the sensitivity of growth rates to the end points
of their computation, these contrasts must be interpreted with caution. If the era 1901-30 is broken into pre and postwar, then growth seems
faster before the war than after it - particularly 1900/01-1908/09. It
was in this period - and against the backdrop of an improvement in export
Unemployment data are discussed in the next chapter. Money wages of
those in employment also fell (see following chapter). Real wages of
those in employment were erratic, and their movements differed between
states. In general there was little reduction - what fell was the
probability of obtaining these real wages.
The long term growth in sheep flocks and wool production came to an abrupt end with the onslaught of the depression and the fall in wool prices
to record low levels. During the rest of the nineties and into the early
twentieth century, flocks were halved by perhaps the most serious droughts
in Australian history. Thus the sheep population fell from 106,000,000
in 1891 to 54,000,000 in 1902.
3 The economy showed some signs of recovery in 1897, though it was not until the droughts broke after 1902 that average incomes began to rise strongly. 4 It must be emphasised that discussion is confined to national average
incomes. E.A. Boehm has indicated recently that there were marked regional
variations in the timing and severity of the depression and similarly,
differences in the recovery experience of different states. See
E.A. Boehm, Prosperity and Depression in Australia 1887-1897, London, 1971. However Boehm's findings must be treated with caution as they are based on substitute criteria for incomes (money supply proxies, imports and exports, etc.) which could give misleading results, particularly in an
economy with an expanding nontraded goods sector. This writer attempted
T ab l e l b : Au stralian O u t p u t a n d P o pu l a t i o n Gr o w t h
£
p
ti
r
c
e
n
t
p
e
r
a
m
iü
rr
i
- 9
-6 •H 4-1
P 0 0 "d - O vO O ' I-"» r—H a)
JO •d- CN CN rH •d - bO
•H • • • • • • • T3
P CO 4 0 ■p- r^. CN t o •H
4-1 i—1 i Pi
CO JO •H 6 Q cd o P O bO •H p 4-1 •H
o CO r - O 4 0 O CN £
p VO a s H" rH 4 0 i—1 O
■u p • • • • • • Vi
P 4-1 i—1 vO o 4 0 rH VO o Vi
a CO rH 1 1 o
P CP
O
o CJ
E
rH •rHo£
cd bO d)
a) P Vi
M •H o
P pL|
P P
•H 4-1 i—1 0 0 vO o i—1 t o HO
a vO vO 4 0 o rH o o p
j a cd • • • • • • • cd
4-1 4-1 CO 4 0 H" VO 4 0 CN
£ P 4-1
o P P
M cd <D
bO £ S
4->
rH CO
cd rH CD
P cd >
O P P
4-1 P H
o 4-1 CT\ o 1"- CO i—l vO
<d i—1 UO -d- ip" O ' o CN rH
CO P • • • • • • • 4-1
a CN •d- t ' - 1—1 4 0 o O
•H 1 rH 1 P
>4 HD bO O <3 Vi Pi CD i—1 •H cd 4-1
p 0 0 CN LO vO CN 4 0 CO
o CTv vO r - CN 0 0 -d- t o CD
4-1 • • • • • • g .
CO CO CTV t o i—1 4 0 0 0 t o O Cß
cd rH 1 l/> Q p
P4 a) •H
o P 4-1
c cd CD
Cl. •H i—1 rH rH
— cd P
i Vi PP
Pi HD 4-1
Q Cd o Cß
o <D rH 4 0 LO 4 0 rH CN o c r P -P
Jd 0 0 CO0 0 4 0 <3 D.
a) rH • • • ■ • • • « cd
0 P 1
cd p <d a)
a ,
o CN CN r—1 1—1 4 0 CN 1 r H hJ> cs ev P *H Vi b£ O g p rH 4-1 OJg
o p P Q
4-1 o o CO
p •H d HD
<d 4-1 0 0 vO H t VO 4 0 O O -> • p
a cd 0 0 LO CO vO vO CO o P
i—i • • • • • ( • • .
a) P r H r H r H Cvl i—1 rH rH CN J —J \ z , • r
4-1 a o rH
cd o a _ g |
bO <d
P i J - J
p o o Vi o vO
P LH
•d-bO Pi • «V
bO Q CO HD cx,
<3 O OV r H O S CO CN vO vO O p CD a .
4 0 CO t o CN i—1 CN CN O cd 4-1
r H • • • • • • • cd P r\
cd CD
CN| HT H± < r CO I-" . rH
1 - d - vOCN
Pi r H o a s
cd o rH
* r l a
O o s NT O 4 0 o C0 p . .
CO r H o r H C0 CN t o vO cd CD
1 1 1 1 1 1 1 1 P a
r —1 r—| r—1a s o O LO 0 0 •H p
O o O o CN CN CN O ’ Ph P
a s CTv a a s CTva s O S a o
[image:29.554.64.517.73.764.2]prices and terms of trade, Table 6 - that the losses of the depression
and droughts in terms of average incomes were made good. Thereafter
growth in output was less brisk and population, fed by immigration,
pressed harder on it. But the peak level in per capita income was
attained in 1913/14, some 10 to 15 per cent above the 1906/07 level. Although growth was slowing down, average real income levels were
gradually advancing. It was between these dates too that the inflow
of factor inputs from the United Kingdom quickened.1 2 These high levels
of average incomes were not, however, to be retained. By the completion
of the war average, incomes had retreated back to their level of 1906/07. Overall, growth in real output per head in the twenties was not
exceptional, 1.45 per cent per annum. But this overview masks sharp
differences within the decade. Growth was brisk in the first half,
2
especially 1919/20 and 1924/25 , which brought average incomes up to
the zenith of 1913/14. The second half of the decade, with the
exception of minor breath in 1927, showed no sign of growth in real GDP
and the population had less to share amongst it. Through the twenties
the inflow of factor inputs remained prominent and the role of governments
in subsidising immigration and in direct borrowing was sizeable; over
one half the immigrants were subsidised and two thirds of the long term
net capital inflow can be attributed to government borrowing. Capital
imports amounted to a little less than 30 per cent of gross domestic
capital formation, Table 4 . However, despite the new policy of
Empire Settlement in the twenties, the mean level of immigration (and its contribution to incremental change in Australia's population and work force), failed to match the levels recorded in the years just
before WW1. By contrast capital imports attained much higher levels
relative to the immediate prewar years, particularly in the late
1 The course of the migrant inflow is discussed in detail in Chapter 3.
The rise begins from about 1907/08. Net capital inflows resumed in
1912 (coinciding with the peak in population inflows), though the inflow of capital was modest compared with the eighties.
2 Climatic factors again were not without influence: the 'base' year
was one of droughts, the ’current' year one of fair weather. The highest
-
11-twenties , though it was at this time that growth in output waned. In conclusion, average incomes progressed by a series of fits and starts, though overall, the period 1901-30 saw little advance; in 1927/28 for instance, average incomes were not markedly higher than those of 1891.
One might ask, however, how this aggregate long term performance
compares with western economies, both 'old’ and 'recent' lands of
settlement. Unfortunately such comparisons are extremely difficult
owing to the nature and paucity of comparable data of incomes. Further,
the growth rates given in Table 2 for the UK, US and Canada are for calendar years - not fiscal years as are those for Australia chronicled in Table lb. For what such comparisons are worth, it would seem that growth in the Australian economy during the first three decades of the present century was not markedly faster than that experienced in the
UK and sluggish relative to the US. Given the severe difficulties
confronting British export staples in the period after 1914, Australia's
performance relative to the UK, looks even less impressive. There were
differences between the pre and postwar years, though Australia's faster growth in the years to 1914 may reflect more the relative depth and protracted nature of the nineties depression and the course of
droughts. One further feature to which attention might be drawn is the
comparative stagnation of the Australian economy in the late twenties.
Growth in average incomes in the US, UK and Canada was rapid. Australia
by contrast, it would appear, was sliding into economic decline long before Wall Street signalled the Great Depression to the world.
In general then, Australia's growth in average incomes in these years was decidedly patchy, and in broad long term perspective,
unexhilarating. But two points might be made here with regard to this
performance. First, Australia sought and consistently maintained one
1 On the basis of Butlin's adjustments to Wilson's series of capital
imports, there was an average net export of capital of £6.6 million per
annum over 1904-11. The pattern was reversed in 1912 by a net inflow
of £12.3 million; £7.3 million in 1913 and £6.0 million in the first
six months of 1914. Between 1920/21-1924/25 the average inflow amounted
to £24.3 million, and over the remainder of the decade it rose on average
to £52.0 million per annum. See N.G. Butlin, Australian Domestic
1901-29*
( p e r
cQn
t per armuco)
Real GDP Population Real GDP
per head
1901-14
United Kingdom 0.81 0.74 0.07
United States 2.62 1.73 0.89
1920-29
United Kingdom 1.76 1.06 0.70
United States 4.48 1.47 3.01
1901-29
United Kingdom 0.65 0.34 0.31
United States 3.47 1.96 1.51
1926-29
United Kingdom 4.77 0.33 4.44
United States 2.60 0.66 1.94
Canada 4.77 1.96 2.81
*
Calendar years
Sources: Moses Abramovitz and Paul A. David, Preliminary Notes on
the Post-war and Long-term Growth Experience of the United States, Appendix, Table 1, prepared for SSRC Studies of Economic Growth 1964; R.C.O. Mathews and C.H. Feinstein, Preliminary Report on the Post War and Long Run Growth of the UK Economy, Appendix, Tables 1 and 4, pre
pared for the same conference. This material was kindly provided by
N.G. Butlin. The Canadian data is from M.C. Urquhart, K.A. Buckley,
Historical Statistics of Canada, Toronto, 1965, Tables Al, E12, J153,
and Canada Year Books. The Canadian output series is only available
-
13-of the highest population growth rates in the world during this period. That average incomes were kept in tact might be seen as something of
an achievement. Second, macro calculations do not reveal structural
change in Australia, and the ramifications this held for the labour
market - and via it, immigration. Below, some of the structural
features of Australia's aggregate performance are elaborated.
Structural change and government intervention
a) Rural diversification
The depression itself induced certain structural changes within
the economy. Tables 3-5 indicate that mining enjoyed a temporary
recovery, notably gold in WA. The recovery came at a time of fixed gold
but declining commodity prices, and at a time when unemployment increased
the number of roaming prospectors. Less obvious from Tables 3-5 are the
changes that occurred within the primary sector. Depressed wool prices
hastened diversification and alternative land utilisation to wool growing. Interest in refrigerated meat exports quickened in the 1890s and led to the establishment of new export industries centred on meat and dairy
products.1 2 The pastoral industry expanded briskly before WW1,
Table lb, and in restocking flocks depleted during the drought, the industry partially switched to heavy fleeced meat-producing sheep in an
effort to develop meat exports. Reconstruction was also accompanied by
new and improved fencing, pasture improvement and scientific flock
selection. This contrasted with nineteenth century growth which had
been largely based on the expansion of the frontier. Diversification
went further than meat and dairy products. Wheat growing also expanded
greatly from 1896, and though erratic, a fact related to the twist of the natural elements and relative prices, acreage and the average level
of output continued on an upward trend. Acreage under wheat for grain
rose from 5.6 million acres in 1900/01 to 15.00 million in 1929/30. This expansion of the industry was facilitated by technical advances, both biological (new wheat strains) and mechanical, which permitted wheat
1 For a discussion of recovery in Victoria and of the role of new
exports, see W.A. Sinclair, Economic Recovery in Victoria, 1894-1899, Department of Economics, Monograph 8, ANU, 1956.
Table 3: Subdivision shares in GDP - excluding rents
(current pr icesjL efcrtt}
Rural Mining Manufacturing Gas.electricity Building and Trade and Finance and
and water construction transport property Other
1861-1870 26.5 14.2
1871-1880 30.1 8.2
1881-1890 25.8 5.1
1891-1900 25.2 9.0
1900/01-1909/10 28.1 9.7
1910/11-1919/20 27.2 5.4
1920/21-1929/30 24.6 2.4
6.4 9.4
10.5 12.7
12.5 15.7
13.3 9.3
12.6 7.0
14.4 1.4 7.9
16.0 1.7 8.4
18.8 4.5 19.2
18.3 4.6 15.6
19.9 4.6 16.4
19.5 2.5 21.1
22.6 2.0 18.0
23.2 1.9 18.8
26.1 2.2 18.1
Source: N.G. Butlin, 'Some Perspectives...', op.cit., p.290.
Table 4: Gross Domestic Capital Formation
(current prices)
(%) Aggregate
Ratios Sectoral Shares of GDCF
Capital imports
GDCF
GDCF
GDP Primary Mining Manufac
turing Trade Transport
Electricity and water
Resi dential
Local
authorities Other
1861-1870 40.9 11.7 16.0 2.1 6.8 4.6 23.4 1.7 32.2 7.6 5.5
1871-1880 9.0 15.0 29.4 1.0 6.7 4.0 22.2 1.4 23.8 6.6 5.0
1881-1890 50.5 18.8 21.8 1.0 4.6 6.2 27.3 2.8 24.8 6.8 4.6
1891-1900 23.4 12.2 16.6 2.8 4.0 3.8 31.9 4.5 16.6 14.0 5.8
1900/01-1909/10 - 13.1 12.9 6.1 8.1 7.2 26.7 4.3 21.3 9.4 4.1
1910/11-1919/20 29.9 15.3 13.4 2.2 10.3 6.0 28.1 5.0 18.8 9.7 6.4
1920/21-1929/30 27.5 18.0 10.9 1.2 10.5 7.9 23.6 6.6 22.4 12.8 4.2
Source: N.G. Butlin, 'Some Perspectives...', op.cit., pp.289, 292.
Table 5: Subdivision Shares in Work Force
(%)
Rural Mining Manufacturing Gas,electricity
and water
Building and construction
Trade and transport
Finance and
property Other
1890/91 25.9 6.5 15.1 0.1 14.7 19.3 1.1 16.9
1900/01 25.3 8.3 15.0 0.6 10.4 20.7 1.3 18.4
1910/11-1919/20 23.8 4.2 17.8 1.1 10.3 21.5 1.5 20.0
1920/21-1929/30 23.8 2.5 19.9 1.3 12.1 22.5 2.0 15.9
Source: N.G. Butlin and J.A. Dowie, Estimates of Australian Workforce and Employment 1861-1961, Australian Economic History Review, IX, 1969.
Note: Data derived by modifications to and extrapolation of M. Keating, The Australian
Workforce, 1910/11-1960/61, Department of Economic History, Canberra, 1973. Also
see Keating's, 'Comment', Australian Economic History Review, IX, 1971.