promoting access to White Rose research papers
Universities of Leeds, Sheffield and York
http://eprints.whiterose.ac.uk/
This is an author produced version of a paper published in Medical Education.
White Rose Research Online URL for this paper:
http://eprints.whiterose.ac.uk/75647/
Paper:
Lumb, AB, Homer, M and Miller, A (2010) Equity in interviews: do personal
characteristics impact on admission interview scores? Medical Education, 44 (11). 1077 - 1083.
Equity in interviews: do personal characteristics impact on admission interview
scores?
Abstract
Context. Research indicates that some social groups are disadvantaged by medical
school selection systems. The stage(s) of a selection process at which this occurs is
unknown, but at interview, when applicant and interviewer are face-to-face, there is
potential for social bias to occur.
Methods. We have performed a detailed audit of the interview process for a single entry
year to a large UK medical school. Our audit included personal characteristics of both
interviewees and interviewers to investigate whether any of these factors, including the
degree of social matching between individual pairs of interviewees and interviewers,
influenced the interview scores awarded.
Results. A total of 320 interviewers interviewed 734 applicants, providing complete
data for 2007 interviewer-interviewee interactions. Reliability of the interview process
was estimated using generalisability theory as between 0.82 and 0.87. For both
interviewers and interviewees gender, ethnic background, socioeconomic group and
type of school attended had no influence on the interview scores awarded or achieved.
Staff and student interviewer marks did not differ significantly. For staff interviewers,
though numbers in each group were too small for formal statistical analysis, there were
no obvious differences in marks awarded between different medical specialities or with
Conclusions. Our data provide reassurance that the interview does not seem to be the
stage of selection at which some social groups are disadvantaged. These results support
the continued involvement of senior medical students in the interview process. Despite
the lack of evidence that an interview is useful for predicting future academic or clinical
success, most medical schools continue to use interviews as a fundamental component
of their selection process. Our study has shown that this arguably misplaced reliance
upon interviewing is at least not introducing further social bias into the selection
system.
Introduction
Selection systems for admission to higher education, including medical schools in the
UK, have for many years been known to disadvantage applicants from some social
backgrounds.1As a result, in 2004 the UK government introduced a widening
participation (WP) initiative to encourage universities to adopt admissions systems that
increased application and acceptance rates for applicants from non-traditional
backgrounds.2Most medical schools developed their own WP schemes that included
actions such as supporting prospective applicants in their schools and colleges,
modifying admissions systems to minimise social bias, and providing additional support
for WP students during the course. There are many successful WP initiatives in the
UK,3though the policy remains controversial.4
The research literature has established that, historically, admissions systems in most
medical schools have disadvantaged certain groups, with male applicants and those
from some ethnic minority groups persistently reported to be less likely to gain
admission even when allowing for differential performance in school examinations.1
Previous national studies1and internal audits have shown that that our medical school
are no exception with regard to potential issues with inequitable admissions. The
possible disadvantage experienced by some groups could arise at a variety of stages of
the admissions process, such as at the short listing phase, during the interview, or in the
final choice of medical school made by students who receive more than one offer of a
place. Of course, in the last of these, we have little influence over the choices made by
In 1984 McManuset al5suspected that the short listing stage was the point at which the
disadvantage experienced by ethnic minority groups was most likely to be occurring.
At xxxxx medical school, short-listing from the written application form is performed
by senior academic staff using a structured marking system and associated descriptors
formulated by the Admissions Committee. Despite this apparently objective system, an
internal audit showed that female applicants still scored more highly than males by a
mean of one point from a possible 24. Furthermore, the same audit showed that amongst
the academic staff performing the short listing, female staff awarded on average 1.4
points (from 24) more than male staff, irrespective of whether the applicant was male or
female. As a result of this audit, all application forms are now assessed by one male and
one female staff member. This therefore leaves the interview as the next stage when
bias according to social factors may occur and raises the possibility that the interviewers
own gender, or other aspects of their social background, may influence their assessment
of the applicant. To study this possibility we performed a detailed audit of the interview
process, the results of which are presented in this paper.
Methods
Approval to perform this audit was granted by the Admissions Committee and the
Director of Learning and Teaching of xxxxx School of Medicine. For the 2007 entry to
xxxxx medical school, all applicants who were assessed at short-listing as potentially
suitable to receive an offer of a place were interviewed. The following data were
collected from both interviewees and interviewers: gender, ethnic background (initially
classified into 14 categories), socioeconomic group (using The National Statistics
Socioeconomic Classification6into five categories), and school type (classified as
For the staff interviewers, we also recorded their main medical speciality and their
experience of interviewing medical school applicants (number of half-day sessions
performed in the last five years). For interviewees we also recorded their date of birth so
that their age could be used in the analysis. These data were obtained from the
Universities and Colleges Admissions Service (UCAS) application form, from UCAS
after the admissions process for 2007 was complete, and from questionnaires given to
all interviewers.
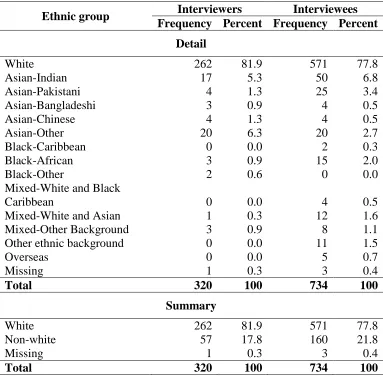
Ethnicity was an obvious area of interest in this study but, as Table 1 shows, the
numbers in the non-white ethnic categories were too small to allow for any meaningful
analysis at this level of detail. Due to the diverse social characteristics of non-white
ethnic groups the merging together of multiple distinct groups is not ideal. However, the
use of 14 different categories by UCAS for ethnic group means that some condensation
of these groupings is inevitably required, and in order to make some attempt to include
ethnicity in the analysis, all the non-white categories were amalgamated to create a
white/non-white categorisation, a strategy used in previous studies.1
[Table 1]
Candidates are normally interviewed by three interviewers (two staff and one medical
student), although, to cover for occasional interviewer non-attendance, a panel of two
interviewers is allowed including the student interviewer when required. At interview,
the candidates are assessed in five separate areas: insight into a career in medicine,
interpersonal skills. These five areas aim to assess those personal qualities of applicants
which are regarded by the admissions committee as desirable characteristics for future
doctors (see www.xxxxx.ac.uk\xxx\xxx for further details). The constructs explored in
these areas have evolved over several years by continuous development and monitoring
by the admissions committee of the medical school. This committee includes a diverse
range of both medical and lay members, selected in order to attempt to generate a broad
range of valid questions for choosing prospective doctors. In the interview, the
questions written each year by the admissions committee are asked of the applicant to
explore their abilities and knowledge in each of the five defined areas. Each interviewer
then independently scores each of these areas by comparison with predetermined ‘grade
descriptors’ as excellent (3 points), good (2 points), fair (1 point) or poor (0 points). The
sum of these scores across all interviewers contributes to the decision to accept or reject
the applicant. This score is proportionately scaled up if only two interviewers are
present, and is used in the later analysis as the measure of interviewee performance.
Both student and staff interviewers receive comprehensive written guidance on the
purpose and conduct of the interview, and student interviewers attend a half-day
training session. As senior medical staff of either the university or local NHS trusts, the
staff interviewers have all received generic equal opportunities training. Finally, the
chair of each interview panel must have attended a one-day training session on medical
school interviews provided by the university.
The reliability of the interviewing process was calculated using variance components
MINQUE methods in SPSS, treating interview scores as the dependent variable and
This allows a generalisability coefficient to be calculated as the proportion of the
variance in the interview scores that can be properly attributed to the interviewees, with
all non-interviewee variance treated as error.
Data analysis was carried out in three separate parts: (1) analysis of interviewee
performance; (2) analysis of interviewer performance; and (3) analysis of
interviewee-interviewer interactions. In all three parts, the potential effect of dependency in the data
(interview scores are partially nested within candidates and interviewers) has been
ignored in order to simplify the statistical analysis. It is therefore possible that any
effects that are shown to be statistically significant are (slightly) overstated in our
findings. However, the substantive nature of the main findings is not affected.
Results
Complete data was obtained for the 734 applicants interviewed, including their total
score from the interview. There were 320 interviewers, 62 per cent of whom were staff,
and 38 per cent students. Complete demographic data required for the analysis was
obtained for 306 of these interviewers. The estimate of reliability for an interview
comprising of two interviewers was 0.819, with the corresponding figure for three
interviewers of 0.871. These values indicate good reliability when compared to other
studies, for example Shaw et al8obtained a reliability value of 0.496, though this was
obtained by a different statistical method (Cronbach’s alpha) so direct comparison is
difficult.
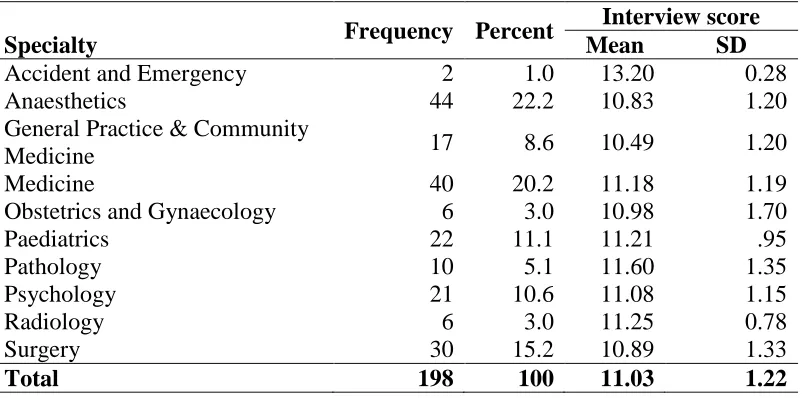
For the staff interviewers, other characteristics in which we were interested were their
and 3 respectively. As was the case with ethnicity, it proved impossible to meaningfully
include in the analysis a variable related to specialty which could not be condensed
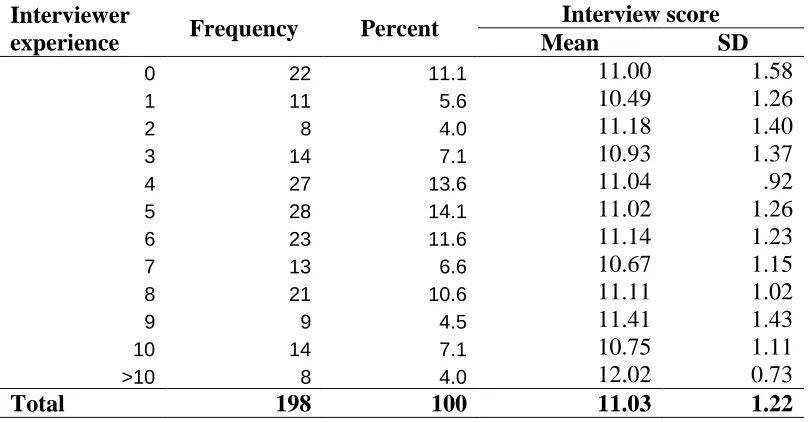
down to a small enough number. Similarly, since student interviewers do not have any
previous experience as interviewers, this characteristic could not be widely used in the
statistical modelling.
[Table 2]
[Table 3]
Of the 734 interviews in the dataset, 116 involved only two interviewers, giving a total
of 2086 individual interviewer-interviewee interactions. However, for the individual
scores from each interviewer, approximately 1% of data were missing, mainly due to
illegible handwriting. Hence, in the analysis, the number of useable
interviewer-interviewee interactions was 2007.
Analysis of interviewee performance
Potential determinants of performance by interviewees were analysed using univariate
General Linear Models with total interview score as the outcome variable, gender,
ethnicity (white/non white), school type (independent, state selective with reference
group state non-selective) as fixed effects, and socioeconomic classification and date of
birth as covariate dependent variables.
A main effects only model indicated that no predictors were playing a significant role in
determining the marks awarded to interviewees and explained less than 1% of the
The full factorial model (all main effects and their interactions) was still relatively poor,
explaining only approximately 2% of the variation in the interview total mark. In other
words, most of the variation in the marks was not accounted for by the available
predictors. In this model, no main effects were statistically significant, and the largest
interaction effect was for school type (state selective versus ethnicity (F(1,609)=9.352,
p=0.002, effect size 2%) with those non-white students from selective schools tending
to be awarded slightly lower marks than their white counterparts. For those not from
such schools, the difference was in the opposite direction.
Analysis of interviewer performance
Potential determinants of marks awarded by interviewers were also analysed using
univariate General Linear Models, with mean interview score awarded by the
interviewer as the outcome variable, gender, ethnicity (white/non white), staff or student
and school type as fixed effects, and socioeconomic classification as the covariate
dependent variable.
A simple model including only main effects found no predictors playing a significant
role and explained almost none of the variance in the data.
The full factorial model, including predictors and all interactions and explaining 4.8%
of the variation in the mean marks, found a small but significant gender main effect,
with male interviewers awarding slightly higher marks than females (estimated
marginal means 11.1, compared to 10.7, F(1,280)=3.999, p=0.047, effect size 1%).
( independent) with ethnicity – those from independent schools tended to give slightly
higher marks to non-white candidates, whereas those not from independent schools
tended to give higher marks to white candidates (F(1,280)=9.569, p=0.002, effect size
3%).
A separate analysis for the staff interviewers only was carried out with interviewer
experience additionally included in the model as a covariate. However, this variable did
not play a significant role in influencing interview scores.
Analysis of interviewer-interviewee interaction
An attempt was made to analyse how well-matched each interviewee-interviewer pair
was with regard to their personal and background characteristics, and whether or not
this matching affected the interview score. Factors included in the matching were
gender, ethnicity (white or non-white), socio-economic status (condensed into three
categories, ‘higher managerial’, ‘lower managerial’ and ‘intermediate or lower’) and
school type (using the original three categories).
The number of these factors that matched exactly for each interview pairing was totalled
to produce a matching score on a scale from 0 to 4. For example if both the interviewer
and the interviewee were white and female but from different socio-economic and
school backgrounds a matching score of 2 was given. A good spread of matching
scores, as shown in Table 4, was found with a mean matching score of 1.85, and median
of 2.
Treating the matching and interview scores as interval measures and calculating the
(Pearson) correlation coefficient gave a non-significant result (r=-0.006, n=1611,
p=0.815). There is therefore strong evidence of no relationship between the score
awarded by the interviewer and the extent of the matching on personal characteristics
between the interviewee and the interviewer.
Discussion
A limitation of our study is the inclusion of only one annual intake from a single
medical school. With over 700 interviews performed each year and with most involving
three interviewers, we still captured over 2000 interviewee-interviewer interactions, and
the estimated reliability of the process was acceptably high. However, considering the
large number of factors under consideration that may have influenced the interview
score, a larger number would have been desirable. Our results therefore provide some
evidence that a large effect of interviewer characteristics on interview scores is not
occurring, but we accept that we have not proven that no effect exists. Obtaining a
larger and still reliable dataset would not be possible in our medical school, as, in
keeping with good practice, the interview questions and grade-descriptors used are
reviewed and modified annually. Thus collecting data over several years would lead to
unacceptable variations in interview conduct between years. Whilst all medical schools
continue to use their own individual interview systems which are reviewed annually, a
larger and more useful dataset will remain unattainable.
Previous research on medical school interviews has focussed mainly on the contribution
academic and clinical performance. In this respect the interview has been described as
being of little or limited practical value9and as ‘a very elaborate, labour-intensive and
expensive lottery’.10Despite this view, 21 out of 23 UK medical schools continue to use
the interview as part of their selection process.11Possible other reasons for continuing
with this expensive process include marketing their institution to the applicants or as a
way of screening out applicants with dysfunctional tendencies, though there is evidence
that the interview is also ineffective for this task.12Given that there is little research
evidence to support the use of interviews, ensuring that an interview process is free
from bias is essential. This will then guarantee, at the very least, that particular types of
candidates are not systematically excluded from equal access to medical school.
There is little previous research concerning the influence of social factors on
interviewee performance. A recent study from Canada found no differences in interview
scores for candidates from rural, urban or regional backgrounds.13A study of applicants
to medical school in 1992/3 found that female applicants gained higher scores at
interview than male, irrespective of the gender of the interviewer.8The same study also
found that African-American applicants performed better than other ethnic groups, but
this was thought to reflect an affirmative action policy that was in place at the time of
the study. Finally a study of 356 students admitted to a single US medical school
between 1987-1990 found no significant contribution of interviewee age, sex or
rural/non-rural residence to interview scores.14Our results are in keeping with these
studies finding little evidence that interviewee personal characteristics make any
substantial difference to their performance at interview, those included in this study
explaining less than 2% of the variation in interview score given. There were some
scored lower than their white counterparts if from a selective state school and higher if
from a non-selective or independent school. Speculation regarding the causes of this
observation is inadvisable given that our sample was not large enough to analyse
individual ethnic groups, who may systematically vary in their interview performance.
We found no differences in the scores awarded by student interviewers compared with
staff. Medical students sit on interview panels at 6 out of 21 UK medical schools that
use interviews11and a previous study from a UK medical school found that overall
scores given by students and staff did not differ significantly. We believe that the
student’s presence on the panel makes the interview less daunting to interviewees and
adds to the overall validity of the process. Also, senior medical students value the
opportunity to carry out such a responsible role, and we therefore feel our results
support the continued participation of students in interviews.
Previous research on the influence of interviewer personal characteristics on interview
scores is also limited. A study based on applicants between 1991-3 found no differences
in the scores awarded by male and female interviewers.8Three papers by Elamet al
addressed the influence of some interviewer demographic factors on interviews
performed between 1984 and 1991. Members of the admissions committee who sat on
interview panels gave lower scores than other panel members, and there were small
differences in the scores awarded between physician/non-physician and male/female
interviewer groups.14However, these effects were small, accounting for only 5% of the
observed variance in interviewer ratings.15These studies also showed that interviewer
scores given by female, medically qualified and admission committee member
results, from a larger dataset and a more recent cohort, are similar to those of Elam,
showing little influence of the personal characteristics of interviewers on the scores
awarded, these factors explaining less than 5% of the variation seen. We have found
similarly small but significant interactions, in our study with male interviewers giving
an estimated 0.4 of a point (out of 15) more than female interviewers, and interviewers
from independent schools giving slightly higher marks to non-white applicants.
However, these effects are reassuringly small.
In conclusion, this study has found no evidence that the personal characteristics of
interviewees have any significant effect on their performance at interview. Variations in
success rates in achieving an offer for medical school between applicants of different
social backgrounds do not seem to arise at the interview stage of the selection process in
this large and recent cohort. This study has also provided reassurance that the personal
background of our interviewers has no significant influence on the scores they award
when interviewing. Interviewer training and a semi-structured interview format seem to
be achieving their desired aims of allowing interview scores to be awarded solely on
performance in the interview, free from potential bias as a result of social matching
References
1. McManus IC. Factors affecting likelihood of applicants being offered a place in
medical schools in the United Kingdom in 1996 and 1997: retrospective study.BMJ
1998;317: 1111-7.
2. Admissions to Higher Education Steering Group. 2Fair admissions to higher
education: recommendations for good practice. London: Department of Education and
Skills, 2004.
3. Garlick PB, Brown G. Widening participation in medicine.BMJ2008;336: 1111-3.
4. Ip H, McManus IC. Increasing diversity among clinicians. Is politically correct but is
costly and lacks evidence to support it.BMJ2008;336: 1082-3.
5. McManus IC, Richards P, Winder BC, Sproston KA, Styles V. Medical school
applicants from ethnic minority groups: identifying if and when they are disadvantaged.
BMJ1984;310: 496-500.
6. Office for National Statistics.The National statistics socio-economic classification
user manual. Newport: Office for National Statistics, 2005.
7. Crossley J, Russell J, Jolly B, Ricketts C, Roberts C, Schuwirth L, Norcini J.
'I'm pickin' up good regressions': the governance of generalisability analyses.
8. Shaw DL, Martz DM, Lancaster CJ, Sade RM. Influence of medical school
applicants' demographic and cognitive characteristics on interviewers' ratings of
noncognitive traits.Acad Med1995;70: 532-6.
9. Goho J, Blackman A. The effectiveness of academic admission interviews: an
exploratory meta-analysis.Med Teach2006;28: 335-40.
10. Norman G. The morality of medical school admissions.Adv Health Sci Educ2004;
9: 79-82.
11. Parry J, Mathers J, Stevens A, Parsons A, Lilford R, Spurgeon P, Thomas H.
Admissions processes for five year medical courses at English schools: review.
BMJ2006;332: 1005-9.
12. Knights JA, Kennedy BJ. Medical school selection: screening for dysfunctional
tendencies.Med Educ2006;40: 1058–64.
13. Wright B, Woloschuk W. Have rural background students been disadvantaged
by the medical school admission process?Med Educ2008:42: 476–9.
14. Elam CL, Andrykowski MA. Admisisons interview ratings: relationship to applicant
academic and demographic variables and interviewer characteristics.Acad Med1991;
15. Elam CL, Andrykowski MA. Relationship of interviewer and applicant variables to
admission interview ratings of medical school matriculants and nonmatriculants.Acad
Med1992;67: 865.
16. Elam CL, Johnson MMS. Prediction of medical student’s academic performances:
Table 1: Interviewers and interviewees by ethnicity
Ethnic group Interviewers Interviewees
Frequency Percent Frequency Percent
Detail
White 262 81.9 571 77.8
Asian-Indian 17 5.3 50 6.8
Asian-Pakistani 4 1.3 25 3.4
Asian-Bangladeshi 3 0.9 4 0.5
Asian-Chinese 4 1.3 4 0.5
Asian-Other 20 6.3 20 2.7
Black-Caribbean 0 0.0 2 0.3
Black-African 3 0.9 15 2.0
Black-Other 2 0.6 0 0.0
Mixed-White and Black
Caribbean 0 0.0 4 0.5
Mixed-White and Asian 1 0.3 12 1.6
Mixed-Other Background 3 0.9 8 1.1
Other ethnic background 0 0.0 11 1.5
Overseas 0 0.0 5 0.7
Missing 1 0.3 3 0.4
Total 320 100 734 100
Summary
White 262 81.9 571 77.8
Non-white 57 17.8 160 21.8
Missing 1 0.3 3 0.4
Table 2: Staff interviewer speciality and mean interview score given.
Specialty Frequency Percent
Interview score
Mean SD
Accident and Emergency 2 1.0 13.20 0.28
Anaesthetics 44 22.2 10.83 1.20
General Practice & Community
Medicine 17 8.6 10.49 1.20
Medicine 40 20.2 11.18 1.19
Obstetrics and Gynaecology 6 3.0 10.98 1.70
Paediatrics 22 11.1 11.21 .95
Pathology 10 5.1 11.60 1.35
Psychology 21 10.6 11.08 1.15
Radiology 6 3.0 11.25 0.78
Surgery 30 15.2 10.89 1.33
Table 3: Staff interviewer experience (number of half-day interview sessions performed in the last five years) and mean interview score given.
Interviewer
experience Frequency Percent
Interview score
Mean SD
0 22 11.1 11.00 1.58
1 11 5.6 10.49 1.26
2 8 4.0 11.18 1.40
3 14 7.1 10.93 1.37
4 27 13.6 11.04 .92
5 28 14.1 11.02 1.26
6 23 11.6 11.14 1.23
7 13 6.6 10.67 1.15
8 21 10.6 11.11 1.02
9 9 4.5 11.41 1.43
10 14 7.1 10.75 1.11
>10 8 4.0 12.02 0.73
Table 4: The distribution of matching scores.
Matching score Frequency Percentage Mean interview
score
0 111 5.6 11.03
1 468 23.6 11.07
2 644 32.4 11.10
3 325 16.4 10.87
4 63 3.2 11.38
Missing† 374 18.8
Total 1985 100 11.05